That Number You Keep Ignoring in top

load average: 0.35, 0.42, 0.40You've seen this line a thousand times. Maybe you glance at it, shrug, and move on to the CPU percentages that seem more useful. Three cryptic decimal numbers don't exactly demand attention, and honestly, nobody explains what they mean when you're learning this stuff.
But load average is one of those metrics that separates "my server feels slow" from "I know exactly why my server feels slow." Once it clicks, you'll start checking it reflexively whenever something seems off.
It's a queue, not a percentage
The mental model that works: think of your CPU cores as checkout lanes at a grocery store. Load average is the average number of customers either being served or waiting in line. That's it. Not a percentage, not utilization, just a count of processes that want CPU time.
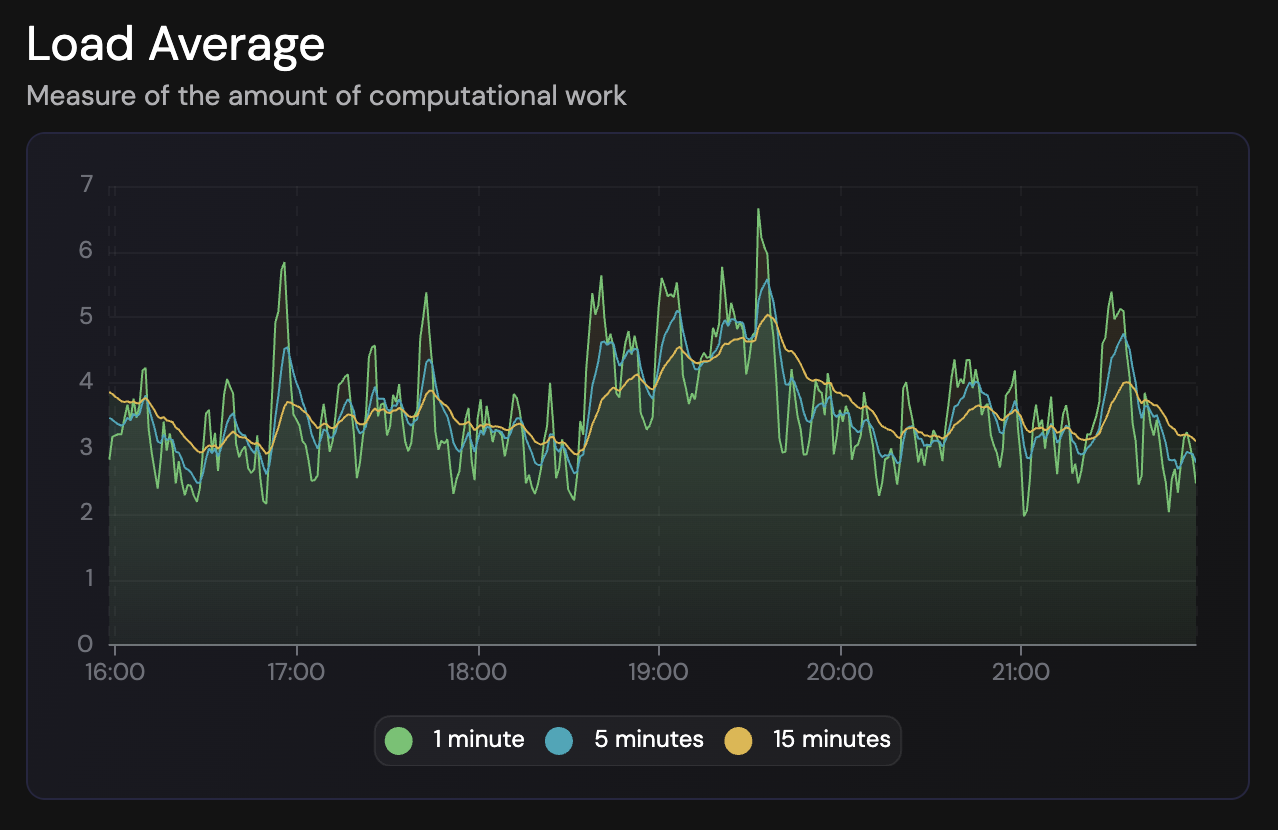
Those three numbers represent the same measurement over different time windows. The first is the last minute, the second is five minutes, and the third is fifteen. Having all three lets you see whether load is spiking, sustained, or trending in some direction.
On a single-core machine, a load of 1.0 means the CPU is exactly fully utilized. No queue forming, no idle time either. The system is keeping up with demand. Bump that to 2.0 and you've got one process running while another waits its turn, which means your system has twice as much work queued up as it can handle simultaneously.
This scales linearly with cores. Got a 4-core box? A load of 4.0 is your new "fully busy but keeping up" baseline. Hit 8.0 on that same machine and half your processes are stuck waiting for their turn on a CPU.
# Quick way to see your core count
nproc
# or
grep -c ^processor /proc/cpuinfo
The part that trips everyone up
Load average doesn't just count processes waiting for CPU. It also includes processes in "uninterruptible sleep," which typically means they're blocked on disk I/O or certain types of network operations. The kernel counts them because, from a scheduling perspective, they represent work the system is trying to do but can't complete yet.
This is why you can see a load of 6.0 on a 4-core machine while CPU usage sits at 30%. The cores aren't saturated; processes are waiting on something else entirely. Your storage or network might be the actual bottleneck, and the load average is reflecting that contention even though the CPUs themselves have cycles to spare.
The practical upshot: high load with low CPU usage usually points away from the processor and toward I/O somewhere in the system.
Our guide on disk I/O monitoring covers how to diagnose these storage bottlenecks when load points to I/O problems.
Reading it like a detective
When load looks suspicious, I start with a quick triage:
High load + high CPU usage? The system genuinely needs more compute power. Processes are both running and queuing because there's real CPU-bound work happening. Time to look at what's actually consuming cycles and whether it's expected.
High load + high iowait? Storage is likely the constraint. The iostat command can show you disk utilization and how long operations are taking. If you see utilization near 100% on a device, that's your culprit.
# Show disk I/O stats every second
iostat -x 1

# Look for %util and await columns
High load + low CPU + low iowait? This is the weird one. Check for processes stuck in D state with ps aux | grep " D". These are processes waiting on I/O that isn't completing, which can happen with NFS issues, hung network mounts, or kernel-level problems. It's less common but worth knowing about.
The trend matters more than the moment
A spike to 12.0 on a 4-core machine for 30 seconds? Probably just a cron job kicking off, a deployment running, or some batch process doing its thing. Check back in five minutes and it might have resolved itself.
But if your 15-minute average is consistently above your core count, that's different. The system is perpetually playing catch-up, and your users are probably noticing latency even if nothing is crashing or throwing errors.
Comparing the three numbers tells you which direction things are heading:
When the 1-minute average is high but the 5 and 15-minute numbers are lower, you're looking at a recent spike that may or may not persist. If all three are roughly equal and elevated, the load is sustained and worth investigating. And if the 1-minute is low while the 15-minute is still high, load is decreasing, maybe because whatever caused it finished or you just deployed a fix.
Some practical context
I generally don't start worrying until load consistently exceeds about 70% of the core count. An 8-core machine sitting at 5.5 is busy but probably fine. Once you're regularly hitting 100% of cores, you're at capacity, and going above that means processes are queuing up.
# One-liner to check load vs cores
echo "Load: $(cat /proc/loadavg | cut -d' ' -f1-3) | Cores: $(nproc)"
Different people set different alerting thresholds. Some alert at 80% of core count, others calculate per-core load (divide by nproc) and alert when it exceeds 1.0. Both approaches are reasonable; the important thing is picking something and being consistent. Try our load average interpreter tool to quickly assess whether your current numbers need attention.
Once you've decided on thresholds, configuring server alerts ensures you're notified automatically when load stays elevated.
Don't look at it in isolation
Load average tells you something is happening, but not necessarily what. To actually diagnose problems, you need to correlate it with other metrics:
A custom dashboard that correlates metrics side by side makes this investigation much faster than bouncing between terminal commands.
vmstat 1shows memory pressure and swap activityiostat -x 1reveals disk bottleneckstoporhtopsorted by CPU or memory shows which processes are involveddmesgmight have kernel complaints if something is really wrong
The pattern I follow: high load leads me to check CPU usage, and if CPU is low, I check iowait. If iowait is high, I dig into disk stats to find either a slow drive or a process hammering storage. Having a monitoring tool that shows all of these on one screen makes this faster than bouncing between terminal commands. FiveNines does this, putting load average alongside disk and CPU metrics so you can spot correlations without the context-switching.
The takeaway
Load average is a reliable early warning that something in your system needs attention. It's not a CPU meter, it's a demand meter, and that distinction matters when you're trying to figure out why things feel slow.
Next time you SSH into a sluggish box, actually look at those three numbers and compare them to your core count. If load is high but CPU isn't, you've already ruled out processor saturation as the cause. That's half the debugging done before you've even run a second command.


