One platform for server, network, uptime and cron monitoring.
Stop running Prometheus, UptimeRobot and healthchecks.io side by side. Monitor Linux and Windows servers, switches, routers, websites and scheduled jobs from one dashboard, with an open-source agent and pricing that does not require a sales call.
★★★★★ Trusted by engineers and MSPs in 30+ countriesNo credit card · Live in 2 minutes · Install the agent from your setup wizard
Trusted by


Built for the way your team works
Client infrastructure, hosting fleets, SaaS production or your own servers: Fivenines fits the workflow without forcing an enterprise rollout.
For DevOps, SRE and sysadmins
Infrastructure monitoring for teams that need server metrics, uptime checks and alerts without running Prometheus, Grafana and Alertmanager themselves.
- ✓Replace three self-managed tools with one monitoring platform.
- ✓Keep server monitoring, uptime checks and cron job monitoring in one place.
- ✓Start with the live demo or create a trial without a credit card.
For MSPs
Monitor client servers, network devices and websites from one dashboard. Use client groups, white-label status pages and billing exports without enterprise pricing.
- ✓Group infrastructure by client.
- ✓Publish white-label status pages.
- ✓Export usage data when monitoring becomes a managed service line.
For hosting providers
Monitor bare-metal, VPS and container fleets with the open-source agent, SNMP network checks, REST API provisioning and status pages for customers.
- ✓Roll out agent-based server monitoring across fleets.
- ✓Track network devices through SNMP.
- ✓Use the REST API and Terraform provider for provisioning workflows.
For solo operators
Run 5 or 50 servers without buying an enterprise tool. Start with the €19 plan, get alerts in the channels you already watch, and scale when the fleet grows.
- ✓Use transparent pricing from €19/month.
- ✓Get alerts in Slack, Telegram, Discord, Pushover, Email or webhooks.
- ✓Keep cron jobs, uptime checks and server metrics together.
From Zabbix to Fivenines in an afternoon
“Fivenines was up on 100+ of our servers in 40 minutes. During a recent service disruption it was the only platform that actually pointed us to the root cause. We're now at 300+ servers monitored, and we use Fivenines as part of our sales pitch with new clients.”
Daniel Preni, Systems Engineer at Southeast Networks
- 40 min
- to deploy
- 100+
- servers first rollout
- 300+
- instances now monitored
Everything you need to monitor infrastructure
Server metrics, uptime checks, cron jobs, network devices and automation. All in one place.
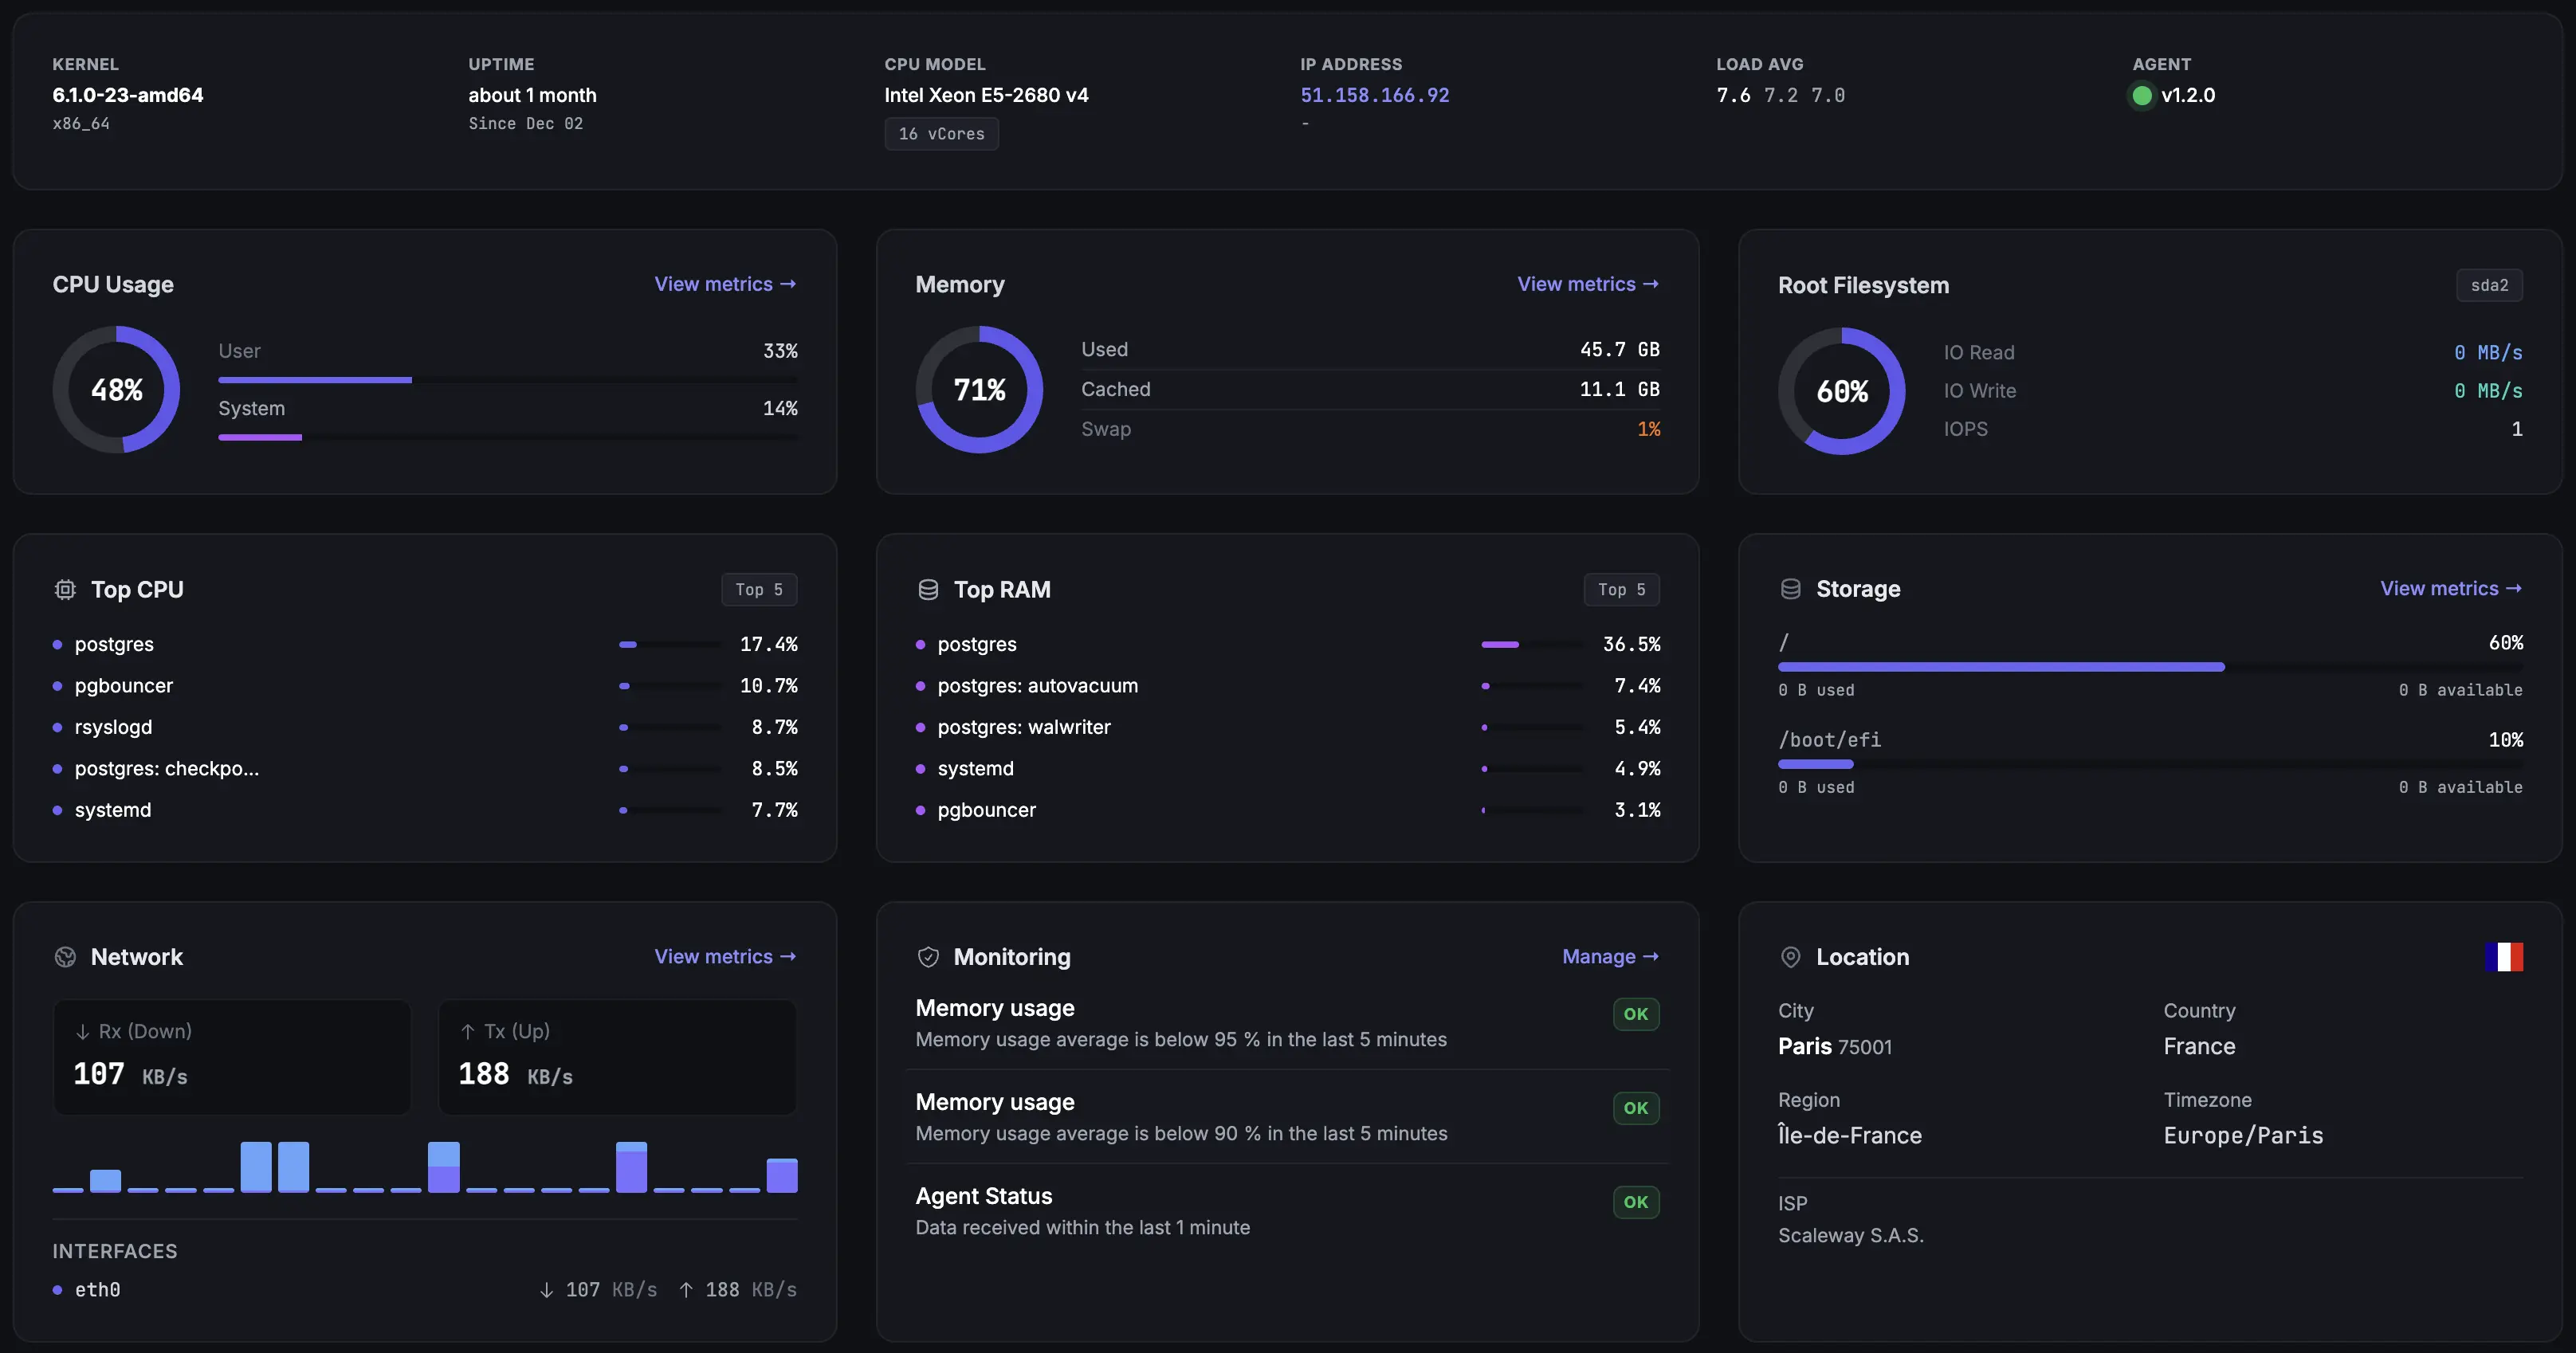
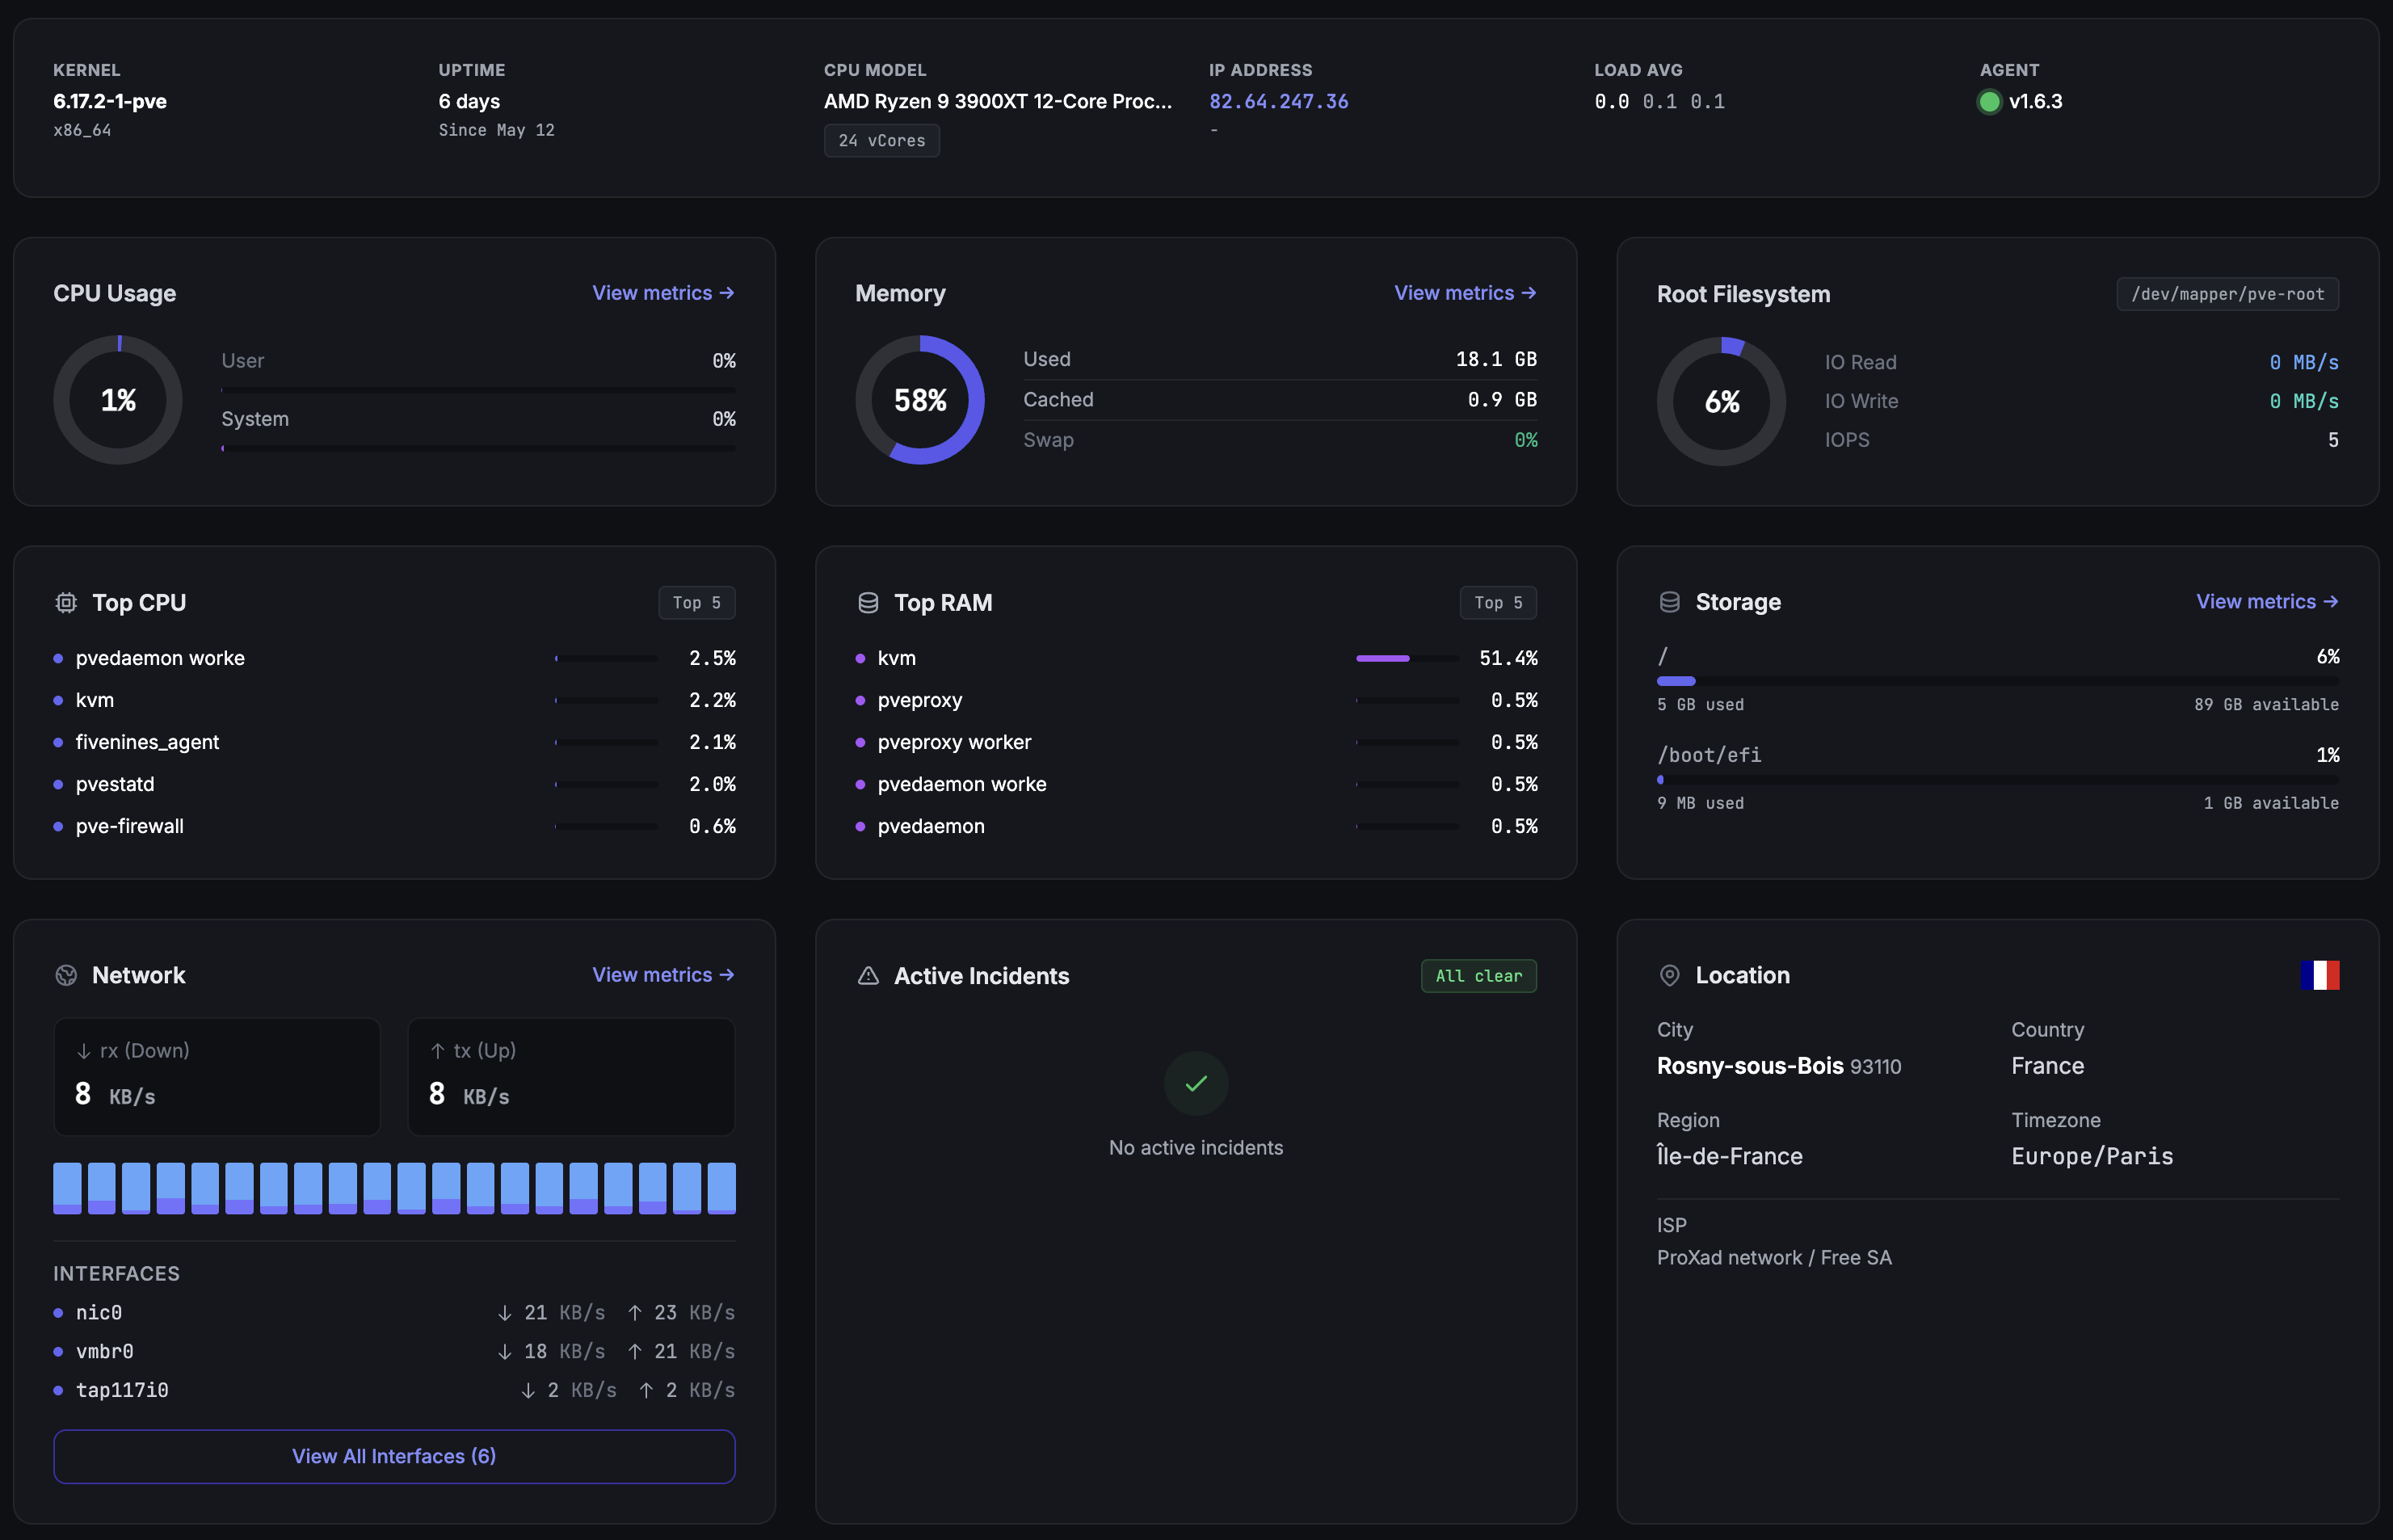
01 / Server Monitoring
Server Monitoring
Server metrics via the open-source agent on Linux and Windows. Default collection is 60 seconds, with custom intervals down to 5 seconds when needed.
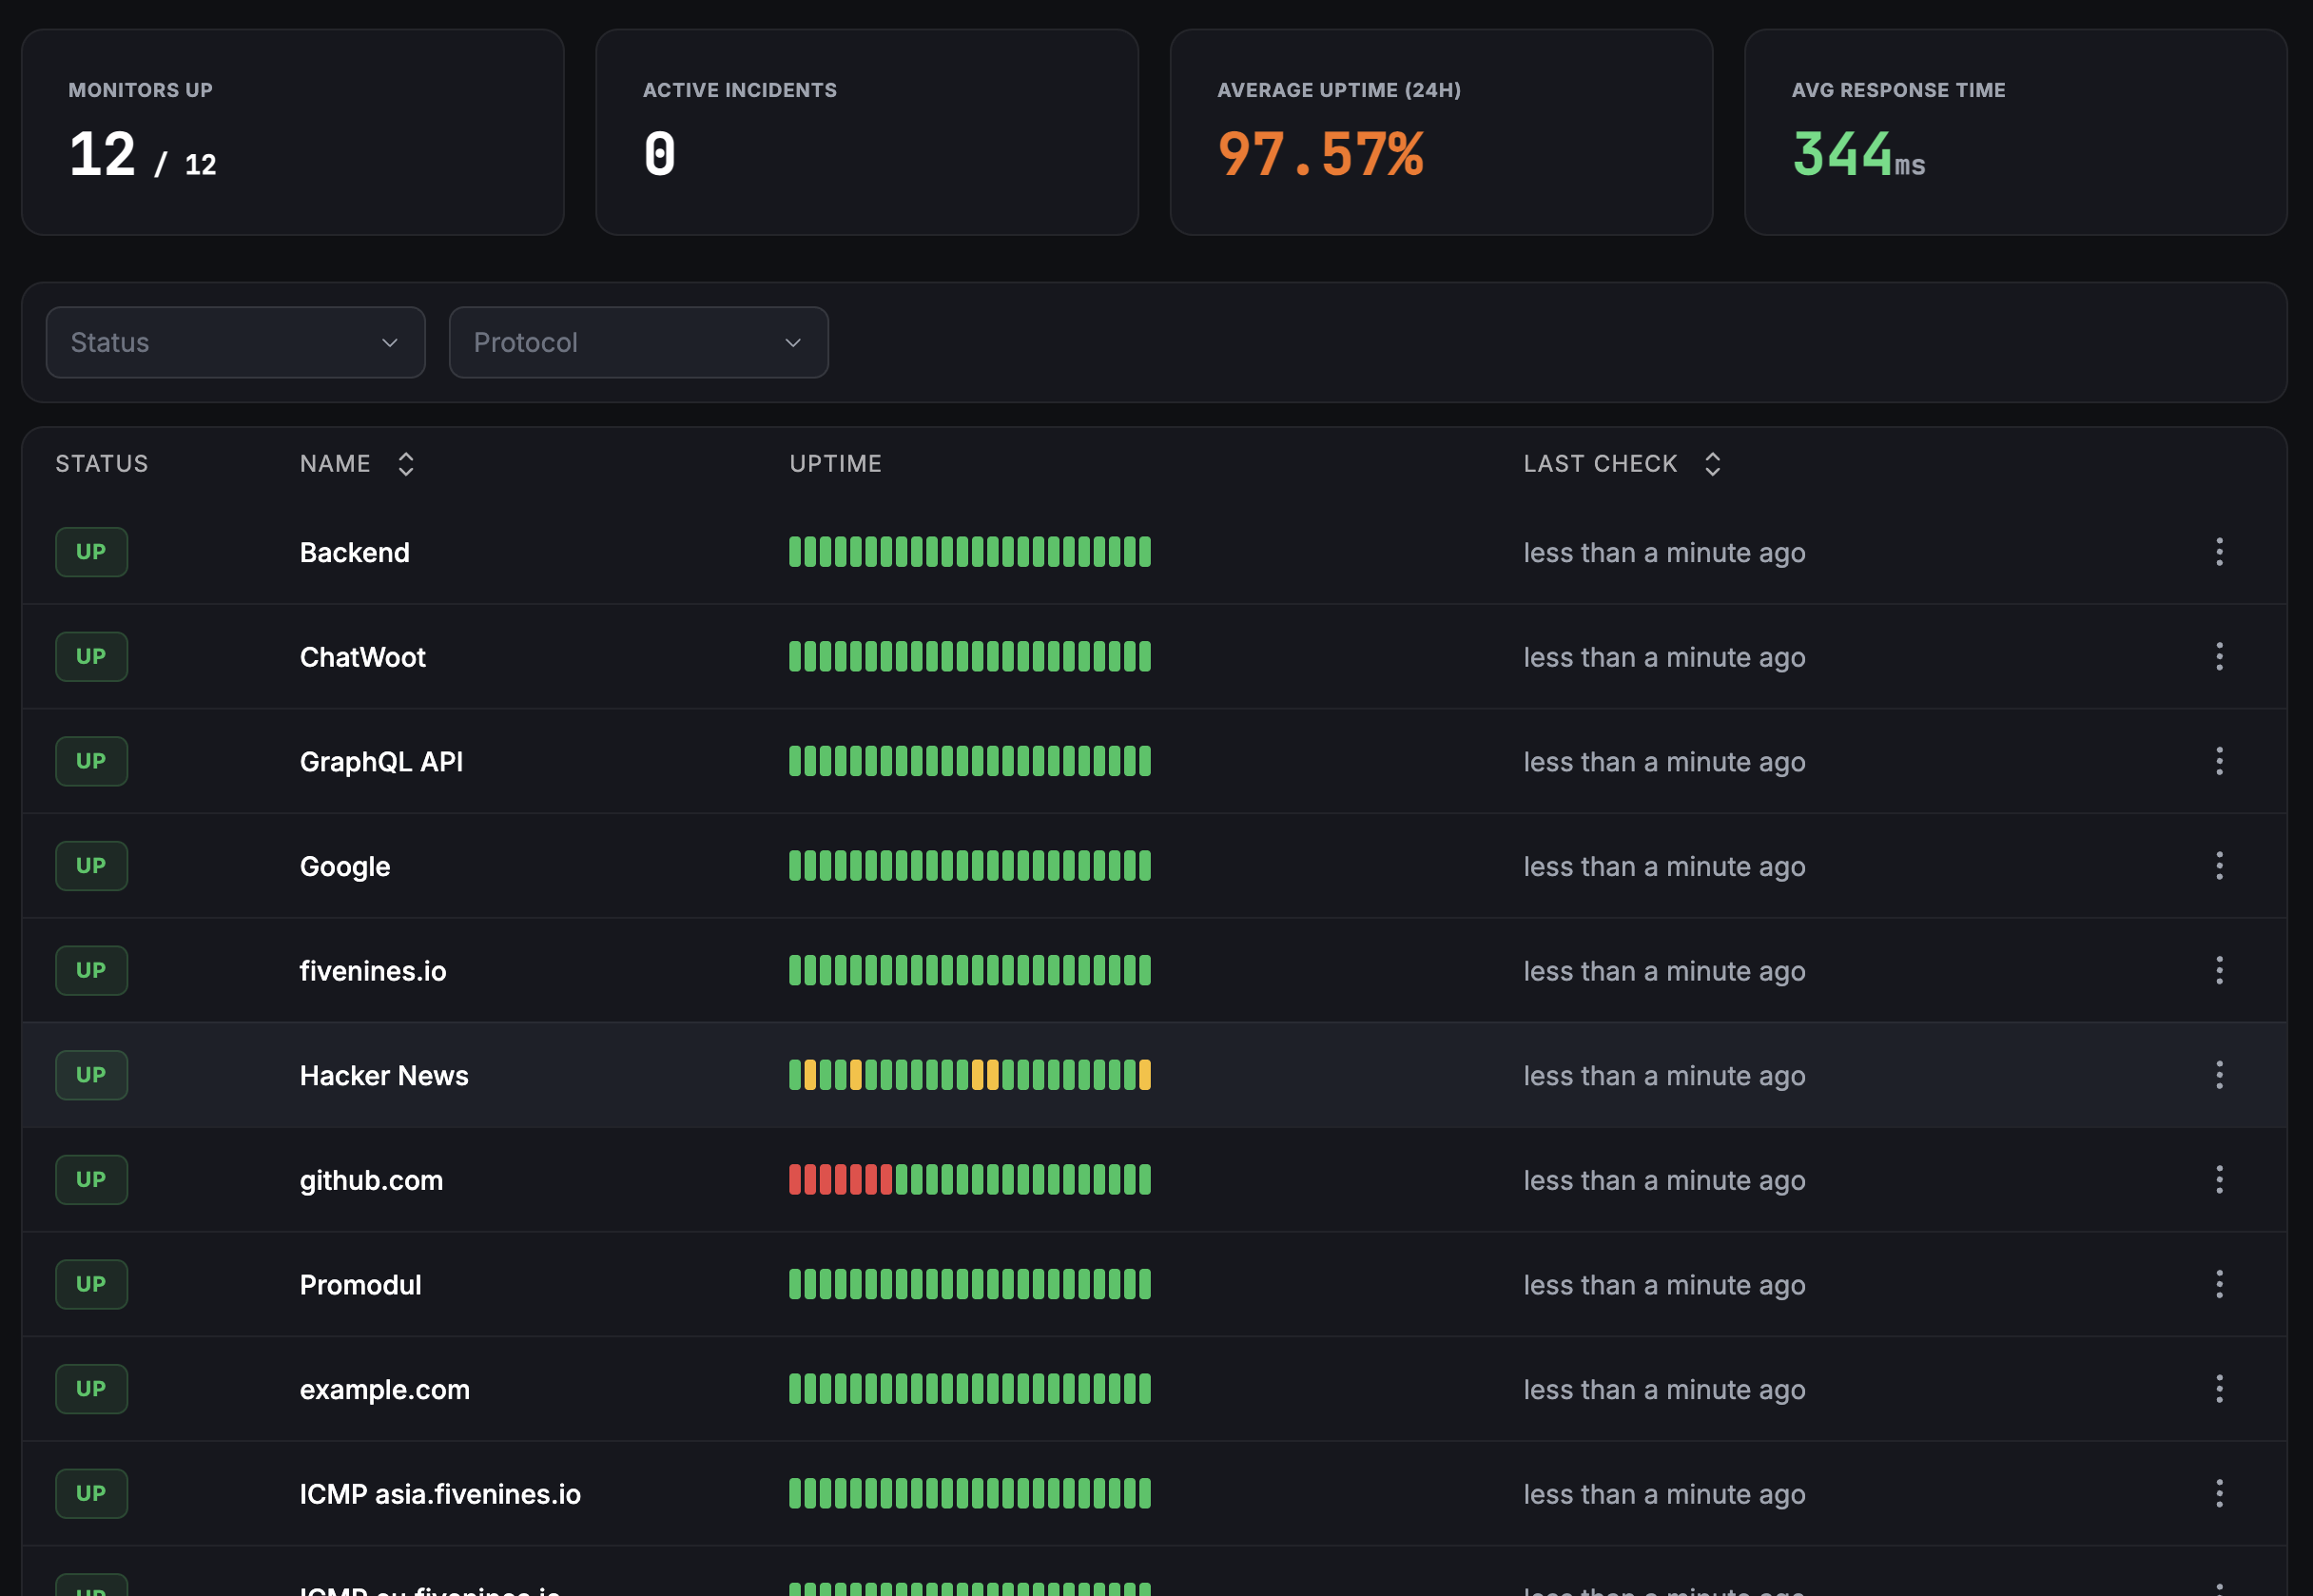
02 / Uptime & Status
Uptime & Status
HTTPS, TCP, ICMP and DNS checks from multiple regions, with confirmation before noisy alerts reach your team.
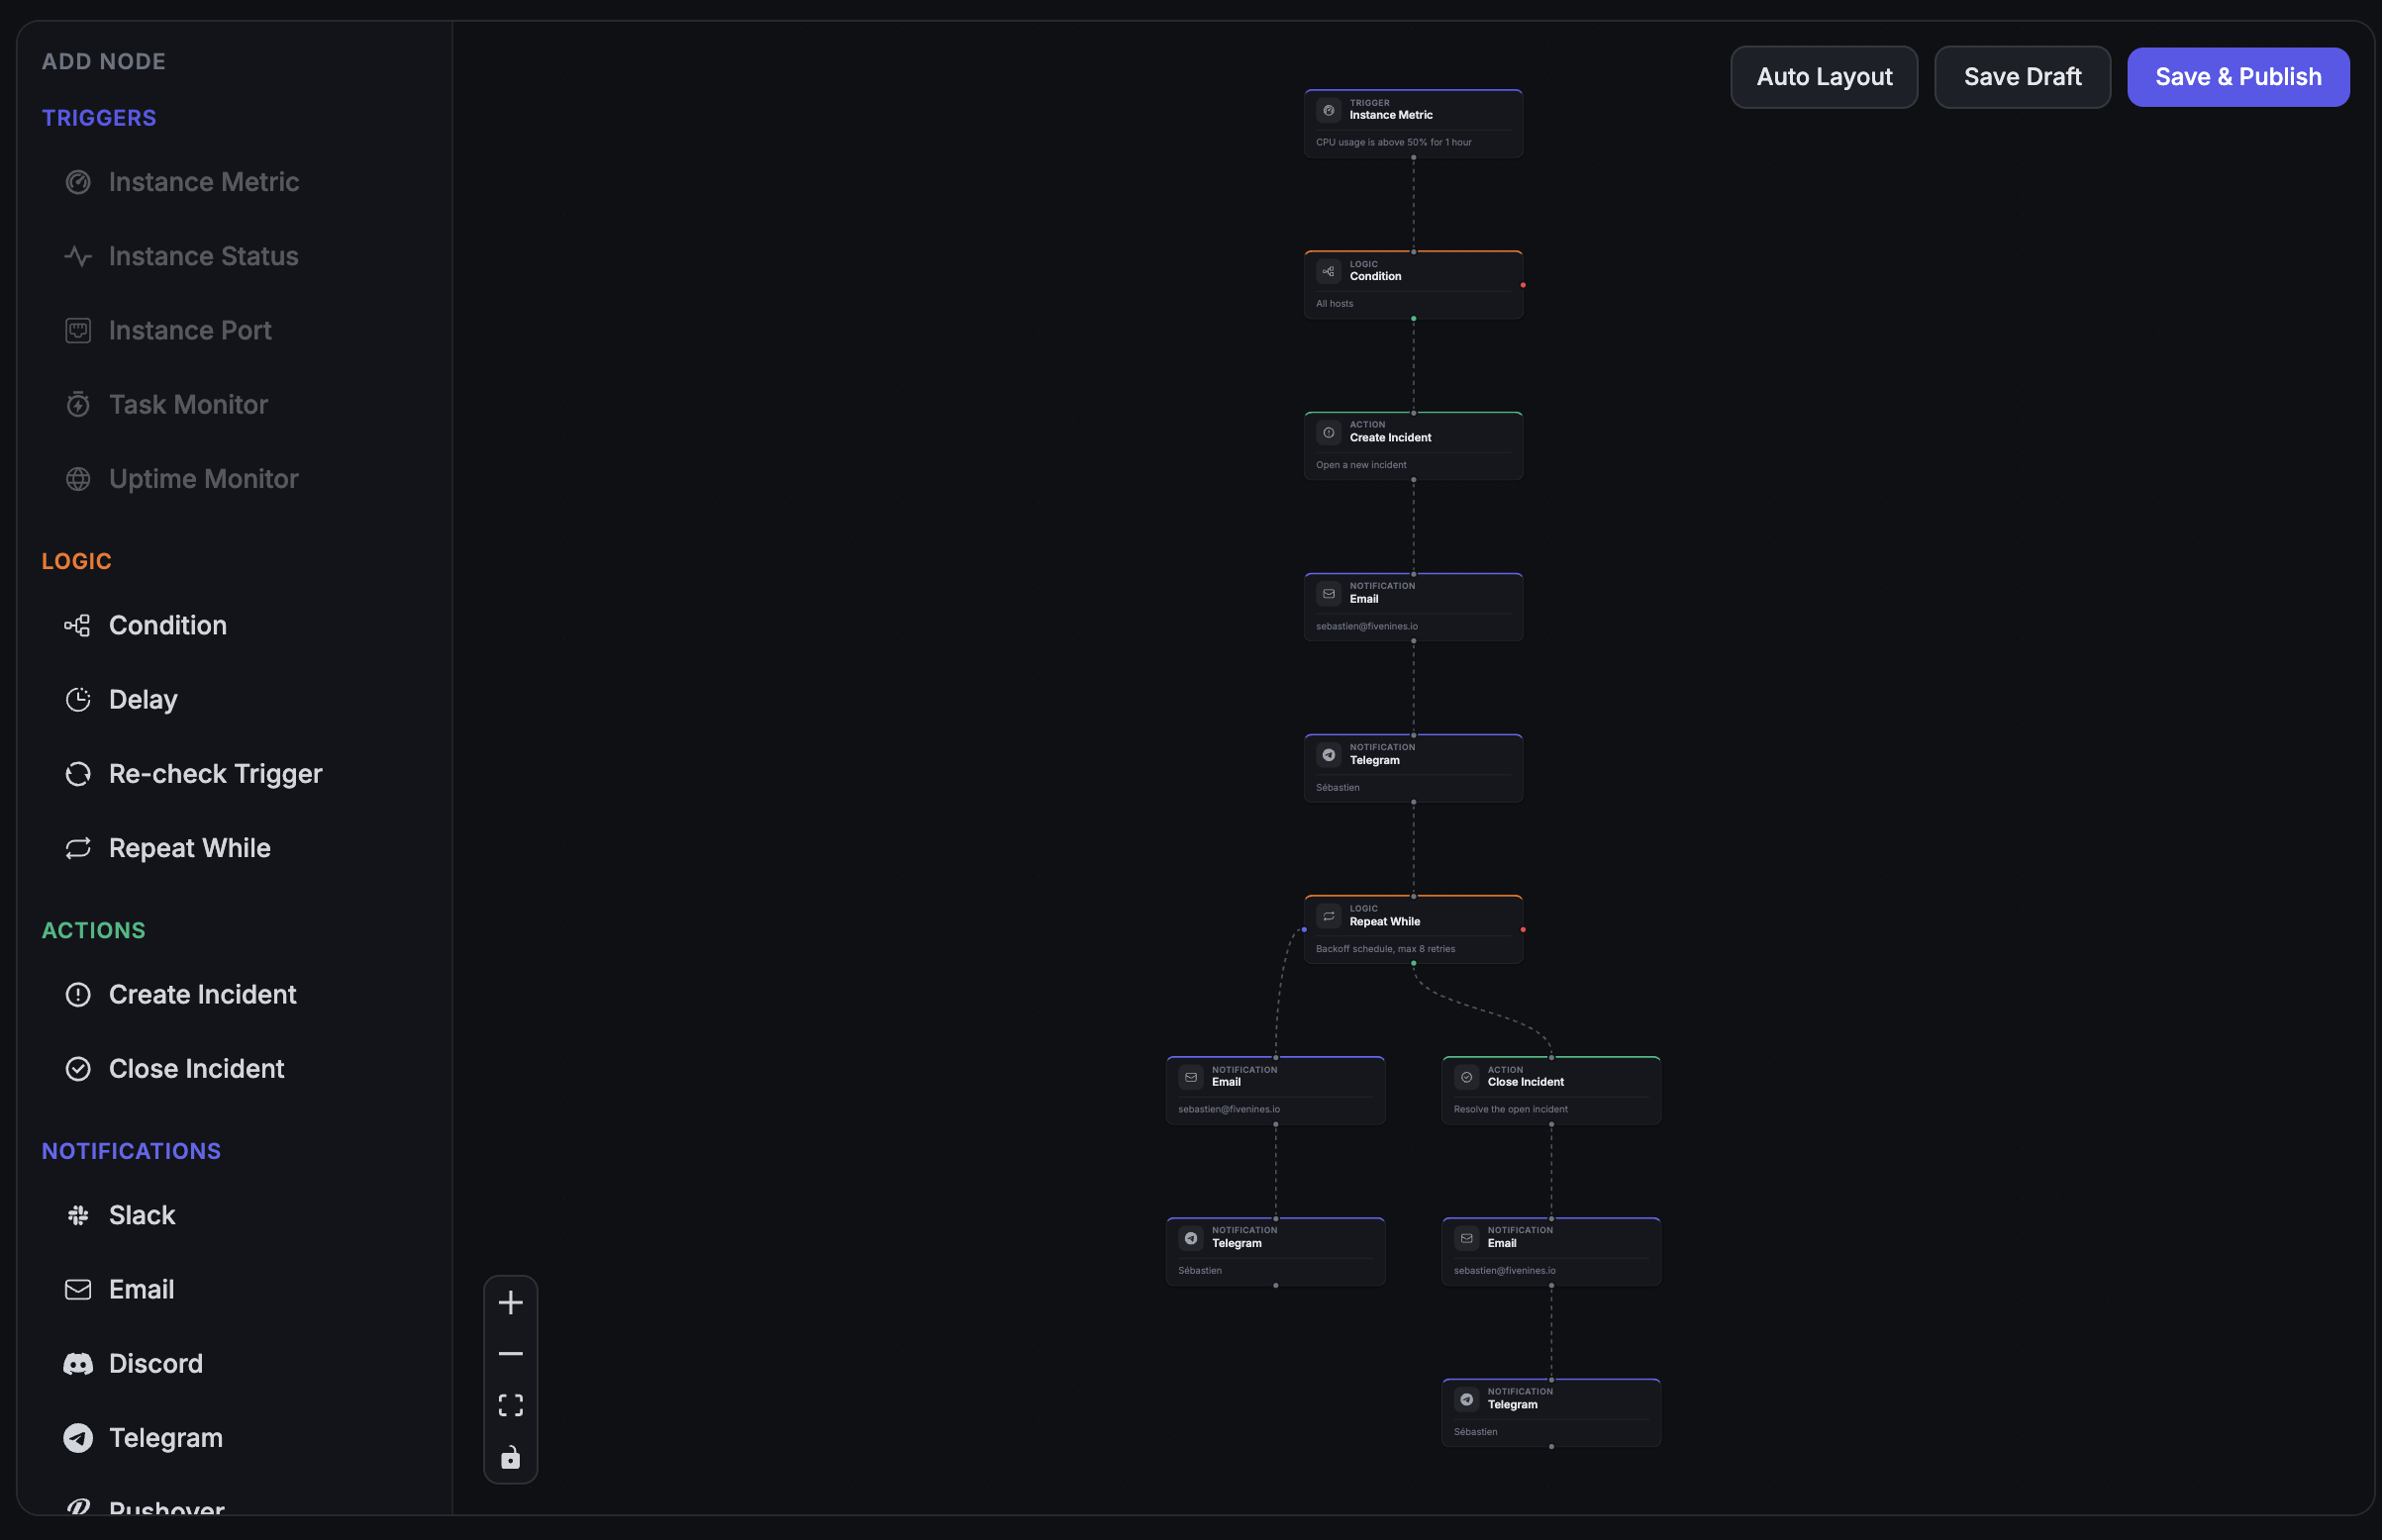
03 / Automation & Scheduling
Automation & Scheduling
Cron job monitoring plus workflow automation for routing, retries, delays and escalations.
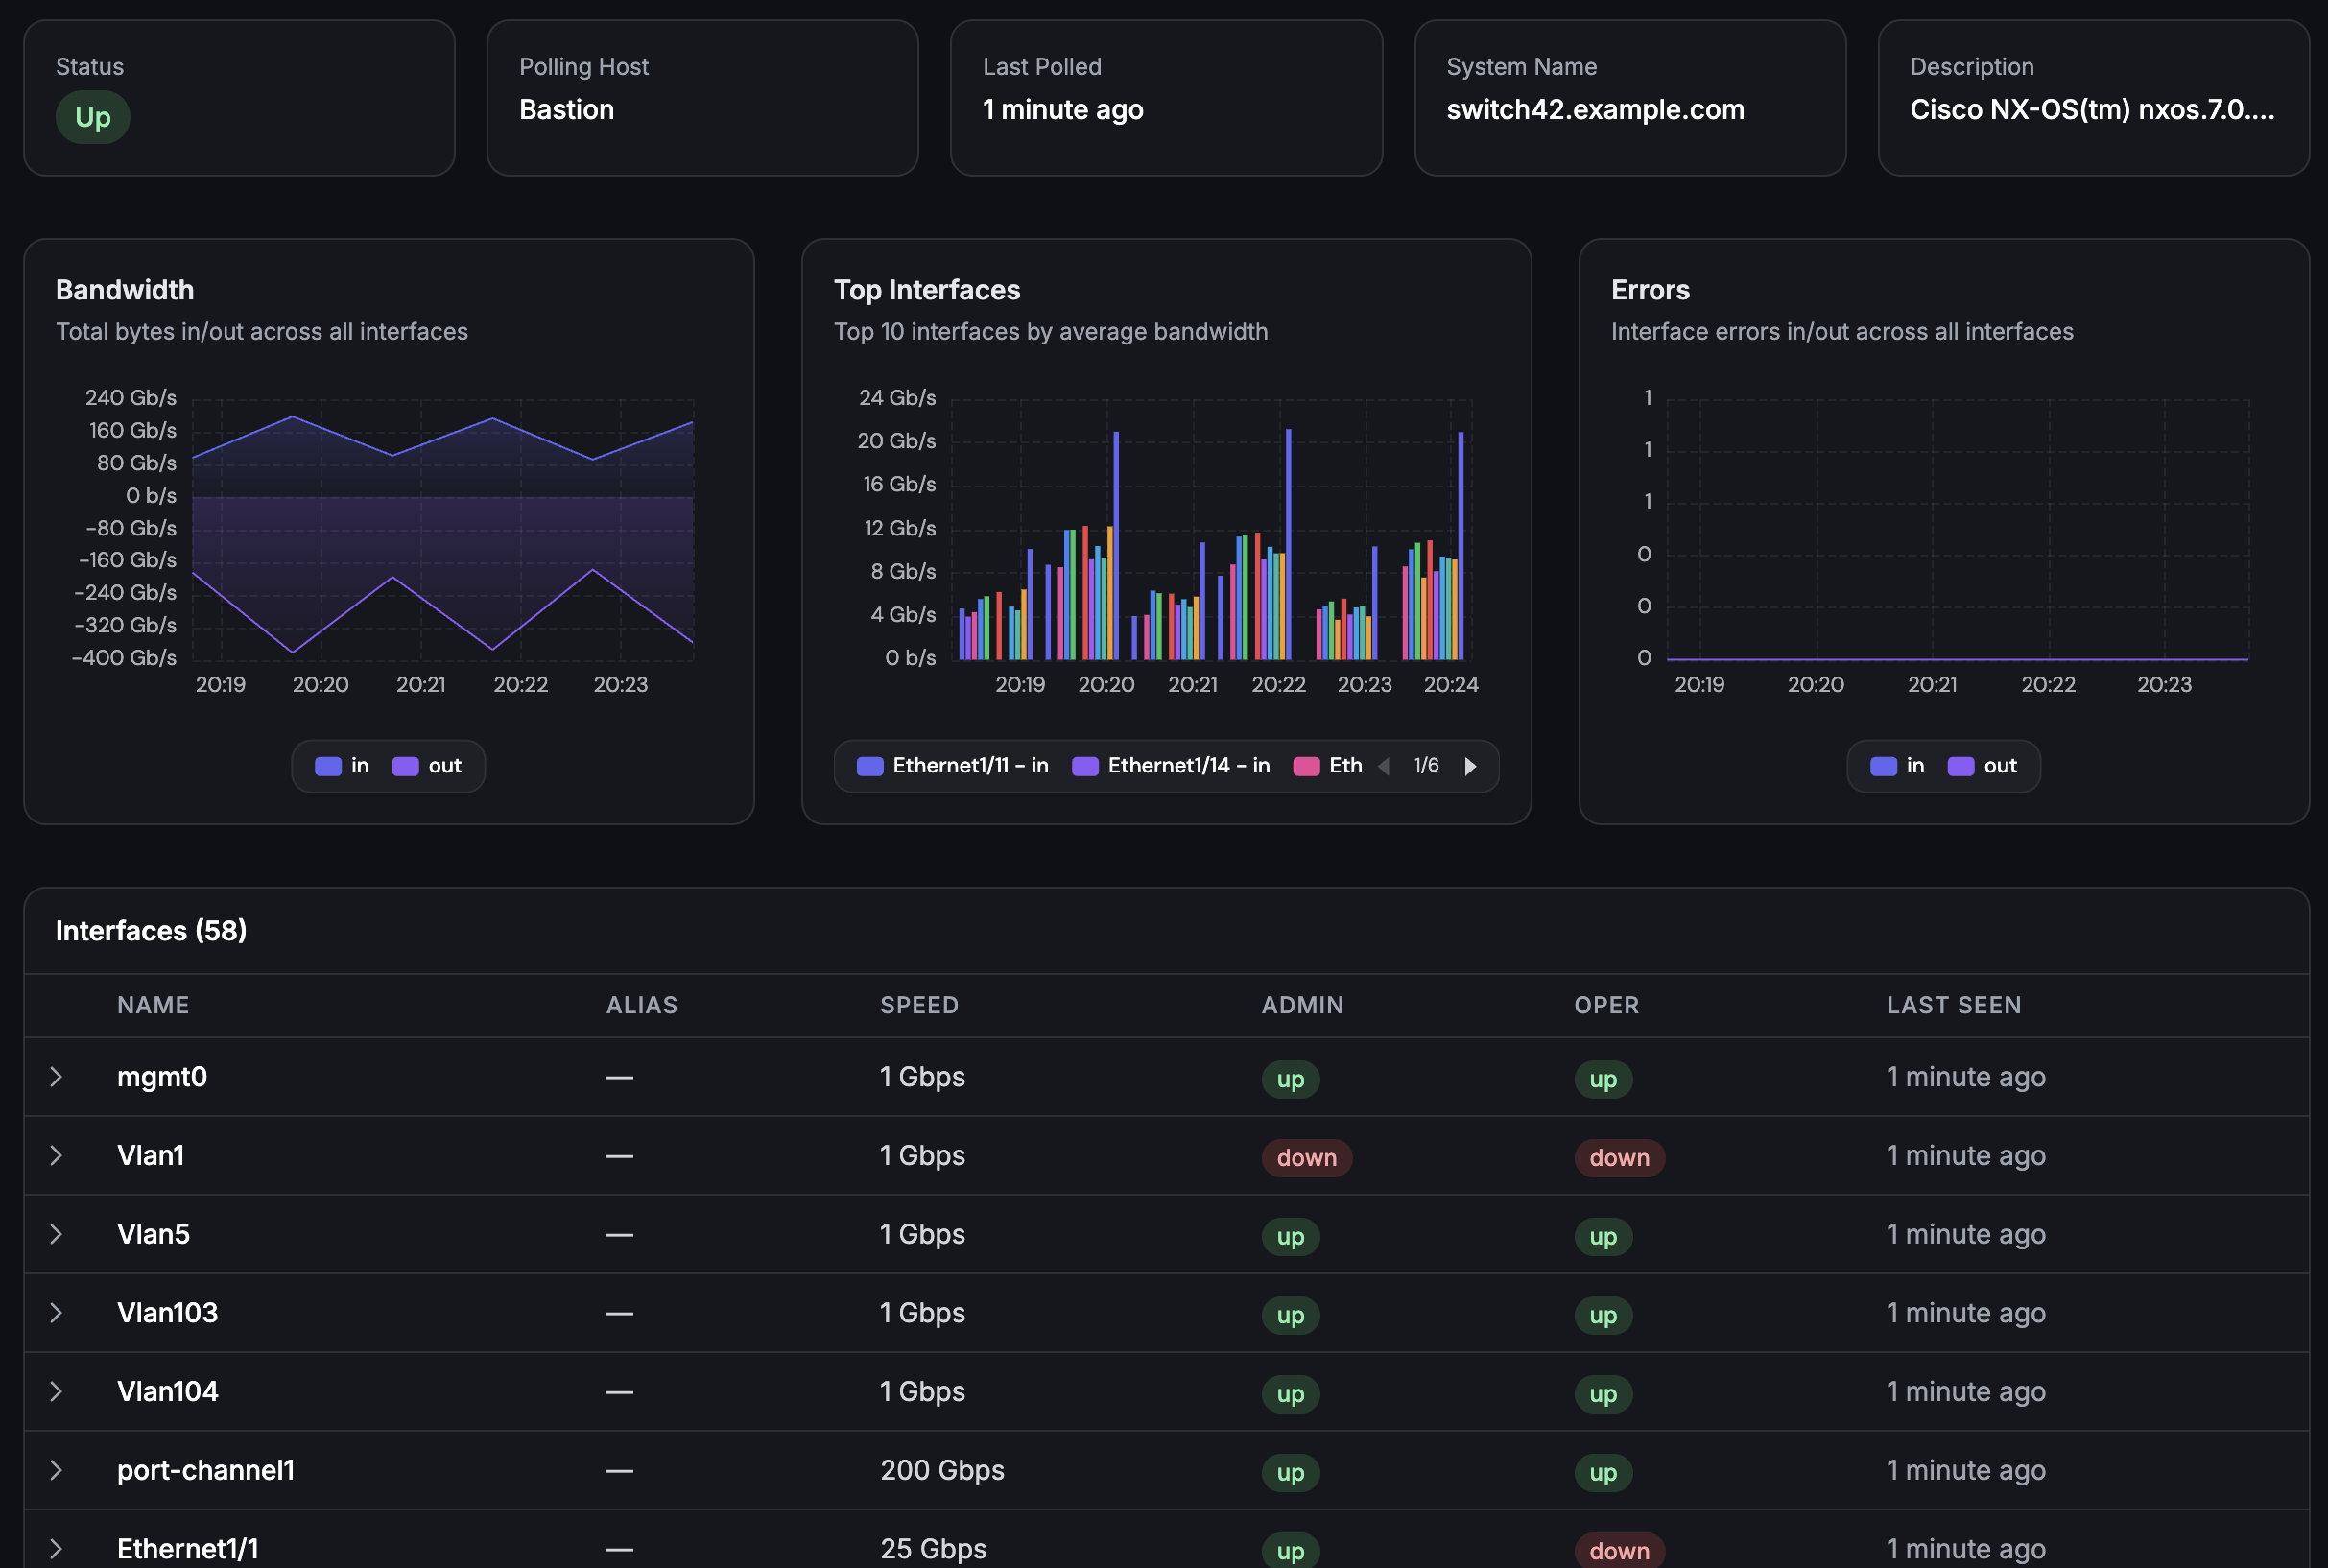
04 / Network
Network
SNMP monitoring for switches, routers and firewalls. Add devices explicitly and keep network health next to server health.
05 / Developer Tools
Developer Tools
API-first infrastructure monitoring. Manage monitors as code and export data when your stack needs it.
GET /api/v1/monitors
{
"status": "ok",
"managed_by": "terraform",
"alerts": ["slack", "webhook"]
}
Live in 3 steps. Under 10 minutes.
› ✓ trial created
› ✓ deploy agent on your instances
Create the account
The setup wizard generates the install instructions for your organization.
› workflow.trigger = cpu_high
› notify.slack('#ops')
Configure alerts and workflows
Set thresholds, build workflows, and route alerts to Slack, Telegram, Discord, Teams, SMS or webhooks.
› CPU 95% on web-01
› confirmed from 3 regions
Get alerted in seconds, not minutes
When something breaks, Fivenines confirms it, routes it and gives your team the context to act.
Know what you are installing before you install it.
The Fivenines agent is open source and uses an outbound HTTPS push model. It collects infrastructure telemetry; it does not give Fivenines a shell, an inbound port, or a remote command channel on your servers.
User-level install available · Optional modules are explicit
01
Open source
The agent source is public, so engineers can inspect what runs before rolling it out.
02
Outbound only
The agent pushes metrics to Fivenines over HTTPS. Your host does not need to expose an agent port to the internet.
03
No remote control path
The dashboard cannot SSH into your server or execute arbitrary commands through the agent.
04
Explicit permissions
Base metrics work with normal local reads. Docker, Proxmox, PostgreSQL, SMART, RAID and similar modules are enabled intentionally with scoped access.
Typical data sent
Compare
Fivenines vs Datadog, Better Stack and UptimeRobot
Most teams shopping for infrastructure monitoring already use Prometheus, Datadog or UptimeRobot. Here is the practical difference: breadth, openness, setup time and price.
| Capability | Fivenines | Datadog | Better Stack | UptimeRobot |
|---|---|---|---|---|
| Server metrics | Open-source agent | Agent-based | Limited | No |
| SNMP network monitoring | Included | Paid add-on | No | No |
| Uptime and SSL checks | Included | Add-on | Included | Included |
| Cron job monitoring | Included | Add-on | Included | Limited |
| Open-source agent | Yes | No | No | No |
| Terraform provider | Yes | Yes | No | No |
| Transparent pricing | From €19/mo | Per-host and per-feature | From $24/mo | Free / paid plans |
| Time to first server | About 2 minutes | 30+ minutes | 15+ minutes | Uptime only |
What engineers, MSPs and operators say
Fivenines has been completely reliable...
Fivenines has been completely reliable and the service continues adding features at a fast clip. My subscription just keeps gaining value, which is a great thing!
Mike Horgan
United States · May 1, 2026
Been with the service from ground...
Been with the service from ground floor; the dev is really nice and insanely effective - more than once I've been reporting bugs and assisting with testing while things were being fixed LIVE! It's obvious that he has aspirations and he's been delivering over expectations constantly. The actual product works perfectly along the other monitoring solutions I'm using (currently Hetrixtools and Komari) and for those who are more wary of unknown code running on their prods the code is available via Git. Nothing but recommendations from me!
ZalnT
Sweden · Apr 14, 2026
We have been very happy with Fivenines
The interface is clear and setup was straightforward. Support has been responsive, and alerts arrive promptly when issues arise, enabling quick incident response. Reliability at fair pricing.
Philipp
Germany · Jan 2026
Finally Found a Versatile Server Monitoring at a Sensible Price
After years searching for adequate monitoring tools, Fivenines stands out with its balanced feature set, clean design, reasonable pricing, and genuinely helpful customer support.
T George
Netherlands · Aug 2025
One of the best server monitoring tools I've used
The tool is continuously improving with dedicated developer support. They're responsive to user feedback and I've successfully deployed it as a replacement for our hosting provider's monitoring.
Ahmed
Egypt · Aug 2025
Finally an affordable and pleasant server monitoring tool!
After several competitors closed or declined, Fivenines emerged as the perfect alternative. Easy installation, fast performance with historical charts. Exactly what I was looking for.
Adrien
France · Sep 2025
I have been using Fivenines practically since the beginning
The platform has evolved rapidly with attractive pricing and responsive creator support. It's become a solid alternative to larger competitors for our infrastructure monitoring needs.
Lee
Poland · Jan 2026
Great tool with responsive development
Fivenines has become an essential part of our infrastructure monitoring. The clean interface and reliable alerts make it easy to stay on top of server health.
Dmitriy
Russia · Aug 2025

A note from Sébastien, founder of Fivenines
Built by engineers. Run by a small team.
I started Fivenines because every monitoring tool I tried either took too long to set up or cost more per month than the infrastructure it watched.
The agent is open-source because I do not want anything I would not audit myself running on my servers. The pricing is published because I hate request-a-quote pricing. If you have a question about your setup, email me. I read every one.
sebastien@fivenines.io →Open-source agent
View on GitHub →Terraform provider
Define as code →Public REST API
See docs →Hosted in EU
GDPR-aware
Transparent pricing. No sales calls.
Start with a 14-day Pro trial. Pick a plan when you're ready. Switch or cancel anytime. Prices exclude VAT where applicable.
Starter
For homelabs and solo operators
- ✓15 monitors
- ✓3 team members
- ✓Telegram & Discord alerts
- ✓6 months data retention
Pro
For growing teams and small MSPs
- ✓50 monitors
- ✓10 team members
- ✓Slack & Teams alerts
- ✓12 months data retention
- ✓White-label status pages
- ✓Security vulnerability scanning
Business
For larger teams and MSPs
- ✓100 monitors
- ✓25 team members
- ✓SMS & webhook alerts
- ✓24 months data retention
- ✓White-label status pages
- ✓Security vulnerability scanning
- ✓SAML SSO
Enterprise
For NOC teams, compliance requirements and large fleets
- ✓300+ monitors, 50+ team members
- ✓Everything in Business
- ✓Custom check intervals down to 5 seconds
- ✓Dedicated support contact
- ✓Custom SLA and onboarding
See full feature comparison ↓
| Monitors | 15 | 50 | 100 | 300+ |
| Team members | 3 | 10 | 25 | 50+ |
| White-label status pages | - | Yes | Yes | Yes |
| Security scanning | - | Yes | Yes | Yes |
| SAML SSO | - | - | Yes | Yes |
All paid plans include a 14-day free trial. No credit card required. Prices shown are for 60-second check intervals; custom intervals down to 5 seconds are available.
Frequently asked questions
Setup & onboarding
How long does it take to set up Fivenines? +
What operating systems does Fivenines support? +
Is the Fivenines agent really open-source? +
Compare & alternatives
How is Fivenines different from Prometheus and Grafana? +
How is Fivenines different from Datadog? +
Can I self-host Fivenines? +
Integrations & alerts
What alert channels does Fivenines support? +
What about false alerts at 3 AM? +
Does Fivenines have an API and Terraform provider? +
Pricing & trial
Is there a free trial? +
What happens at the end of the 14-day trial? +
Hosting & data
Where is Fivenines hosted? +
Does Fivenines monitor website uptime? +
Start monitoring in 2 minutes
Free for 14 days. No credit card. Cancel anytime. Or skip signup and explore the live demo with real data.
Made in Montpellier · Open-source agent · Trusted by engineers and MSPs in 30+ countries