GPU Temp Monitor NVIDIA: Setup, Logs and Alerts

Run nvidia-smi -q -d TEMPERATURE to retrieve the current GPU temperature and the card's thermal limits, then read the GPU Current Temp field. For a timed workload trace, use nvidia-smi query logging at a one-second interval and compare temperature with clock behaviour.
A training job has slowed down, fans are loud, and the GPU still reports high utilization. The temperature looks high, but that reading alone doesn't identify the bottleneck. A useful NVIDIA GPU temperature monitor records what happened before the slowdown, which card reported it, and whether the hardware reduced performance.
Table of Contents
- Check GPU Temperature with nvidia-smi in Under a Minute
- Temperature Limits That Decide Whether a Reading Matters
- Choosing a Monitoring Method for Your Setup
- Build a Persistent Collector with NVML
- Container and Remote Host Setups That Still Report
- Alerting on Sustained Heat Instead of Single Spikes
- Choose Your Next Step This Week
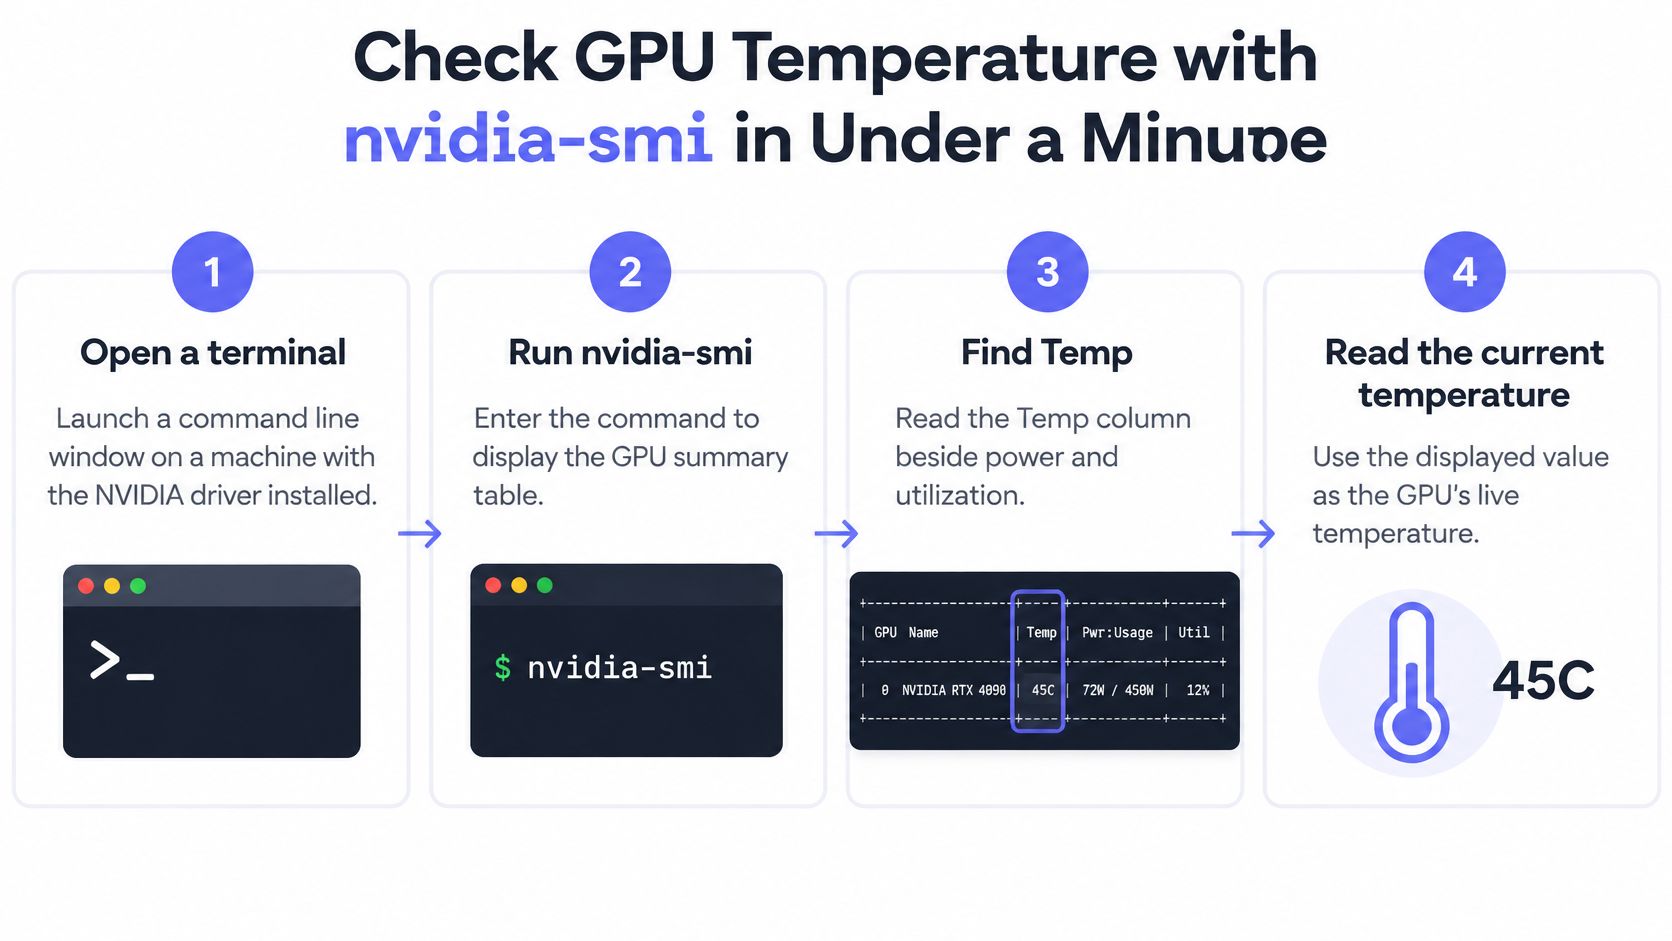
Check GPU Temperature with nvidia-smi in Under a Minute
Run nvidia-smi on the affected host and read the Temp column beside power draw, memory use, and utilization. That's the fastest visibility check, but the detailed temperature query provides the limits needed to interpret it.
NVIDIA's GPU monitoring documentation documents nvidia-smi -q -d TEMPERATURE and includes an example current temperature of 35°C. Its example also distinguishes operating, slowdown, and shutdown limits, rather than treating temperature as a single alarm threshold.
- Confirm device visibility. Run
nvidia-smiand note the GPU index. Check that the expected cards appear before collecting anything. - Run
nvidia-smi -q -d TEMPERATURE. Save the complete output, including unsupported fields, so the device's reported limits remain attached to the investigation. - Record identity with
nvidia-smi --query-gpu=name,uuid,pci.bus_id --format=csv. The index is convenient for a terminal session, not a durable device identifier. - Start a workload trace with
nvidia-smi --query-gpu=timestamp,name,pci.bus_id,temperature.gpu,utilization.gpu,utilization.memory,power.draw,clocks.sm --format=csv -l 1. Append> gpu-thermal.csvto save the output instead of leaving it only in the terminal. - Stop with Ctrl+C after the workload has exercised the card. Check whether temperature rose while
clocks.smfell, and whether utilization remained high.
Check failures before interpreting readings
Command not found means the executable is unavailable in that environment. Check the driver installation and executable path; inside a container, check runtime exposure too.
No GPUs listed requires a different investigation: device visibility, driver health, permissions, or passthrough. Neither error means the GPU is cool.
A snapshot can catch a workload burst, a delayed poll, or a rounded sensor reading. Keep the CSV and the detailed device output together, because neither file is sufficient alone.
Temperature Limits That Decide Whether a Reading Matters
Example GPU temperature fields and what they mean
These are the fields and values from NVIDIA's example output, not default settings to apply across a fleet.
| Field | Example value | What it means for monitoring |
|---|---|---|
| Current temperature | 35°C | Live reading the collector should log every sample |
| Maximum operating temperature | 85°C | Upper bound for normal operation on this example card |
| Slowdown temperature | 93°C | Thermal protection reduces clocks; alert when sustained |
| Shutdown temperature | 96°C | Emergency shutdown point; treat any approach as critical |
Current temperature describes the measured state. It doesn't establish whether the workload is healthy, whether cooling has deteriorated, or whether a different sensor is approaching its own limit.
The maximum operating temperature describes an operating boundary, not an instruction to wait before investigating. A card consistently running hotter under an unchanged workload deserves attention even before protective behaviour starts.
The slowdown temperature matters because performance protection can affect application throughput. The shutdown temperature is an emergency boundary, not an acceptable production target or a stress-test objective.
Cooling and workload change the comparison
A 2025 arXiv study of GPU operation measured mean temperatures of 40°C for A100 GPUs and 37°C for H100 GPUs, with maxima of 49°C and 48°C, respectively, under average utilization. Those measurements describe the studied systems, not expected temperatures for every installation.
A separate 2025 arXiv study of H100 cooling reported 41–50°C for liquid-cooled systems and 54–72°C for air-cooled systems under load. Comparing those systems without retaining cooling and workload context would produce misleading conclusions.
Build a performance baseline around a representative job, its throughput, and its cooling conditions. Include fan behaviour and inlet conditions where available, especially when comparing machines in different racks.
Practical rule: Judge a reading against the same card's reported slowdown limit and expected clock behaviour, not another model's temperature.
Store the applicable limit alongside the measurement and display remaining thermal headroom. If the limit is unavailable, mark it unavailable rather than substituting a fleet-wide guess.
Choosing a Monitoring Method for Your Setup
GPU temperature monitoring methods compared
| Method | Best for | Typical cadence | Main limit |
|---|---|---|---|
Manual nvidia-smi check |
Single incident on one machine | On demand | No retained history or alerts by itself |
nvidia-smi loop logging |
Capturing a workload or throttling event | Per second during diagnosis | CSV handling and separate alert logic |
| NVML-based exporter or agent | Ongoing monitoring across hosts | Operational polling interval | Code or agent maintenance and driver compatibility |
| DCGM stack | Datacenter fleets with health checks | Configurable per field group | More components to install and operate |
For incident logging, NVIDIA's monitoring documentation supports a query collecting temperature, utilization, power, and clocks together at a one-second interval. That combination is more useful than an aggressively sampled temperature-only chart.
Choose based on host count, retention, deployment boundaries, and ownership. A collector that nobody upgrades or checks after driver maintenance is a liability, even when its dashboard looks polished.
Match the method to the workload
For a workstation with occasional slowdowns, loop logging is usually sufficient. Start before the affected task, preserve the output, and compare the slow run with a healthy run of the same job.
For a homelab spread across several servers, an NVML-based exporter feeding Prometheus or another metrics backend provides searchable history without opening terminal sessions on every machine. Assign responsibility for service restarts, package upgrades, retention, and missing-data detection.
For a production fleet, DCGM is appropriate when operators also need GPU health diagnostics and device-specific fields. A simpler agent remains reasonable when the requirement is temperature and resource visibility rather than the broader diagnostic stack.
Faster sampling is useful only when the team retains and examines the extra detail.
Short intervals reveal transitions but increase sample volume and collection work. Normal operation can use a less aggressive interval, with higher-resolution capture reserved for diagnosis.
Keep the UUID and PCI bus ID as separate attributes. Use UUID for device identity and the bus ID for placement; a replacement card can occupy the same slot, so the bus ID alone cannot distinguish hardware replacements.
Build a Persistent Collector with NVML
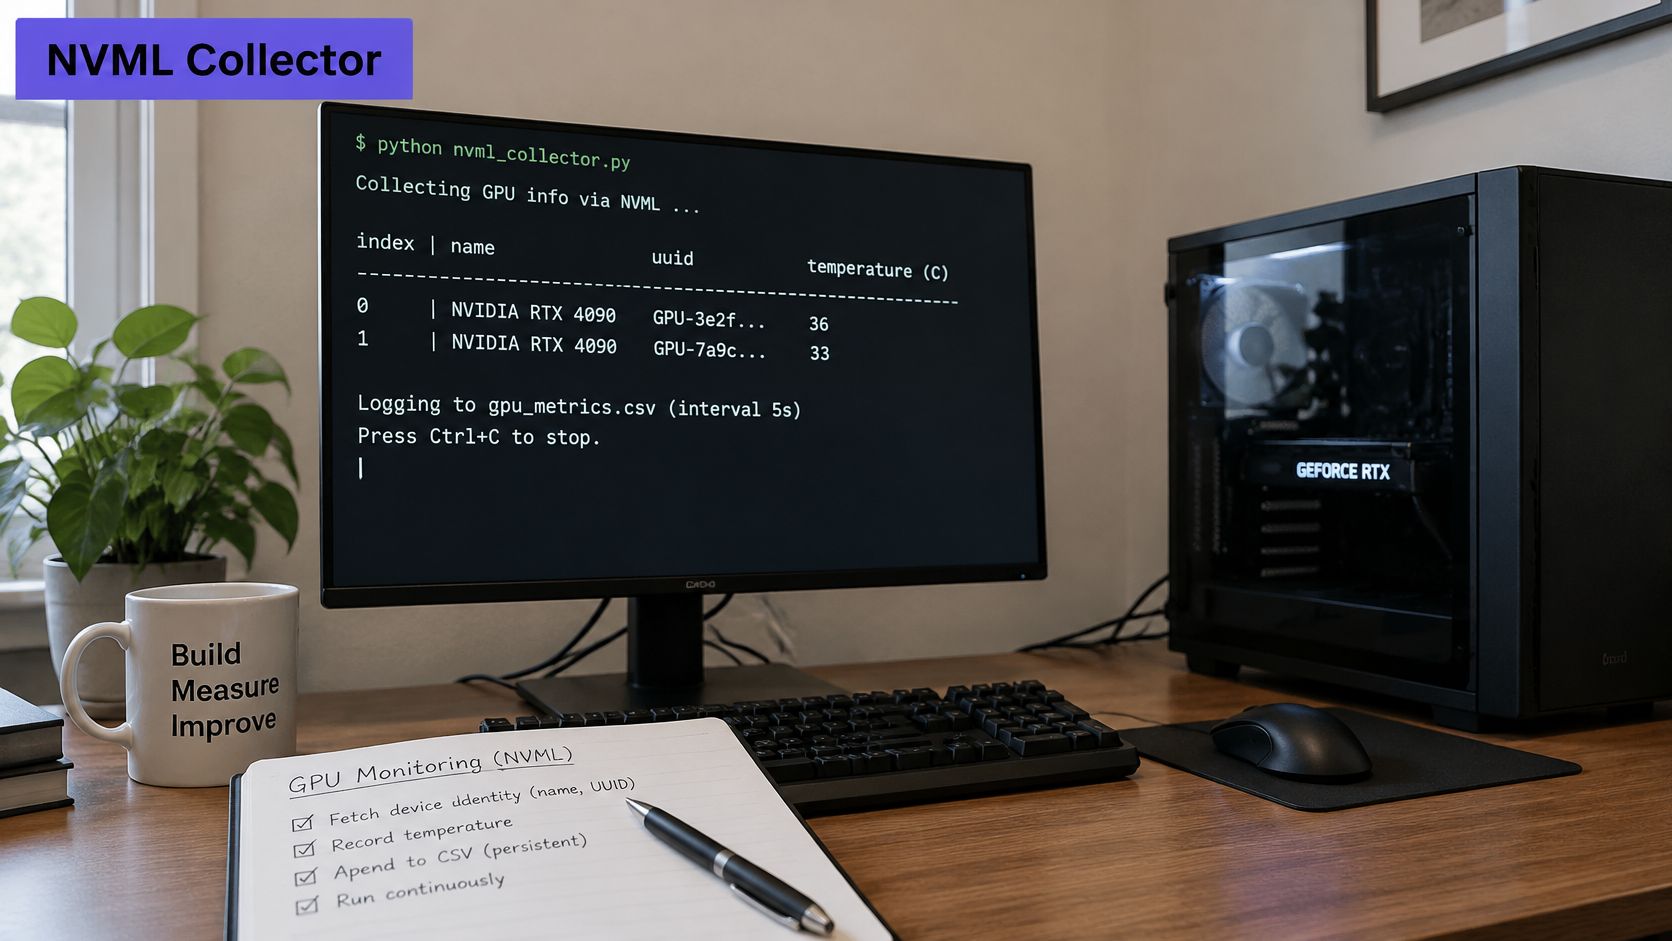
NVML is NVIDIA's management library and the library behind nvidia-smi, according to the NVML API reference. Structured API calls avoid fragile parsing of a terminal summary and provide explicit return codes for unsupported fields and failures.
A persistent collector needs a clear collection lifecycle, not just a temperature call inside an endless loop.
- Initialize NVML. If initialization fails, report collector failure rather than publishing an empty healthy result.
- Enumerate devices and obtain their handles. Re-enumerate after device-related errors instead of assuming the startup inventory remains valid forever.
- Record UUID, PCI bus ID, and model. Attach host identity separately so moving a card doesn't erase its hardware identity.
- Query supported temperature, utilization, power, clock, and memory fields. Preserve units in the schema and check each call's result independently.
- Handle unsupported and transient errors separately. An unavailable hottest-location sensor shouldn't suppress a valid current-temperature reading.
- Export timestamps, device identity, field validity, and collector health. Shut down the library cleanly when the process exits.
Make missing telemetry visible
An error must never become a zero-temperature sample. Publish an explicit gap or invalid state when collection fails, and retain the last successful timestamp without presenting that value as current.
Driver and library compatibility is an early setup check when NVML initialization fails. Permissions and container device exposure require separate checks when initialization succeeds but expected devices or fields remain unavailable.
Use a steady operational cadence and temporarily increase resolution during incidents. Keep diagnostic logs separate from metric samples; a Python logging-to-file setup can preserve return codes, retries, and initialization failures without contaminating metric values.
For engineering leaders connecting telemetry ownership to training and deployment processes, TekRecruiter's guidance to improve machine learning operations in 2025 offers broader operational context. The collector still needs a named maintainer and a documented upgrade procedure.
A working deployment produces a distinct series per UUID, visible gaps during failures, and retained high-resolution records around incidents.
Container and Remote Host Setups That Still Report
For Docker, verify prerequisites in order: a functioning NVIDIA driver on the host, the NVIDIA Container Toolkit, then GPU access through --gpus all or an equivalent device request. A CUDA-capable application image alone doesn't expose the host's GPU management interface.
Start a container from an official CUDA image compatible with the environment and run nvidia-smi inside it. Successful verification shows the expected devices and identities, not merely a command that exits without an obvious error.
For Kubernetes, the NVIDIA device plugin must advertise GPU resources to the scheduler. The collector also needs an appropriate deployment and access to the relevant devices; scheduling an ordinary pod onto a GPU node doesn't automatically provide that access.
Separate transport failures from sensor failures
Run the collector locally on each remote server and forward its telemetry to the monitoring backend. Repeated SSH polling introduces connection setup, latency, credential expiry, and remote-command failures into the measurement path.
If SSH polling is unavoidable, use a fixed schedule, controlled access through the jump host, and logged failures. A remote infrastructure monitoring design should make transport health visible independently of GPU health.
Container and remote host symptoms, causes and fixes
| Symptom | Likely cause | Fix |
|---|---|---|
nvidia-smi not found inside the container |
Toolkit absent or binaries not mounted | Install or configure the NVIDIA Container Toolkit and restart Docker when required |
| No GPUs listed inside the container | GPUs not passed through | Start with --gpus all or the correct device request |
| Temperature shows N/A or not supported | Card or driver doesn't expose that sensor | Log N/A explicitly and collect supported sensors |
| Remote host shows no GPU data | Agent stopped, outbound HTTPS blocked, or SSH key expired | Check the service and the transport actually used |
| Temperature series jumps to another GPU after reboot | GPU indexes renumbered | Key series by UUID and retain PCI bus ID as placement metadata |
After every change, run nvidia-smi --query-gpu=uuid,pci.bus_id,temperature.gpu --format=csv in the collection environment. Compare its identity fields with the host's inventory before trusting the restored graph.
Alerting on Sustained Heat Instead of Single Spikes
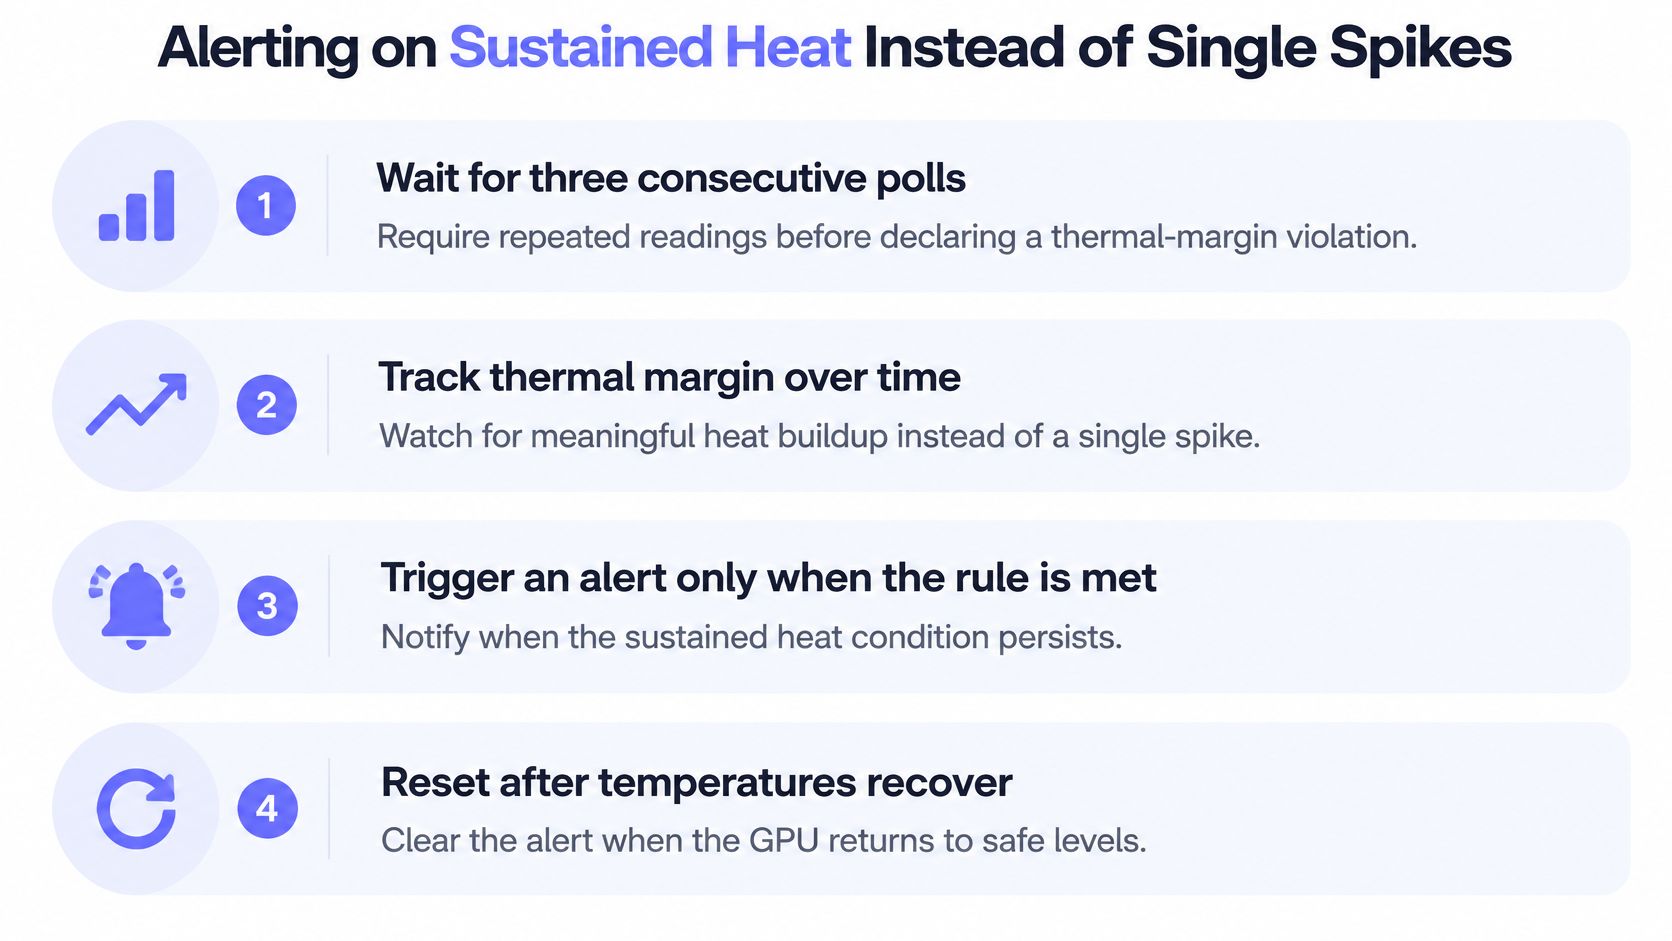
NVIDIA's NVSentinel documentation identifies DCGM field 153 as thermal margin and uses three consecutive polls by default before declaring a thermal-margin violation. It explains that margin can move by tens of degrees within seconds under load, which makes an isolated breach weak evidence of a persistent problem.
Use persistence to filter transients, then assess thermal impact. The hardware slowdown state is stronger evidence than a hot-looking temperature, while falling clocks require workload context before being attributed to heat.
- Margin condition: Require sustained proximity to the device's applicable slowdown boundary.
- Performance condition: Check for thermal slowdown and reduced clocks while demand remains present.
- Alternative explanation: Inspect power-limit events separately, because power limiting can reduce clocks without proving a cooling fault.
- Recovery condition: Clear the incident only after the relevant state and margin recover.
Separate warnings from pages
Send warnings to a team channel when margin keeps shrinking across a configured observation window. Reserve a page for sustained thermal slowdown, especially when it coincides with degraded job throughput.
For a hypothetical card, calculate headroom by subtracting current temperature from its reported slowdown limit. The rule should react to that headroom staying small or shrinking under comparable demand, rather than matching a global Celsius threshold.
Verify an active condition with dcgmi dmon or nvidia-smi -q -d TEMPERATURE. A transient that clears with clock recovery needs different handling from a condition that remains active under sustained demand.
Use an explicit alert setup and routing workflow so warnings and pages reach different destinations. If the organisation also needs a service-management system for incident ownership, DataLunix's overview of SysAid pricing for enterprise teams can inform that separate procurement decision.
Test with a bounded, approved workload and safe stop conditions. Confirm that notifications deduplicate, recovery clears the incident, and missing telemetry produces a collection fault rather than a thermal recovery.
Choose Your Next Step This Week
Choose the smallest collection method that supports the operational requirement. A workstation investigation needs a saved workload trace; several servers benefit from an exporter and retained history; a fleet with health-diagnostic requirements may justify DCGM.
Schedule a controlled test with a named operator and a rollback or stop procedure. Record the job, cooling conditions, device identities, and expected behaviour before starting, so the result is reproducible rather than another unexplained graph.
Decide who maintains the monitoring
A self-built exporter provides control over fields, sampling, and thermal-margin calculations. The team must also own compatibility testing, storage, collector health, and notification delivery.
A hosted alternative is Fivenines: its GPU Monitoring covers NVIDIA utilization, temperature, VRAM, and power draw, while Linux Server Monitoring provides host metrics, hosted history, and alert workflows through an open-source agent. Evaluate the required thermal-limit and slowdown-state collection separately rather than assuming every hosted dashboard exposes every diagnostic field.
The choice depends on whether maintaining the telemetry pipeline is useful engineering work for that team. Either way, the acceptance test should include valid readings, deliberate collection failure, notification behaviour, and recovery.
Before the end of the week, record every GPU's UUID, configure a model-aware thermal-margin warning in the chosen monitoring stack, and run the controlled workload test. Keep the resulting trace as the first operational baseline.
Fivenines offers NVIDIA temperature, utilization, VRAM, and power monitoring alongside Linux host history and alert workflows. Visit Fivenines to assess a hosted view of GPU and server health, while retaining device-specific thermal diagnostics for throttling investigations.