What Is Network Health: Metrics and Fixes

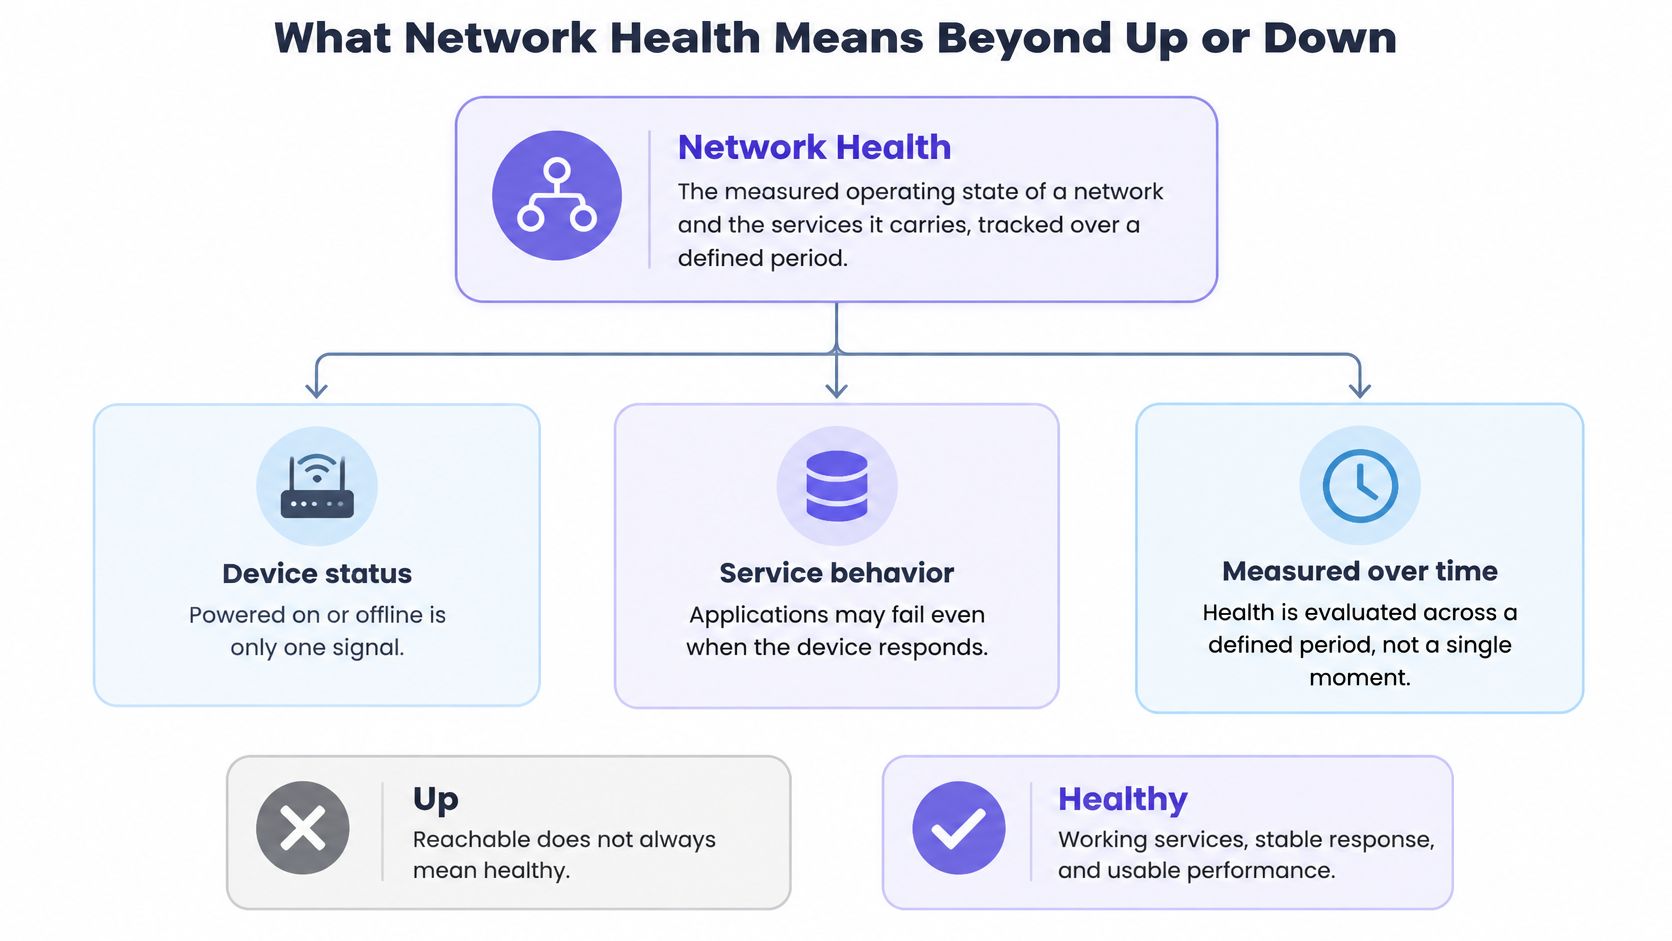
Network health is the measured operating state of a network and the services it carries, judged over time rather than by a single up-or-down check. That's the direct answer to what is network health, and it challenges the most popular advice in operations. A ping that replies doesn't prove users can work. A green icon doesn't prove packets arrive on time, DNS resolves, or failover will hold. Teams that trust one probe miss slow failures. Healthy means reachable, consistent, and usable across the full service path, for the period that matters.
Table of Contents
- What Network Health Means Beyond Up or Down
- Key Network Health Metrics and Healthy Ranges
- Why a Reachable Network Can Still Be Unhealthy
- How to Collect and Read Metrics Over Time
- Common Failure Modes and Their Warning Signs
- Alert Thresholds That Avoid Alert Fatigue
- How to Respond to a Network Health Alert
- Set Up Your First Network Health Baseline
What Network Health Means Beyond Up or Down
A green checkmark is not a health report. It answers one narrow question: did something reply? It says nothing about dropped packets, full queues, failed redundancy, or a service returning errors. A car can start with low oil pressure. Its dashboard shows temperature, pressure, and fuel use for that reason. A network needs the same wider view.
The International Telecommunication Union's 2025 framework defines communication-network health through four top-level dimensions: availability, reliability, security, and maintainability. Availability asks whether resources and services can be reached and used. Reliability covers how often failures occur and how much they hurt, including redundancy and disaster recovery. Security covers protection against threats. Maintainability covers how easily operators can run, repair, and sustain the network. Availability is the gate. The other three dimensions decide how well the network holds up once that gate is open.
The Full Service Path
Health runs from links and devices through DNS and applications to the end user. A router can answer ping while delivering 8% packet loss on a customer path. Users feel stalls and retries. The device looks fine.
The opposite case matters too. A brief interface fault does not make a network unhealthy if failover works and service stays available. Quiet, persistent degradation is the larger risk. For teams focused on protecting your firm's network reliability, the practical test is the same: watch trends, not single checks.
Can users reach the service, and does it perform consistently over the period that matters?
Those two questions test any dashboard. If either answer is no, a green status does not settle the question.
Key Network Health Metrics and Healthy Ranges
The table provides starting ranges for typical enterprise LAN and WAN links. Operators shouldn't treat them as universal limits. The actual target comes from 30 days of local data. A baseline shows what normal looks like at each hour, on each path.
Core network health metrics and healthy ranges
| Metric | What It Reveals | Healthy Range | Warning Sign |
|---|---|---|---|
| Latency (round-trip time) | Responsiveness of the path | Under 20 ms on LAN, under 80 ms on most WAN paths | Sustained rise above your own baseline |
| Packet loss | Delivery reliability | Under 0.1% in normal operation | Above 1% sustained for several minutes |
| Jitter (packet delay variation) | Consistency of delay | Under 30 ms for voice and video paths | Swings above 50 ms that repeat |
| Bandwidth utilization | Share of link capacity in use | Under 70% at peak | Above 85% for several minutes |
| Interface errors and discards | Physical, cabling or duplex faults | Near zero and flat | Rising CRC errors or discards |
| Device CPU | Control-plane and processing load | Under 70% sustained | Above 85% across repeated polls |
| Device memory | Headroom for routing tables and buffers | Under 80% with stable trend | Steady climb without release |
The Metrics Most Often Misread
Latency averages hide pain. A 5 ms average can conceal a 400 ms p99 spike. Users feel the spike, not the average. Operators should read percentiles, especially p95 and p99, and a guide to checking network latency helps separate path delay from endpoint delay.
Packet loss looks small and hurts fast. Even low loss forces retransmissions and slows TCP. Interactive apps stutter. Voice breaks up. It's the clearest signal that delivery itself is failing.
Interface errors need rates, not totals. Counters only grow, so a large lifetime total may be old history. A rising rate in the last hour points to a cable, optic, or duplex fault now.
- Start with loss: Add packet loss on customer-carrying paths first.
- Add latency next: Track percentiles on those same paths.
- Then add device headroom: Watch CPU, memory, and utilization for saturation.
Why a Reachable Network Can Still Be Unhealthy
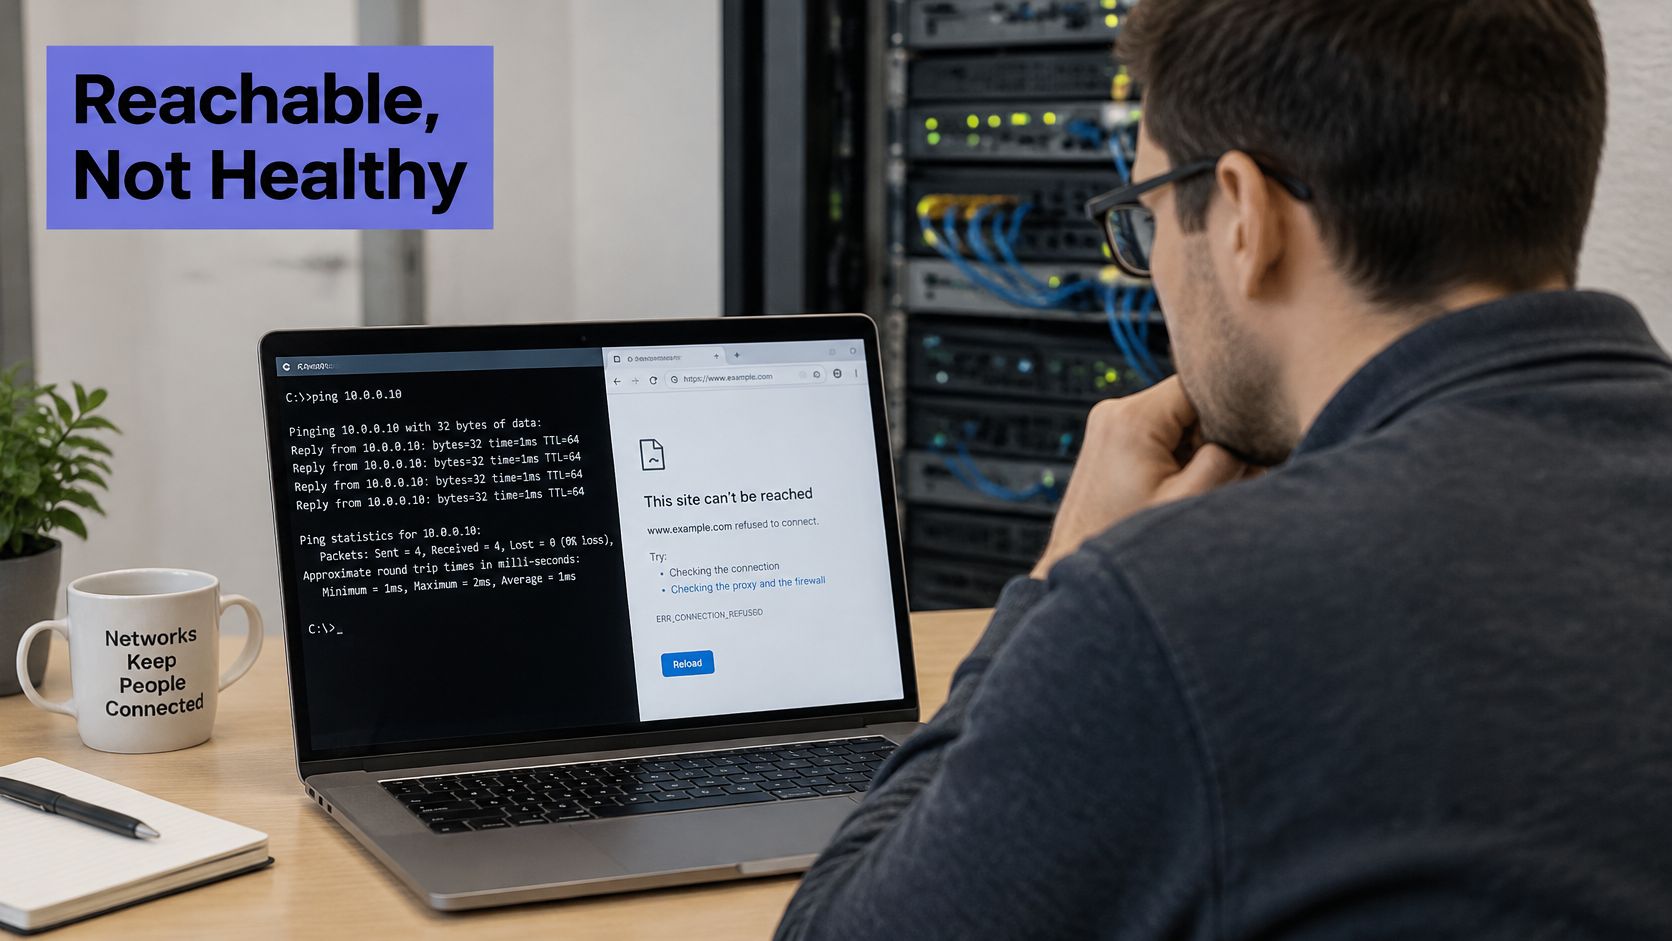
A server answers ICMP ping perfectly. HTTPS requests fail. That pattern doesn't point to a dead network. It points to DNS, TLS, a proxy, or a firewall rule.
Two Layers Answer Different Questions
The Google SRE guidance on monitoring distributed systems treats monitoring as a way to measure user-relevant behavior, and its SLO guidance identifies periodic remote checks such as a ping or HTTP GET as a low-fidelity option when historical logs or metrics are unavailable. Health therefore needs at least two layers. The network-path layer covers reachability, latency, loss, and packet-delay variation. The application-facing layer covers successful HTTP transactions, response-time distributions, and error rate.
The diagnostic logic is simple:
- Ping succeeds and HTTPS fails: Check the application layer, DNS, TLS, proxy, or firewall.
- Several protocols degrade together: Suspect the path or provider.
- One region fails and others pass: Suspect routing, a resolver, or a regional dependency.
Multi-location probes reduce false positives. One vantage point can hit a transient route anomaly and cry wolf. Confirmation from a second location adds confidence before anyone gets paged.
Service-level objectives should center on successful user transactions. Raw probe results should stay available for incident analysis. Each network metric works as a diagnostic signal, not as a complete health score.
Practical rule: Green infrastructure metrics don't prove healthy service delivery.
How to Collect and Read Metrics Over Time
The collection model behind most network monitoring predates the web browser. In April 1988, IAB RFC 1052 recommended the Simple Network Management Protocol as the short-term basis for common management across the Internet and the TCP/IP protocol suite. The pattern it set still holds: pull structured data from distributed devices, evaluate it in one place, and use it to find faults.
Polling works like a clipboard checklist that runs on a timer. A monitoring host queries each switch, router, and firewall at a fixed interval, commonly every 60 seconds. Cumulative counters become rates when you subtract one reading from the next. Those rates get stored as history, and history is what lets you compare 3 a.m. today against 3 a.m. last Tuesday. Teams comparing collection options can weigh F1Group's network monitoring tool comparison against practical guidance on monitoring routers effectively to match polling depth to device role.
Rules for Reading the Numbers
Use percentiles for latency. Averages hide the moments users complain about. A 5 ms average can sit on top of a 400 ms spike that everyone felt during a call.
Use rolling windows. A 5 to 10 minute window stops one bad probe from paging anyone. Short blips are normal. Variation that fills the whole window points to congestion or an unstable path.
Build baselines by hour and weekday. A 2 p.m. peak on a business network is ordinary load. The same peak at 3 a.m. deserves a look. Baselines turn raw counters into context.
Overlay the change log. Route changes and firmware upgrades belong on the same graph as the metrics. Correlation becomes obvious, and so does innocence.
Correlate related signals. Utilization climbing alongside queue drops and retransmissions points to congestion. Errors climbing without extra load points to a physical fault. One metric rarely tells the whole story.
A single spike needs no action. A rising line across three consecutive intervals does.
Aggregate availability hides local damage, because a healthy internet still leaves some networks persistently unreachable from certain paths. Regional and per-device views matter as much as any global percentage. Poll the device, store the reading, read the trend. The single number matters far less than the shape it makes across a week.
Common Failure Modes and Their Warning Signs
The most common pattern isn't a total outage. It's partial failure. One region, one ISP, or one dependency degrades while the rest looks normal.
Scale makes that pattern hard to ignore. A 2025 Opengear survey of more than 1,000 CIOs, CSOs, and network engineers across the United States, United Kingdom, France, Germany, and Australia found that 84% of organizations experienced increasing network outages over the previous two years. Separately, Cloudflare's Q4 2025 Internet disruption summary reported more than 180 Internet disruptions during 2025, ranging from brief localized incidents to outages lasting multiple days, with causes including cable cuts, power failures, earthquakes, fires, cyberattacks, and technical problems.
Failure signatures, likely causes and first checks
| Symptom Pattern | Likely Cause | First Check |
|---|---|---|
| Ping succeeds, HTTPS fails | DNS, TLS, proxy or firewall fault | Resolver response time and certificate expiry |
| Latency and jitter rise together on one link | Congestion or queue saturation | Link utilization and queue drops |
| Packet loss only from one region | Regional ISP, cable or routing problem | Probe results from other regions |
| Errors climb on one interface | Bad cable, optic or duplex mismatch | CRC counters on both ends of the link |
| CPU pinned while traffic is normal | Control-plane overload or routing churn | Route flap count and process list |
| Memory climbs steadily for days | Table growth or memory leak | Multi-day memory trend against change log |
| Primary fails but service stays down | Redundancy misconfigured | Standby link and failover state |
Degraded but Not Down
A site can load from headquarters and fail for users behind a damaged cable or impaired resolver. Single-location monitoring calls that healthy. Users call it down. A practical approach to packet loss detection helps confirm whether loss is local, regional, or provider-wide.
Four indicators matter here. Regional availability shows who can reach the service. Path diversity shows whether alternate routes exist. Time to detect shows how long damage runs unseen. Dependency mapping shows which resolver, provider, or cloud region can take service down with it.
When should a partial failure page someone? Combine user impact, geographic scope, duration, and confidence. One failed probe isn't enough.
Alert Thresholds That Avoid Alert Fatigue
Noisy paging trains people to ignore alerts. That's the true cost of bad thresholds. Thresholds set too high cause the opposite failure. Slow degradation runs for hours and nobody hears about it.
Use two tiers. A warning goes to a channel for review during working hours. A page wakes someone only for user-impacting conditions. The numbers below are starting points, not universal limits.
Starter alert thresholds with sustain windows
| Alert | Page At | Confirm Before Paging |
|---|---|---|
| Packet loss | 2% for 5 minutes | Two probe regions |
| Latency | p95 double the baseline for 10 minutes | Two vantage points |
| Jitter | Above 50 ms for 10 minutes | Voice or video path test |
| Interface errors | Sustained growth over 1 hour | Errors on both link ends |
| Link utilization | Above 90% for 15 minutes | Compare with same hour last week |
| Device CPU | Above 90% across three polls | Second poll on the same device |
Rules That Make Paging Trustworthy
- Require a sustain window: Hold loss and latency alerts for 5 to 10 minutes before paging.
- Confirm from two places: Require two probe regions or two vantage points for path alerts.
- Alert on percentiles: Use rolling p95 values rather than single samples.
- Open one incident per problem: Don't open one per device that noticed it.
- Suppress maintenance noise: Silence alerts during scheduled windows, then verify recovery afterward.
Tune each threshold after 30 days of data. Review every page afterward. Ask whether it was actionable, and adjust the ones that weren't.
How to Respond to a Network Health Alert
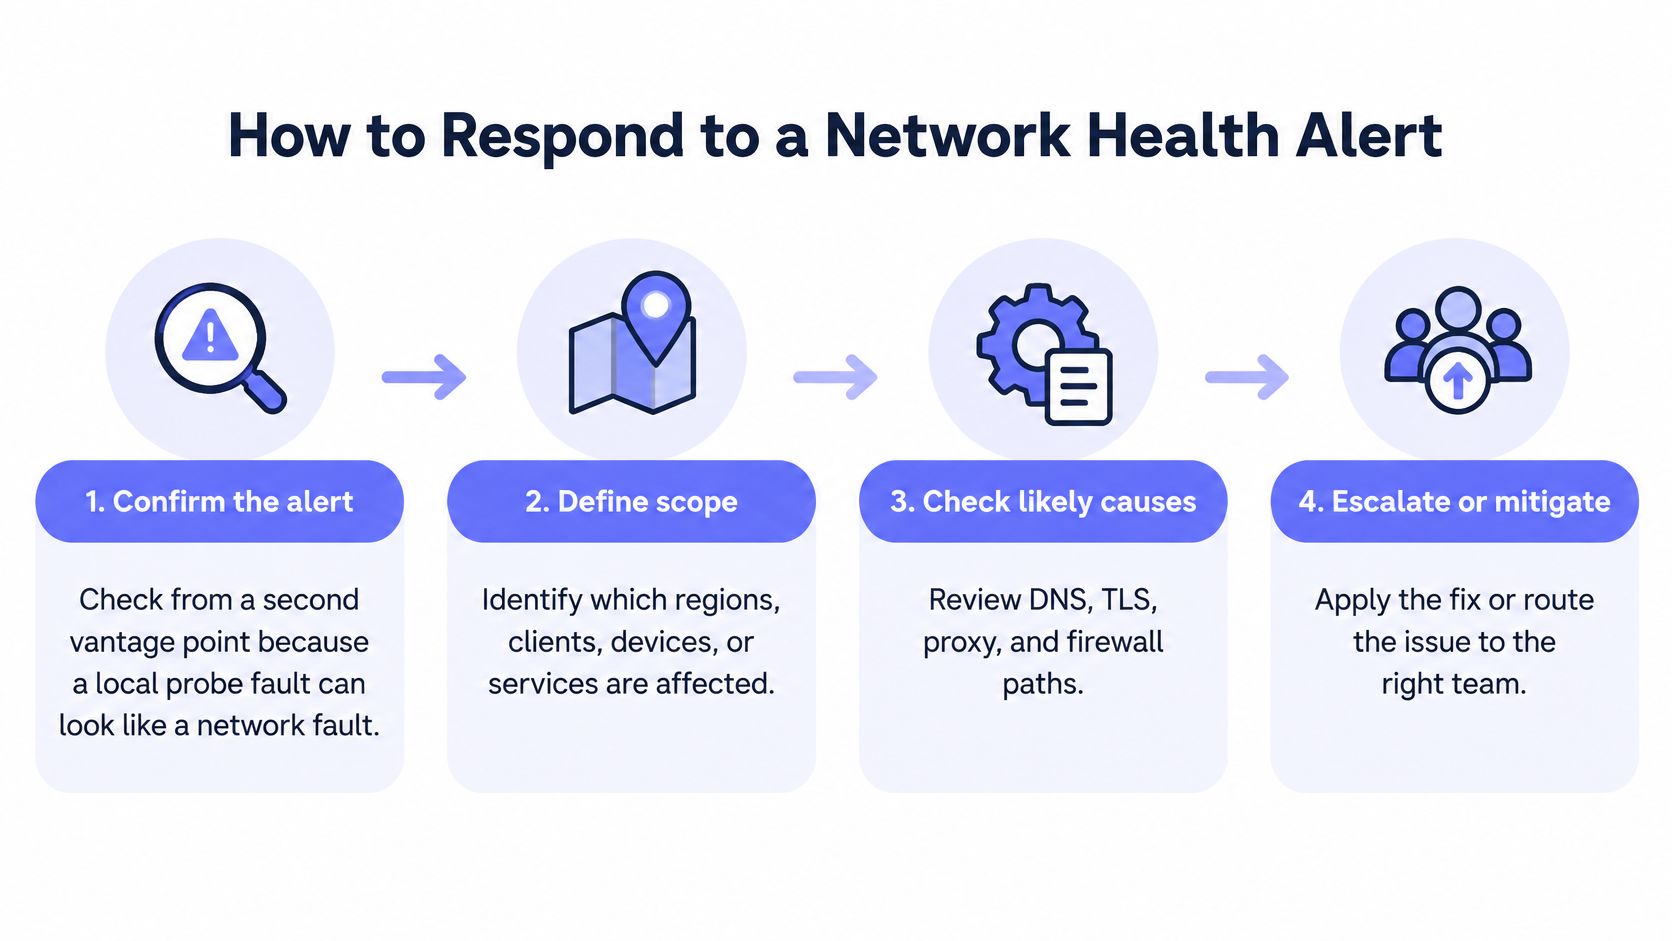
Speed matters, but order matters more. A fixed sequence stops responders from chasing the loudest graph. Each step either narrows scope or raises confidence.
The Response Sequence
- Confirm from a second vantage point. A local probe fault can look exactly like a network fault. Confirmation takes a minute and prevents false incidents.
- Define scope. Identify affected regions, clients, devices, and services. Establish whether users are impacted or only internal telemetry looks odd.
- Compare with baseline and change log. Most sudden shifts follow a deployment, route change, or firmware upgrade. Check what changed in the last few hours first.
- Classify severity. Apply the paging rules. One failed probe never opens an incident on its own.
- Isolate the layer. Use the failure signatures. Start with DNS or application checks when the network path looks clean, and with link checks when errors climb on one interface.
- Apply the fix. Reroute traffic, fail over to the standby link, replace a bad cable or optic, reduce load, or roll back the change. Pick the smallest action that restores service.
- Verify recovery. Watch the same probes for at least 15 minutes before closing. A brief improvement can hide a flapping fault.
- Review and tune. Write a short review. Adjust the threshold that fired if it paged too early, too late, or for the wrong reason.
Handoff to Incident Response
Monitoring should route each alert to on-call chat, paging, ticketing, or a webhook automatically. Every incident should carry the affected scope, the first metric pattern, and the probe evidence. Responders shouldn't start from zero. Good handoff data cuts the first confused minutes, which are usually the most expensive ones.
Set Up Your First Network Health Baseline
Start small and specific. Pick five critical paths first. Include the public entry point, the database path, DNS resolution, the link to a key provider, and the path to the largest client. A clear performance baseline approach turns those paths into reference points for every later alert.
Add uptime checks next. Fivenines runs HTTPS, TCP, ICMP and DNS uptime checks from multiple regions, tracks response time, availability and SSL certificate expiry, and can publish public status pages. Multiple regions stop one vantage point from deciding the outcome.
Then add network devices. Network devices are added by choosing an agent host that can reach the client's network devices, enabling SNMP polling, and adding each device with its SNMP settings and credentials. Network Device Monitoring polls configured devices via SNMP v2c/v3 for interface traffic, errors, reachability and alerts, alongside server metrics.
Set warning and paging thresholds from the starter table. Let data collect for 30 days before tuning. Group servers, monitors, and devices by client so each fleet has its own alert stream. Review the first real incident against the response workflow and adjust one thing at a time.
The decision that matters most this week is simple. Identify which paths carry customer traffic. Every check and threshold should trace back to them.
Fivenines brings SNMP network device polling, multi-region uptime checks, and server metrics into one dashboard, so teams can build the baseline described here without assembling five tools. Operators ready to replace single ping checks with sustained, user-relevant health monitoring can start at Fivenines.