Router Monitoring Guide: Metrics, Protocols and Setup

The router dashboard is green, but customers in another region can't reach the application. The uplink is passing traffic, CPU looks normal, and nobody received an alert. The on-call engineer now has to determine whether the router failed, an upstream route disappeared, or the monitoring system stopped collecting evidence.
Router monitoring needs to answer more than whether a device responds. Operators need to know whether it forwards traffic correctly, whether its routes remain usable outside the local network, and whether its telemetry can still be trusted. A useful setup connects those views without turning every counter change into a page.
Table of Contents
- Router Metrics to Track and the Thresholds to Set
- Choosing SNMP, Flow Data, Streaming Telemetry or Syslog
- Agent or Agentless, and Polling or Streaming
- Set Up Router Monitoring and Verify It Works
- Alert Rules and Runbooks That Avoid Alert Fatigue
- Catching Silent Telemetry and Routing Problems
- Scaling Router Monitoring Across Sites and Clients
Router Metrics to Track and the Thresholds to Set
Most router incidents become visible in a handful of signals. Start with actionable measurements rather than collecting every available object identifier.
Core router metrics, starting thresholds and data source
| Metric | What it reveals | Starting threshold | Collection method |
|---|---|---|---|
| CPU utilization | Control-plane overload | Sustained departure from the normal operating range, confirmed with routing or management symptoms | SNMP or vendor API |
| Memory utilization | Route-table or buffer pressure | Persistent growth toward the platform's safe operating limit | SNMP or vendor API |
| Interface utilization | Link saturation | Sustained use approaching usable capacity, especially with queue drops | SNMP high-capacity octet counters |
| Interface errors and discards | Cabling faults, duplex mismatch, buffer drops | Any sustained increase in new errors or unexplained discards | SNMP error and discard counters |
| Interface operational status | Link up or down | Unexpected change to down on an enabled production interface | SNMP ifOperStatus |
| BGP session state | Peering health | Expected production peer not Established | SNMP BGP MIB or BGP streaming |
| Temperature and fan status | Hardware health | Vendor-defined limit or fan failure | SNMP or vendor telemetry |
| External reachability, latency and loss | Whether the service is reachable from outside | Confirmed loss or persistent latency increase against a regional baseline | ICMP or synthetic probes from several regions |
Set thresholds around operating conditions
CPU alone isn't a forwarding-health measurement. A router can show control-plane pressure while hardware forwarding continues normally. Conversely, an overloaded egress queue can drop customer traffic while overall CPU remains unremarkable.
Memory needs platform context too. Separate allocated memory, available memory and an upward trend that doesn't recover. A stable route-table footprint shouldn't trigger the same response as steadily shrinking free memory following a policy change.
Interface counters need interpretation, not just thresholds:
- Errors: Check physical-layer counters, optics, cabling and negotiated settings.
- Discards: Inspect queue occupancy, congestion, policing and quality-of-service policy before replacing hardware.
- Utilization: Measure each direction separately and use the actual service capacity, not merely the interface's advertised speed.
The same counter discipline applies to switch monitoring, particularly when the fault sits on the neighboring port rather than the router.
Practical rule: A sustained condition with customer impact deserves more attention than an isolated peak.
Baseline a complete operating cycle, including backups, deployments and peak business traffic. Then replace generic thresholds with device-specific warning and critical boundaries, using separate recovery thresholds to prevent repeated alerting around the boundary.
For the initial rollout, the team should identify the measurements that would've exposed its last router incident and enable those alerts first.
Choosing SNMP, Flow Data, Streaming Telemetry or Syslog
Use SNMP for health, flows for traffic composition, streaming for fast-changing state, and syslog for events. None replaces the others, and collecting everything without a diagnostic purpose only increases storage and maintenance work.
SNMP's standardized management model was formalized in 1990 through IETF RFC 1157, which describes remote access to management information organized in a Management Information Base. That manager-and-agent arrangement remains the foundation for collecting interface counters, status and historical device-health measurements.
Router data sources compared
| Source | Data it carries | Typical latency | Best for | Main limitation |
|---|---|---|---|---|
| SNMP polling | Counters, status, CPU, memory | Poll interval plus collection time | Interface health and inventory | Manager must poll; narrow counters wrap on fast links |
| NetFlow, IPFIX or sFlow | Traffic source, destination and volume | Export timer and collector processing delay | Traffic analysis and unusual volume | Not a device-health source; sFlow uses sampling |
| Streaming telemetry | Pushed operational state | Subscription cadence plus transport delay | Fast, high-cardinality state | Requires supported device models and collector capacity |
| Syslog | Logins, link flaps and configuration events | As events are delivered | Incident timelines and audit evidence | Message parsing and delivery reliability require attention |
Choose coverage before collection volume
SNMP works well for regular measurements with established meanings. Use high-capacity ifHC counters for interface traffic, and calculate rates from counter differences over elapsed time. Detect device restarts and counter discontinuities so resets don't become impossible traffic spikes.
A practical SNMP and MIB guide helps distinguish standard interface objects from vendor-specific hardware and routing objects. Support for SNMP doesn't guarantee that every useful platform metric appears in a standard MIB.
Flow telemetry answers a different question: which traffic accounts for the load? It can distinguish a backup transfer from an unexpected destination pattern, but it won't explain a failed fan. Sampling also makes flow records unsuitable as an exact accounting substitute without understanding the export configuration.
Streaming can expose changes between polling samples, but subscriptions need limits. Requesting every path at an aggressive cadence can overload collectors and complicate schema handling across vendors.
Syslog provides the event sequence that periodic counters lack. Preserve the original message alongside parsed fields, and verify transport behavior during congestion or collector outages.
- Minimum practical coverage: Pair SNMP measurements with syslog events.
- Add traffic context: Enable flow export where congestion or traffic attribution warrants it.
- Add faster state selectively: Stream operational paths tied to a specific response requirement.
Agent or Agentless, and Polling or Streaming
Network gear is usually monitored agentlessly because operators generally can't install arbitrary software on a router's operating system. Servers are different: an agent can collect host-local information and send it outward without exposing a remote polling service.
Collection placement should reflect where software can safely run.
Agent versus agentless and polling versus streaming
| Option | How data arrives | Detection speed | Choose when |
|---|---|---|---|
| Agent-based | Software on the host pushes metrics | Reporting-cadence dependent, potentially near real time | Linux servers, containers and hypervisors under operator control |
| Agentless polling | Manager queries SNMP or an API | Limited by polling and timeout settings | Routers, switches and firewalls that can't run custom agents |
| Polling | Scheduled requests | Interval-dependent | Broad coverage with straightforward collection |
| Streaming | Device pushes subscribed state | Subscription-dependent, suitable for rapid updates | Fast-changing state where detection delay has operational cost |
Separate installation from delivery
Agentless doesn't mean polling only. A router can stream telemetry without a custom agent, while a host agent can report on a schedule. These are separate architectural choices.
Open-source host agents make collection code auditable, but somebody still owns updates, compatibility testing and rollout control. Installing an agent on a nearby server doesn't turn it into an on-device observer either. That server still depends on the router's management interface for router-specific state.
Polling has a visibility gap: a link can fail and recover entirely between scheduled requests. Event delivery or streaming can preserve that transition, while polling confirms the resulting state. Shorter intervals reduce the gap but increase requests, timeout handling and collector work.
The operational comparison is also illustrated in the following video.
Start with polling coverage, then stream only state whose delayed detection changes the response. Before increasing collection frequency, establish whether faster detection leads to an action that the on-call team can take.
Faster collection isn't useful when responders still have to reconcile conflicting device names, timestamps and interface labels.
Mixed collection methods need common identifiers, consistent units and visible freshness. Otherwise, operators can mistake an old polled value and a newer streamed value for contradictory evidence.
Set Up Router Monitoring and Verify It Works
A router appearing in inventory isn't proof of working monitoring. The rollout needs to demonstrate successful queries, meaningful counters, event delivery and an alert that reaches the correct responder.
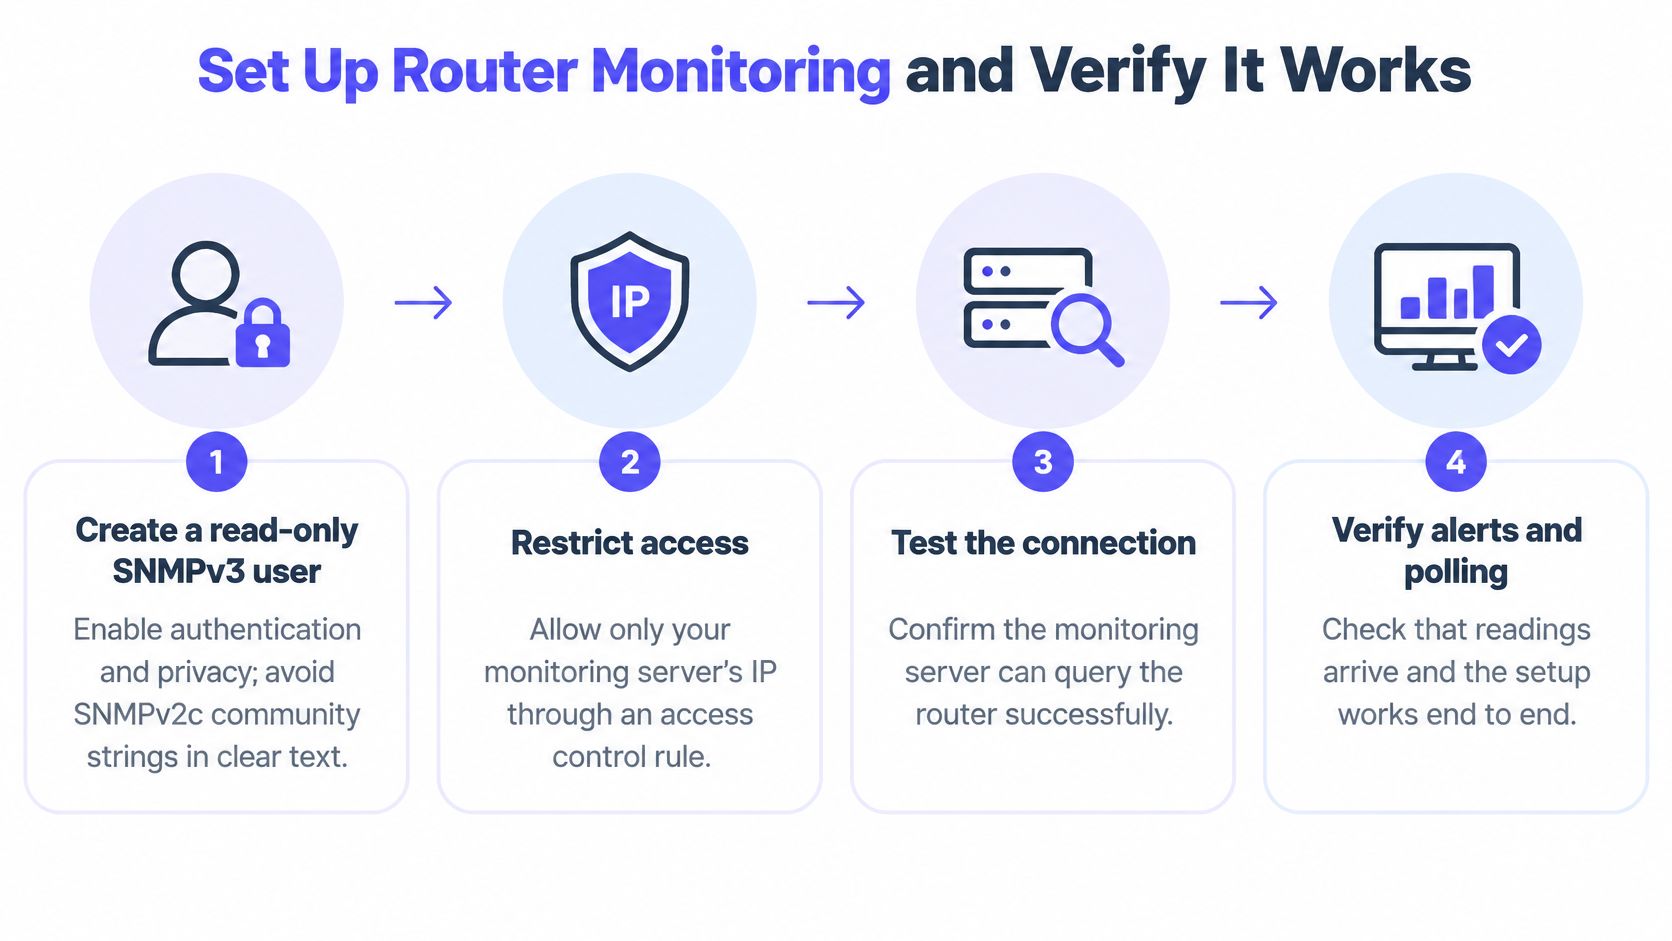
The secure setup path begins with restricted credentials and ends with an end-to-end test.
Configure collection securely
Create a read-only SNMPv3 identity with authentication and privacy. Use the platform's supported authentication and encryption options, and restrict its view to the objects required for monitoring. SNMPv2c community strings aren't encrypted, so compatibility shouldn't become the default security policy.
Restrict management access to the authorized collector through an access-control rule. Apply the restriction to the management service and its network path, including the relevant management routing context. Source restrictions reduce exposure, but they don't replace credential protection or rotation.
Configure syslog forwarding and synchronized time. Send events to the designated collector and verify that the router and collector agree on time and timezone handling. Preserve both event time and ingestion time so delayed delivery remains visible.
Add the router explicitly to the monitoring inventory. Test access from the actual collector, not an engineer's laptop, and request
ifHCInOctetsandifHCOutOctetsfor the interfaces that carry production traffic. Include stable interface descriptions so renumbered interface indexes don't attach history to the wrong link.
Credentials should come from a secrets store rather than a shared document or pasted configuration bundle. A successful authentication test should be followed by a useful-object test: access to system information alone doesn't prove that interface or routing objects are permitted.
Choose the initial polling cadence according to the incident response window and the router's ability to answer management requests. Also account for retries and confirmation delays. An apparently short interval can still produce slow alerting when the collector waits through repeated timeouts.
Establish normal behavior and alert ownership
Collect a representative baseline. Include routine backups, route-policy changes, scheduled maintenance and ordinary traffic peaks. Annotate exceptional events rather than treating them as normal capacity requirements.
Define alert rules only after interface roles and peer expectations are recorded. An unused access port, an intentionally disabled circuit and a production uplink shouldn't share the same down-state policy. Each actionable rule needs an owner, a response window and a linked runbook.
For CPU and utilization alerts, retain enough history to distinguish a transient workload from persistent pressure. For routing state, record which peers and address families are expected to be active. A peer configured for standby or maintenance shouldn't produce an unexplained emergency.
Prove the full response path
- Run a controlled failure during an approved maintenance window. Administratively disable a non-critical interface with a known recovery procedure. Record when the change occurred, when monitoring detected it, when the notification arrived and whether the recovery notification followed restoration.
The test should exercise the notification path, including schedules, silences and escalation settings. A successful test email from the settings screen doesn't prove that an interface rule will page the correct engineer.
Before marking the rollout complete, check:
- Counter movement: Traffic counters increase on an active link, and calculated rates are plausible.
- Collection continuity: The polling timeline shows successful samples rather than repeated gaps or stale values.
- Event alignment: The interface transition appears in syslog with a usable timestamp.
- Response readiness: The assigned engineer can follow the runbook without searching for platform commands.
- Recovery handling: Restoration closes the incident without leaving a duplicate alert open.
Fivenines combines SNMP network monitoring, server metrics, uptime checks and cron job monitoring in a single dashboard. It polls explicitly configured SNMP v2c/v3 devices for interface traffic, errors, reachability and alerts; adding an SNMP device takes another minute or two once credentials are ready. Each SNMP device counts toward the plan's monitor limit, alongside servers, uptime checks and cron tasks.
Expand the test across core, edge and remote-site router roles before treating the configuration as a reusable template. Success means the deliberate failure reached its owner within the agreed response window and the recovery procedure worked as written.
Alert Rules and Runbooks That Avoid Alert Fatigue
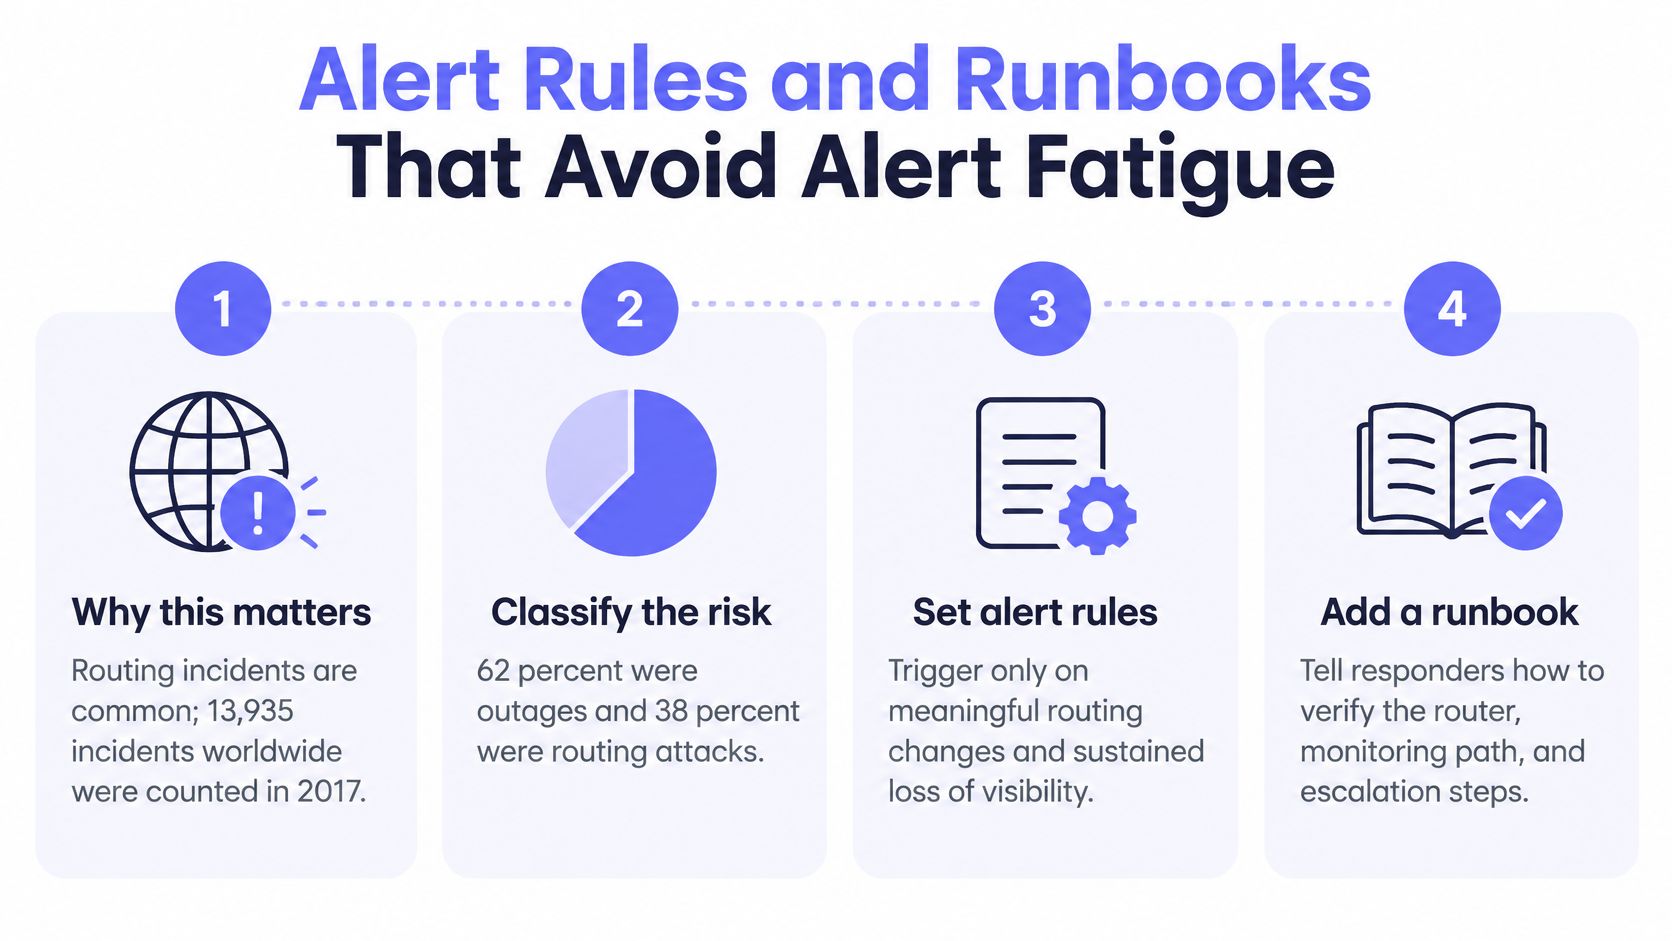
A 2017 BGPStream analysis counted 13,935 routing incidents worldwide, with 62% classified as outages and 38% as routing attacks, according to APNIC's routing-security incident summary. Alert design therefore needs to address service disruption and suspicious routing behavior, not just failed hardware.
Assign severity by required action
- Page now: An unexpected production uplink failure, lost required BGP peer, or independently confirmed external service failure needs immediate investigation.
- Create a ticket: Rising error rates, recurring congestion and deteriorating resource headroom require planned work when service remains protected.
- Record as informational: Approved configuration changes and isolated collection timeouts belong in the timeline unless correlated evidence raises their significance.
Confirm state through repeated observations or independent probes before paging. The confirmation method should match the failure: repeated polling can verify a persistent interface condition, while geographically separate probes help distinguish a regional access problem from a failed probe.
Avoid suppressing distinct failures under the same device incident. An unreachable management interface and a route-origin anomaly may require different owners even when they involve the same router.
The alert workflow should make those distinctions explicit.
Make the runbook executable
A routing runbook must distinguish symptoms from suspected causes. A dropped BGP session doesn't automatically justify restoring a prefix policy, especially when the transport path or remote peer failed.
| Runbook field | BGP session failure example |
|---|---|
| Alert name | Required transit peer not Established |
| First check | Inspect peer state, last transition reason and recent route withdrawals |
| Expected causes | Transport failure, peer maintenance, authentication mismatch or recent policy change |
| Owner | Network on-call engineer |
| Escalation time | The service's documented critical-incident deadline |
| Rollback step | Restore the previous prefix policy only when the recent policy change caused the failure |
Every live rule should include these required fields:
- Scope: Device, interface, peer or service covered.
- Condition: Trigger, confirmation and recovery criteria.
- Severity: The action expected from the recipient.
- Ownership: Primary responder and escalation destination.
- Runbook: Verification steps, safe remediation and rollback conditions.
An alert earns a page when a responder can identify the affected service and take a useful action.
During maintenance, silence the intended scope rather than disabling an entire collector. Retain the event history so operators can verify that planned changes produced only the expected effects.
Catching Silent Telemetry and Routing Problems
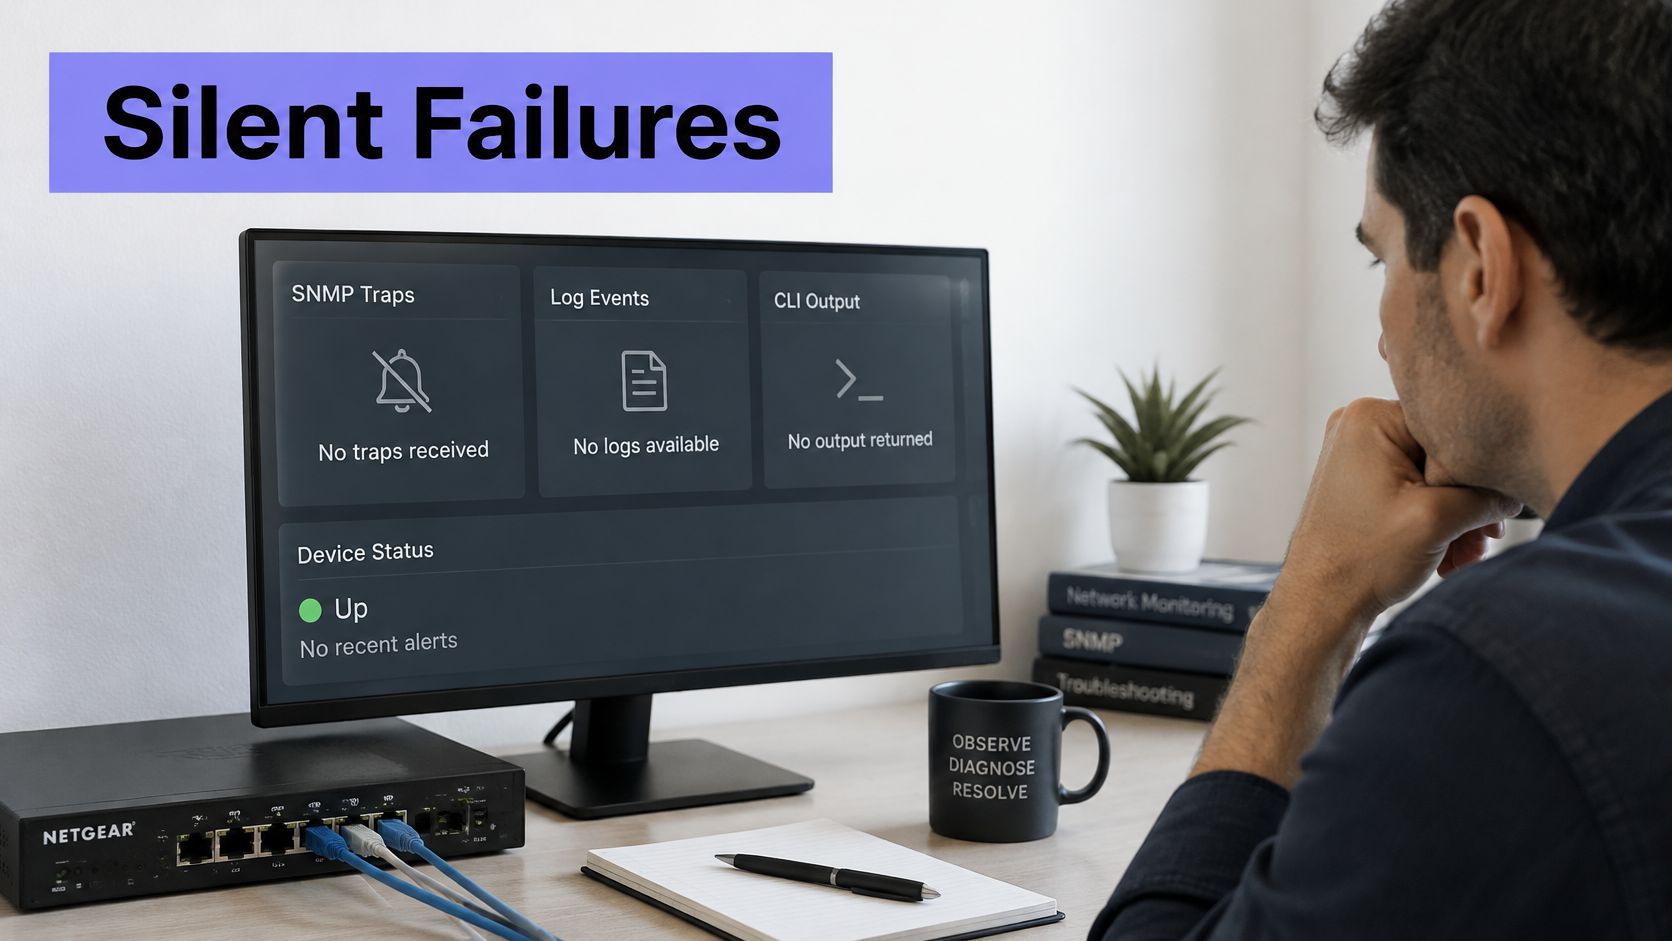
A quiet dashboard can mean a healthy router or a disabled monitoring path. Missing events aren't proof that nothing happened.
Reporting by CSO on compromised Cisco routers describes attackers suppressing AAA requests, SNMP traps, command output, logging and configuration evidence. That makes telemetry integrity an operational requirement, not merely a security investigation concern.
Monitor freshness and disagreement
- Add dead-man checks: Track successful collection timestamps and collector heartbeats. Alert on missing expected measurements rather than carrying the last good value forward as healthy.
- Separate evidence administration: Export critical events to a system with different access controls. A compromised router account shouldn't also permit deletion of the retained evidence.
- Compare independent sources: Correlate router state with identity-provider records, neighboring-device observations, flow exports and out-of-band management reachability.
Not every router emits syslog continuously. Use a scheduled measurement or explicit heartbeat for silence detection rather than assuming an event-free log stream has failed. The practical distinction is between no event expected and expected evidence missing.
A broader approach to monitoring silent failures also checks dependencies outside the affected component's control. For routers, that means testing the collector and delivery path as well as the device.
Validate reachability beyond the management network
Local health, routing state and customer access are separate observations. Nokia's routing-visibility analysis distinguishes route validation from visibility into received routes and external reachability; no isolated view supplies the complete operational picture.
Use layered detection for device failure, unexpected route withdrawal or origin changes, RPKI validation-state changes and regional access loss. BMP can expose received routing information where supported, while external probes test whether customers can connect.
Say an edge router remains manageable and its transit session stays Established, but an upstream network stops propagating the service prefix. Internal metrics can remain normal while probes in an affected market fail. Responders should compare prefix visibility, validation state and regional service checks before concluding that the application is broken.
Every production router needs an answer to a concrete question: which independent source would reveal that its own telemetry had gone quiet?
Scaling Router Monitoring Across Sites and Clients
Router monitoring usually fails at scale because it's too small to trust or large enough to become another system to operate. The remedy isn't unrestricted collection. It's consistent inventory, controlled collector placement and clear ownership.
Group routers by site, client, environment and operational role. Use collectors near devices when WAN instability or management-network boundaries would otherwise make central polling unreliable. Avoid deploying a collector at every location without considering how its health, upgrades and credentials will be managed.
Standardize identity and access
A centralized monitoring approach needs consistent identifiers even when collection remains distributed. Device names, interface descriptions and client labels should support reliable alert routing without manual interpretation.
- Separate credentials: Give each client's routers distinct credentials, stored in a secrets manager.
- Limit visibility: Apply role-based access so technicians see only authorized client infrastructure.
- Restrict management paths: Permit router-management access from the monitoring network rather than general user networks.
- Separate environments: Route production, staging and development incidents to appropriate response paths.
Template the expected checks by router role, but retain documented exceptions. A branch router shouldn't inherit transit-edge routing expectations merely because both devices share a vendor.
Set retention deliberately
Client IP addresses and usernames in syslog can constitute personal data when they identify or can be linked to individuals. Flow records also reveal communication patterns, so access and retention deserve more care than aggregate interface graphs.
Document hosting location, collection purpose, access permissions and deletion periods separately for syslog, flow records and metrics. Retain the detail needed for investigations without keeping sensitive records indefinitely.
Begin with a single site. Add locations only after the team has validated normal behavior, alert ownership, collector recovery and the controlled-failure test. Expansion should copy a proven operating model, not multiply unresolved configuration differences.
Fivenines brings router health, Linux server metrics, multi-region uptime checks and cron job tracking into a shared monitoring dashboard. Visit Fivenines to start with a production router, add an external service check, and verify that a controlled failure reaches the right responder.