How to Monitor Remote Servers Securely

54% of respondents said their most recent significant, serious, or severe outage cost more than $100,000, according to Uptime Institute's Annual Outage Analysis 2025, reporting on 2024. That makes remote monitoring an operational control, not a dashboard project. The useful question isn't how many metrics a team collects. It's whether the monitoring system can justify interrupting an engineer.
Teams that monitor remote servers securely need evidence from both sides of the connection: host telemetry delivered without unnecessary inbound access, and external checks that follow the customer's path. A page should contain a confirmed failure, an accountable owner, and enough context to start recovery. Everything else belongs in diagnostic history or a lower-priority work queue.
Table of Contents
- Agent or Agentless for Locked Down Hosts
- Set Up HTTPS Telemetry and Regional Checks
- Why Green Hosts Still Fail Users
- Page Only After the Failure Is Real
- Run Many Hosts as Code
- Start With One Outbound Agent
Agent or Agentless for Locked Down Hosts
An outbound push agent is the default for Linux servers that shouldn't accept inbound monitoring connections. A minimally privileged process collects local metrics and sends them over HTTPS to an allowlisted collector. The server doesn't need an exposed agent listener or inbound SSH access for routine telemetry.
That's a collection decision, not permission to grant the agent unrestricted access. Its service account should read only the metrics and logs required for its assigned checks. Access to container sockets, hypervisor interfaces, and GPU information deserves separate review because those interfaces can carry privileges beyond ordinary resource inspection.
How to collect telemetry from remote servers
| Approach | Best when | Telemetry path | Exposure | Trade-off |
|---|---|---|---|---|
| Push agent | Linux servers and containers that support installation | Outbound HTTPS to an allowlisted collector | No inbound monitoring port | Agent to install, update, and identify |
| Agentless pull | Network gear and hosts that cannot run an agent | SNMP, SSH, or vendor API from a collector | Management path must be locked down | Credentials and firewall exceptions to audit |
| External probes | Customer-path availability | HTTPS, TCP, ICMP, and DNS from several regions | No host login | Misses CPU, disk, and process saturation |
| Hybrid | SaaS, hosting, and MSP production fleets | Agent metrics plus multi-region probes | Least privilege on both paths | Collection and probe configurations must stay aligned |
Reject unnecessary administration paths
Agentless collection fits appliances and network equipment, but agentless doesn't mean accessless. A collector still needs a route, credentials, and authorization. Restrict that route to controlled sources, prefer read-only permissions, and log authentication and configuration changes.
The NIST guide to enterprise remote access security recommends encrypted communications, strong authentication, restricted administration hosts, least privilege, endpoint authentication, and remote-access logging. Those controls matter because encryption alone doesn't establish that a collector or administrator is trustworthy. A credential carried inside HTTPS can still be overprivileged or stolen.
Controlled source restrictions are stronger than treating a hostname allowlist as sufficient protection for privileged access. Publicly reachable SSH also isn't a substitute for a managed remote-access boundary. Interactive administration belongs behind a VPN or an equivalent controlled access mechanism, separate from the telemetry channel.
Keep collection separate from customer checks
External probes answer whether a service can be reached and used from outside the infrastructure. They don't reveal whether a database is approaching memory exhaustion or a filesystem is running out of inodes. Conversely, an agent can report healthy resources while a customer-facing route fails.
Practical rule: Monitoring access shouldn't quietly become a remote command channel.
A design for monitoring internal services without opening firewall ports should make that separation explicit. Agent updates, credential revocation, and collector changes need documented ownership, just like firewall changes.
For production SaaS, hosting, and MSP fleets, choose hybrid collection unless the host cannot run an agent. Use the agent for internal resource evidence and external probes for the service customers consume.
Set Up HTTPS Telemetry and Regional Checks
A hybrid deployment should start with a definition of success, not an installation command. A successful HTTPS response might still contain an application error, an empty search result caused by a failed dependency, or a login page where an authenticated result should appear.
Google's SRE case studies support combining internal telemetry with black-box checks, including checks capable of exposing network, cache, and proxy failures that service-side monitoring can miss. The same collection design should capture latency, traffic, errors, and saturation, then connect those signals to a meaningful user journey.
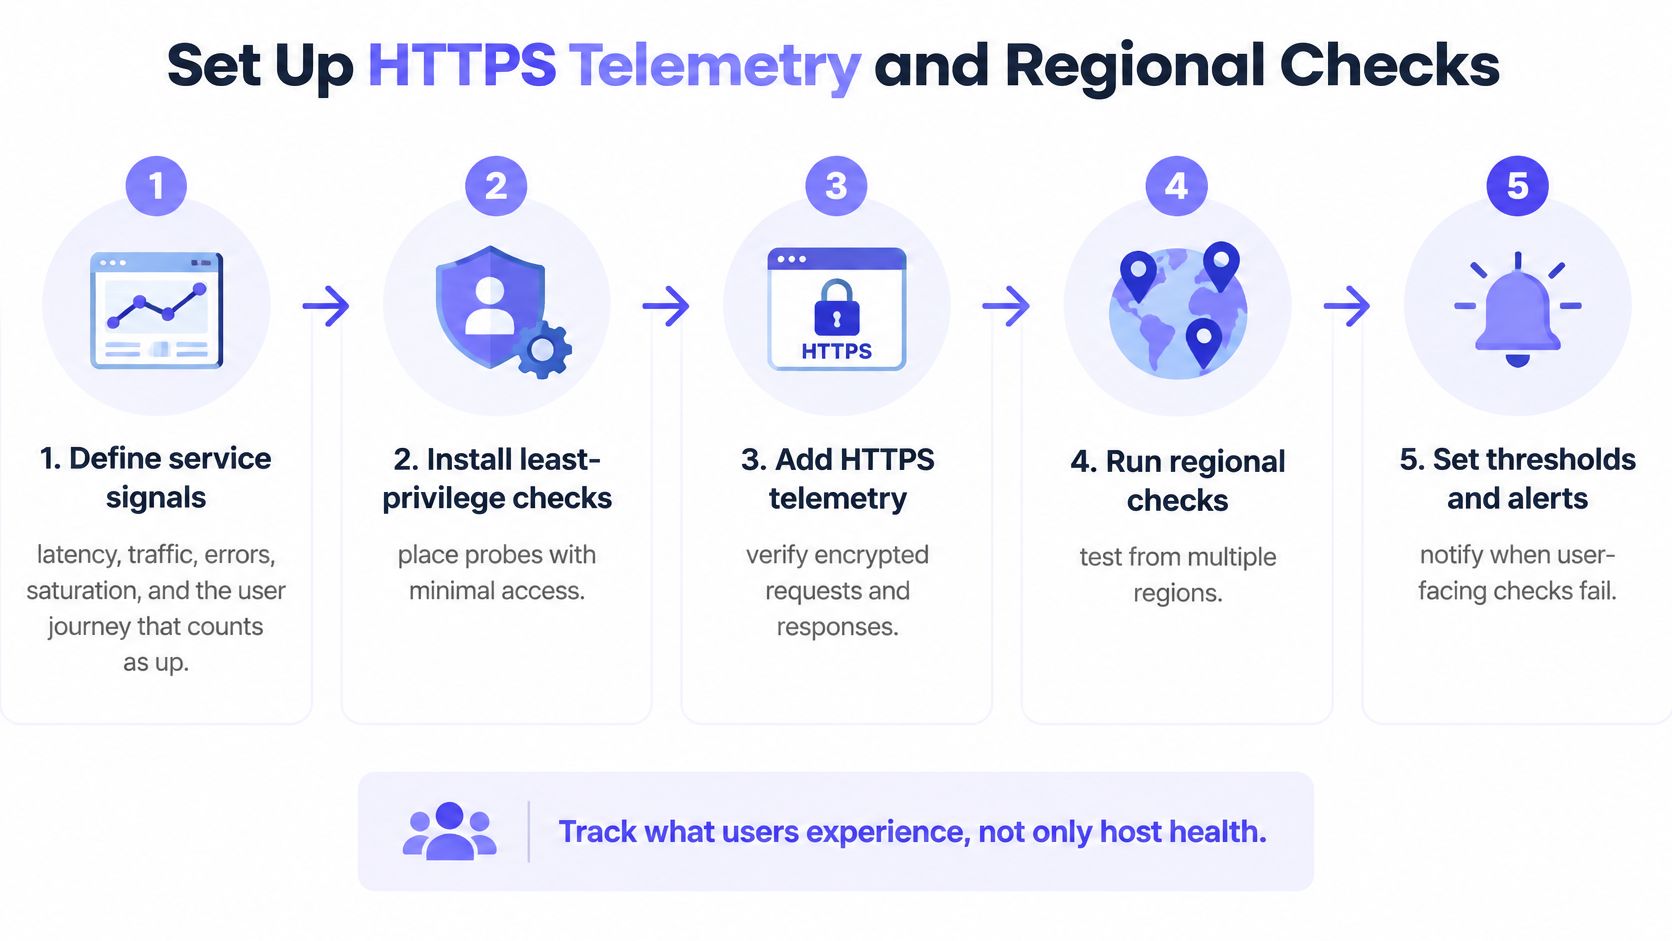
The deployment flow keeps access, external reachability, and alert ownership in the same implementation.
Build the collection path deliberately
Define the service signals and the successful journey. For a web application, that might mean resolving the public name, establishing HTTPS, authenticating with a dedicated synthetic account, and retrieving an expected result. Set a latency objective for that operation rather than declaring the service healthy whenever a port answers.
Install a least-privilege Linux agent with a stable identity. Use an inventory identifier that survives a hostname change but distinguishes a replacement machine from its predecessor. Configure outbound HTTPS only to the approved collector and keep certificate validation enabled.
Collect the metrics that explain service behavior. Include CPU, available memory, disk capacity and I/O, network traffic, process state, and application metrics. Add container, hypervisor, or GPU series only where those workloads exist. Unused integrations create configuration work without improving diagnosis.
Manage credentials and transmission records. Give each agent an attributable credential, rotate it through the deployment process, and log configuration changes and failed sends. Collector certificate failures need investigation, not a permanent validation bypass; certificate handling on Linux is part of operating the telemetry path.
Add checks outside the origin network
Place external checks on customer-relevant routes. Use HTTPS, DNS, TCP, and ICMP checks for distinct purposes. A practical starting configuration uses independent regions serving the customer base, not several probes beside the origin. Confirm that the chosen locations differ meaningfully in network path.
Confirm before paging. Record the initial failed probe, then require another region or a repeat attempt to confirm the failure before issuing a page.
Monitor the monitoring path. Detect missing agent samples, rejected credentials, collector errors, and delayed ingestion. Encrypted telemetry limits what a passive network tap can establish about application-level delivery, so agent and collector records must remain available.
Attach operational ownership before enabling notifications. Every page needs an owner, a runbook, a severity, and an escalation destination. Maintenance suppression should have an expiry and a named operator responsible for restoring coverage.
Review target changes before rollout. Require a readable target-set diff, including removals and identity changes. Percentage-based deletion guards aren't sufficient by themselves: a materially harmful change can remain below a configured threshold. Pair them with absolute removal checks and explicit approval.
Run a deliberately small pilot before fleet deployment. For example, a five-host pilot could include a web node, a database, a scheduled-job worker, and supporting application hosts, with external checks from independent customer regions. Validate agent delivery, a failed journey, maintenance suppression, and escalation before extending the configuration.
Why Green Hosts Still Fail Users
53% of operators had experienced an outage during the previous three years, according to Uptime Institute's 2024 Global Data Center Survey. Healthy host charts don't establish that customers avoided those disruptions. A server-side dashboard can only describe the requests and resource activity visible to that server.
The gaps usually sit in name resolution and transport, application dependencies, or regional reachability. These require different checks because their failure signatures aren't interchangeable.
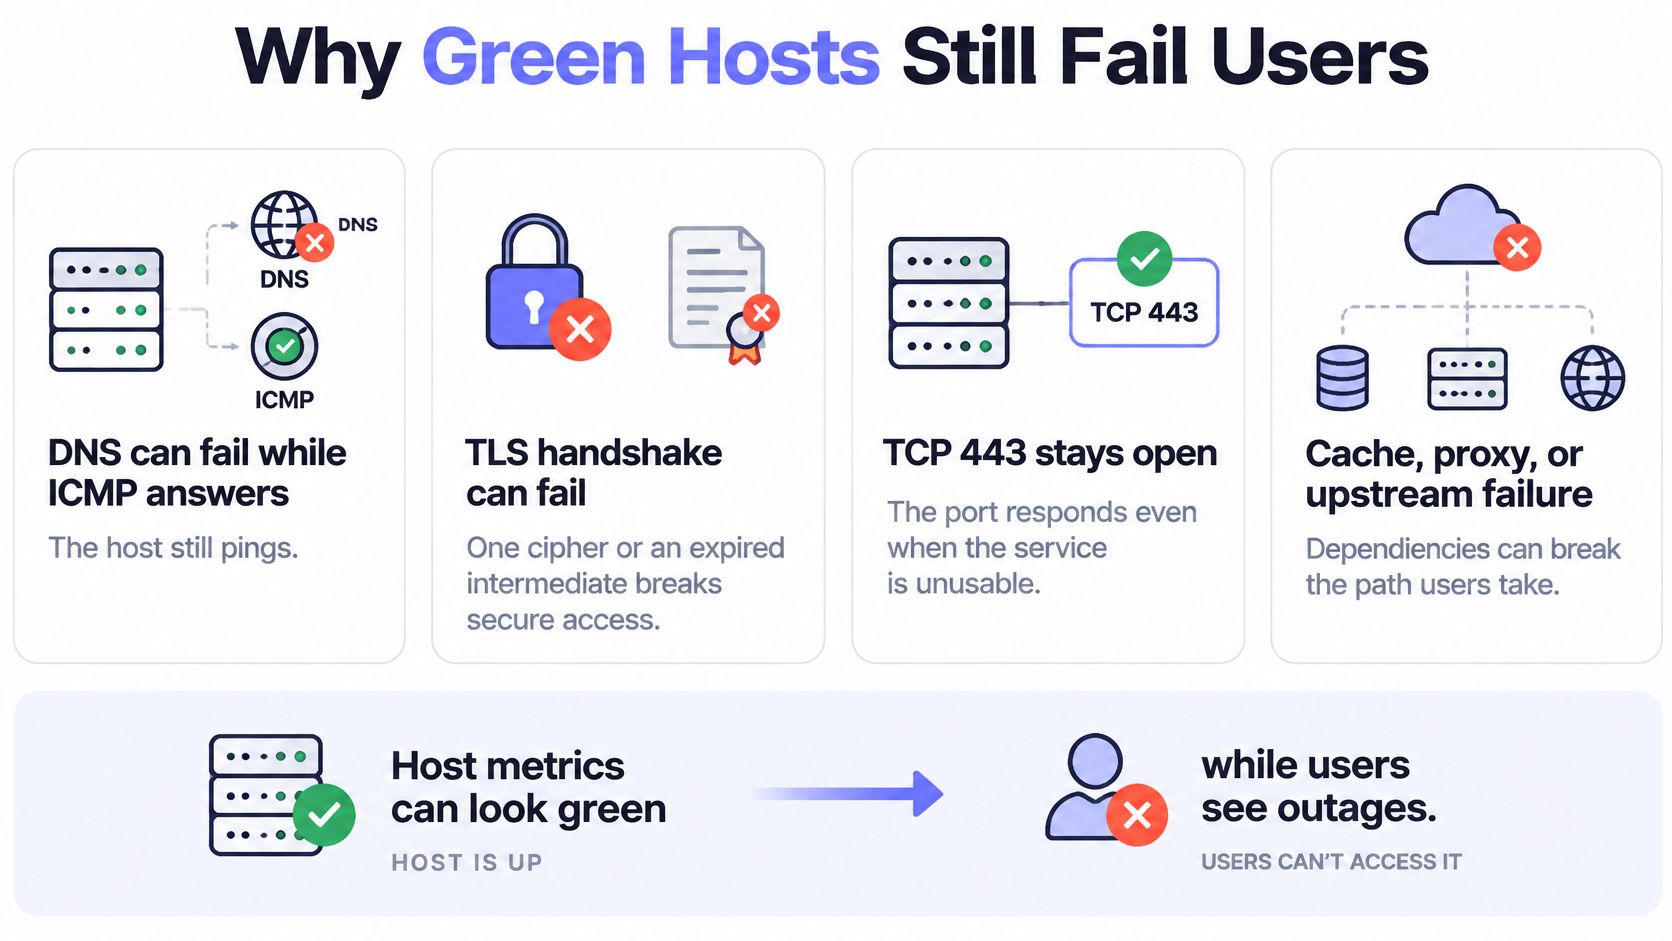
The distinction becomes clear when each layer is measured separately.
Separate the layers before diagnosing the outage
- Name resolution and transport: DNS can fail while ICMP still answers. A TCP connection can succeed while TLS negotiation fails because of certificate-chain problems or incompatible cryptographic settings. An open HTTPS port therefore doesn't establish usable secure access.
- Application dependencies: A cache, reverse proxy, identity provider, or upstream API can break the journey while the origin remains idle. Low CPU may mean requests never reached the application, not that the application is serving customers successfully.
- Regional reachability: A routing failure can affect customers in a particular geography while the operator's office connection works normally. A nearby probe cannot establish the health of a different customer route.
Checks should preserve these distinctions instead of reducing everything to an undifferentiated uptime indicator. An HTTPS journey establishes application behavior; separate DNS, TCP, and certificate checks narrow the investigation. Synthetic monitoring is useful when it verifies the expected result rather than merely accepting a response.
Preserve evidence before conditions change
At alert time, retain the failing location, timestamps, resolved destination, response status or timeout stage, and certificate validity information. Attach the corresponding CPU, disk, network, and process snapshot. Keep the initial failed sample even if confirmation later succeeds and no page is sent.
Troubleshooting speed matters more than dashboard volume: 49% of ITOps and engineering respondents in Splunk's 2025 survey identified incident-troubleshooting speed as having the greatest effect on observability ROI, according to the published analysis of Splunk's survey.
A low origin error rate isn't proof of availability when failed requests never reach the origin.
Probe placement should improve fault isolation, not merely increase polling volume. Operators need to establish whether the customer journey completed from the affected geography, then use host telemetry to explain why it didn't.
Page Only After the Failure Is Real
More telemetry doesn't automatically make a fleet more reliable. In Grafana Labs' 2025 survey of 1,255 observability practitioners, alert fatigue ranked as the leading obstacle to faster incident response, nearly twice as high as the next challenge. Paging design must account for the engineer's attention as carefully as collection design accounts for server access.
A metric crossing a threshold is an observation. A page is a request for immediate action. Teams should reserve that request for confirmed customer impact or a condition likely to cause damage before the normal work queue can address it.
Start with explicit workload rules
The following is a hypothetical starter policy, not a universal set of safe limits or a finding from the survey. Its values illustrate how an operator might configure a pilot; workload baselines, response obligations, and available capacity should determine the production settings.
When a remote check should page
| Signal | Page when | Stay quiet when | Window |
|---|---|---|---|
| HTTPS from customers | Two regions fail, or 2 of 3 attempts fail | One probe or one region briefly blips | 2 minutes |
| Web CPU | Sustained above 85%, with exhausted headroom or service degradation | Deploy or autoscale spike under 5 minutes | 10 minutes |
| Batch CPU | Above the job baseline throughout its expected window and completion is at risk | Expected nightly peak | Job duration |
| Disk | Under 15% free or sustained inode pressure | Log rotation restores adequate space | 15 minutes |
| Cron or backup | Missed run, or runtime over 2x baseline | Declared maintenance | Next expected run |
| TLS certificate | Under 14 days remaining and renewal failed | Renewed certificate is already served successfully | Daily |
| Agent silence | No metrics or persistent collector send errors | Declared maintenance | 5 minutes |
A healthy batch host can spend its processing window heavily utilized. A web node needs spare capacity to absorb traffic changes. Applying an identical CPU rule to both produces noise on the batch worker and potentially inadequate warning on the web tier.
Disk rules need similar judgment. Free-space percentage alone doesn't describe how quickly a write-heavy database could fill its volume, while inode exhaustion can prevent new files despite available capacity. A capacity warning can create a ticket; imminent write failure can justify a page.
Route incidents rather than individual symptoms
Group a failed database and the resulting web errors into a shared incident when the dependency is established. Preserve the downstream symptoms as evidence, but don't require separate acknowledgements from the same responder. For containers, group by service and deployment rather than paging separately for every replaced instance.
Paging boundary: Every interrupt should name an action that cannot reasonably wait.
The primary on-call engineer needs an acknowledgement deadline and a secondary destination. A workflow might notify chat, retry delivery, then escalate through SMS or a webhook if acknowledgement never arrives. Retries should remain attached to the existing incident rather than creating duplicate pages.
After each incident, record false positives, missed alerts, acknowledgement time, and recovery time. Delete ineffective rules, widen inappropriate windows, or repair missing dependency relationships. Small teams and MSPs operating across time zones benefit more from this discipline than from another chart that nobody owns.
Run Many Hosts as Code
Fleet monitoring fails when onboarding relies on an administrator remembering every dashboard setting. A shared definition with per-client inputs makes coverage reviewable and gives replacements the same operational controls as existing machines.
A fleet view should make ownership and service relationships clear, not merely display more hosts.

Separate client identity from shared implementation
Give each customer a project or tenant boundary, consistent tags, and an independently configured escalation route. Tags help organize resources, but they aren't an authorization boundary unless the platform explicitly enforces them. Access controls must prevent a client from viewing another client's metrics, incidents, or notification destinations.
Client-facing status pages should use recognizable service names rather than internal hostnames. A customer needs to understand whether the billing portal or backup service is affected, not decode the operator's machine inventory. Publish only the information appropriate for that audience.
A reusable module should accept concrete inputs:
- Service identity: Tenant, environment, service name, resource identifier, and accountable team.
- Collection settings: Collector destination, enabled integrations, and credential references rather than embedded secrets.
- Check policy: Journey definition, probe locations, evaluation windows, maintenance behavior, and capacity rules.
- Incident routing: Primary contact, acknowledgement deadline, retry behavior, and secondary contact.
Use a supported Terraform provider for persistent resources and the REST API for operational actions. The practical value of monitoring as code is a reviewable change history, not a requirement to force every temporary silence into Terraform state.
Review removals as carefully as additions
Store collector destinations, check types, routing references, and thresholds in version control. Before applying changes, review target removals, tenant moves, disabled checks, and altered notification destinations. A clean deployment plan should contain no unexpected destruction.
Temporary operational actions need audit records too. Bulk silencing during a migration should include a reason and expiry; attaching a tenant webhook should require the correct scope. Retiring a host should revoke its credential, remove stale checks, and preserve incident records according to the retention policy.
The accompanying video provides another view of the operational workflow.
For a hypothetical rollout, operators could apply a shared module to a small mixed-client group and verify that each tenant receives only its own test incident. Acknowledgement, escalation, maintenance expiry, and host retirement should all be exercised before broader deployment.
European hosting requirements also belong in the design. Review where telemetry is stored, who can access it, what identifying information enters labels or logs, and how deletion works. A hosting location alone doesn't establish GDPR compliance.
The scalable outcome is a shared implementation with explicit client boundaries, not an independently maintained monitoring stack for every account.
Start With One Outbound Agent
A Linux pilot should begin with an outbound HTTPS agent on a representative host and customer-facing checks from independent regions. The first acceptance test isn't an attractive dashboard. It's a deliberately triggered failure that reaches the correct responder with usable evidence.
An appliance-heavy estate needs a different collection starting point: a restricted collector with audited read-only access. The external journey checks still belong in the pilot, because successful device polling doesn't establish customer availability.
Choose the operational burden deliberately
Prometheus, Grafana, and Alertmanager can support a capable monitoring system when a team already operates them and owns their configuration. Starting a fresh stack also means accepting responsibility for storage, upgrades, collection failures, notification routing, and monitoring-system recovery. Adding separate uptime and cron services introduces more ownership boundaries.
A hosted platform is a reasonable alternative when the immediate need is consistent coverage rather than a custom observability architecture. The evaluation should verify outbound collection, failure confirmation, routing, API coverage, and export options. Product demonstrations shouldn't replace a failed-check test.
A pilot earns expansion when the right person receives the right incident and can act without reconstructing the failure.
The pilot's acceptance checklist should include:
- Access: Routine telemetry works without opening inbound administration paths.
- Coverage: Host metrics, a customer journey, and a scheduled-job check produce attributable results.
- Response: Confirmation, acknowledgement, escalation, and recovery notifications behave as intended.
- Maintenance: Suppression expires, and retired resources stop generating alerts.
After a complete operating cycle, the team should review every interrupt and every missed condition. Rules that never justified immediate action should become tickets, receive better conditions, or disappear. Fleet rollout should follow that review, not precede it.
Fivenines is one hosted option that combines outbound HTTPS Linux telemetry, multi-region availability checks with failure confirmation, cron tracking, and team alert workflows, with a REST API and Terraform provider for fleet configuration. Teams can visit Fivenines to build a representative pilot and test a confirmed outage, an escalation, and a maintenance window before expanding coverage.