Monitoring as a Code: How to Build It with Terraform

Production has a checkout alert that staging doesn't. Someone changed its threshold during an incident, but nobody remembers why. The dashboard looks healthy until an accidental deletion exposes how much monitoring configuration exists only in browser tabs and operator memory.
Moving those definitions into Git fixes reproducibility. It doesn't fix bad alerts. A monitor should earn its place in production through a named owner, a usable runbook, and tests that prove it detects the intended failure.
Table of Contents
- What Monitoring as a Code Means in Practice
- Benefits and Trade-offs Side by Side
- Architectures and Patterns That Scale
- Alert Quality Gates Before You Build Monitors
- How to Build Monitors with Terraform and the API
- Testing and Validating Monitors in CI/CD
- How to Migrate from Legacy Monitoring
- Choose Your Starting Point for Teams and MSPs
What Monitoring as a Code Means in Practice
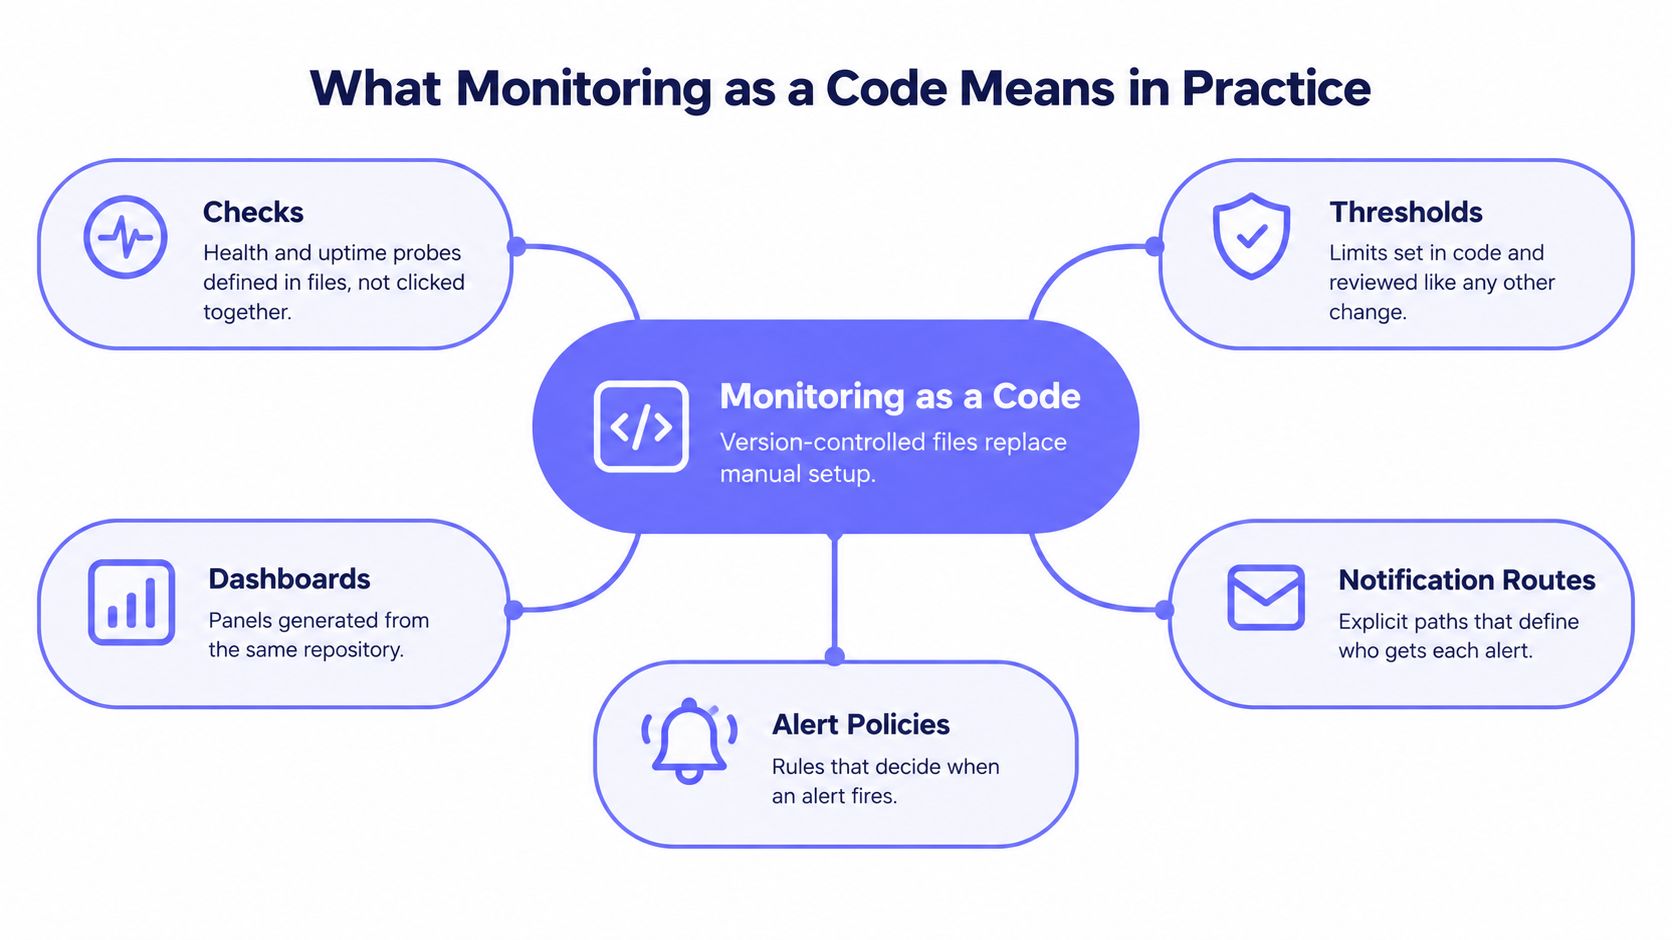
Monitoring as a code means defining checks, thresholds, dashboards, alert policies, and notification routes in version-controlled files instead of configuring them manually. A written recipe lets another cook reproduce a dish; cooking from memory works only while the original cook is available. Monitoring definitions serve the same purpose for operations teams.
Consider a hypothetical checkout monitor. An HTTPS check probes the checkout page from three regions, requires two consecutive failures, and notifies on-call through Slack and SMS. Those are example configuration choices, not universal defaults.
The definition, decision, and delivery
The configuration separates three concerns:
- Monitor definition: What gets checked, from which locations, and on what schedule. Checking a homepage isn't equivalent to checking whether checkout loads correctly.
- Alert policy: What constitutes failure, how failures are confirmed, and which severity applies. A successful HTTP response containing an error page shouldn't automatically count as healthy.
- Notification routing: Which team receives the alert, through which channel, and under what delay and escalation rules.
The checkout definition becomes a reviewable file. A pull request exposes changes to its target, confirmation policy, and destination before those changes affect on-call.
The concept map shows the configuration surfaces that belong together.
A practice rather than a product
This approach belongs to the broader observability-as-code shift, including telemetry pipelines and service-level objectives. In a 2025 global survey of 1,855 professionals across nine countries, Splunk reported observability-as-code adoption among 57% of frequent OpenTelemetry users, compared with 10% of OpenTelemetry laggards.
That association isn't proof of causation. It does place codified monitoring alongside standardized instrumentation and the DevOps move toward reproducible operational artifacts.
For operators managing customer devices, RDE Technologies' explanation of how remote monitoring and management works helps distinguish remote management capabilities from monitoring configuration. Monitoring as code doesn't require remote execution: tools with suitable APIs or providers can support the practice.
Benefits and Trade-offs Side by Side
Codified monitoring improves reproducibility, review, and recovery, but requires upfront engineering and ongoing maintenance. It replaces repetitive configuration work with software ownership, not with zero work.
In Grafana Labs' 2024 Observability Survey, 76% of respondents had centralized observability, while more than two-thirds of teams used at least four observability technologies. At that scale, operators can easily miss a changed route or an environment-specific exception.
Manual monitoring versus monitoring as code
| Criterion | Manual dashboard setup | Monitoring as code | Trade-off to plan for |
|---|---|---|---|
| Setup time for a new environment | Repeat setup through the UI | Apply reviewed files with environment inputs | Initial definitions take longer to write |
| Drift between environments | Easy to introduce and overlook | Scheduled plans expose supported differences | A nightly drift job needs an owner |
| Change review | Often relies on informal approval | Pull request with diff and approval | Every alert change enters a review workflow |
| Audit trail | Vendor logs, where available | Commit history plus CI execution records | History covers committed changes, not every UI action |
| Recovery after accidental deletion | Reconstruct configuration from exports or memory | Refresh state and reapply declared resources | Existing objects missing from state need import, not duplication |
| Onboarding a new engineer | Learn through dashboard walkthroughs | Read definitions and module documentation | Git, Terraform, and provider knowledge are required |
| Maintenance cost | Repeated work grows with monitor count | Module and tenant maintenance replaces repeated setup | Abstractions can become harder to change than the clicks they replaced |
A Terraform plan only detects what the provider reads and models. An unsupported notification setting can still drift without appearing in the diff.
Costs that need explicit ownership
- Provider learning: Engineers must understand replacement behavior, import identifiers, and API defaults. A harmless-looking attribute change can recreate a resource.
- State operations: Use remote state with encryption, restricted access, and supported locking. Separate credentials alone don't prevent concurrent applies against shared state.
- Secrets handling: Inject API tokens through CI secrets or a secret manager. Marking a value sensitive hides some output but doesn't guarantee its absence from state.
- Scope control: Start with a critical service rather than translating every dashboard immediately. Otherwise, teams spend time preserving obsolete alerts.
Practical rule: Automate a monitoring pattern after its operational behavior is understood, not merely because its configuration can be exported.
A small, stable deployment may gain little from extensive modules. Repeated environment rebuilds and client onboarding make reusable definitions more valuable, but there's no universal break-even schedule. Teams should compare avoided setup work against review, testing, and upgrade effort.
Architectures and Patterns That Scale
Collector-style monitoring makes the telemetry path explicit. The OpenTelemetry Collector architecture defines pipelines through receivers, optional processors, and exporters, which the Collector constructs at startup. Operators can review ingestion, enrichment, filtering, and delivery as configuration changes rather than reconstructing them from console settings.
Separate metrics, logs, and traces pipelines allow signal-specific processing within a shared deployment artifact. Metrics might need aggregation, logs might need filtering, and traces might need sampling. Multiple exporters also allow a pipeline to feed an existing backend and a replacement during migration, although duplicate delivery increases resource use and potentially ingestion costs.
Configuration files make those deployment decisions visible.
Monitoring as code patterns and when to use them
| Pattern | Best fit | How definitions are organised | Main risk |
|---|---|---|---|
| Single repository, one state per environment | Solo operators and small SaaS teams | Environment folders with explicitly shared inputs | Copy-paste drift between folders |
| Reusable module per service type | DevOps teams with similar services | Modules for HTTPS checks, cron checks, and server monitors | Over-abstracted modules become difficult to change |
| Base module with tenant overlays | MSPs serving several clients | Base definitions with separate variables and state per client | Credentials or routes leaking across clients |
| Declarative Kubernetes resources | Clusters running OpenTelemetry Collectors | Operator-reconciled custom resources, node-local DaemonSets, and shared Deployments | Operator upgrades or missing runtime permissions |
| Central definitions with push agents | Hosting providers managing fleets | Central definitions with agents pushing telemetry over HTTPS | A repository error affects many machines |
The Kubernetes arrangement is described in OpenTelemetry's Kubernetes observability blueprint, including Operator-managed deployment modes and presets for associated permissions and runtime resources. Those supporting resources matter: valid Collector configuration still fails when collection requires an unavailable mount or denied permission.
Separate failure domains before sharing modules
Environment separation should be real, not just a naming convention. Terraform workspaces separate state, but they aren't an authorization boundary; production credentials and apply permissions need independent controls.
For tenant fleets, validate routing destinations against the tenant identity before planning. Shared modules should expose operational differences directly instead of burying them in conditional expressions.
Choose the simplest pattern that preserves those boundaries. Introduce modules when repeated definitions have stable similarities, and keep explicit exceptions when forcing uniformity would hide meaningful service behavior.
Alert Quality Gates Before You Build Monitors
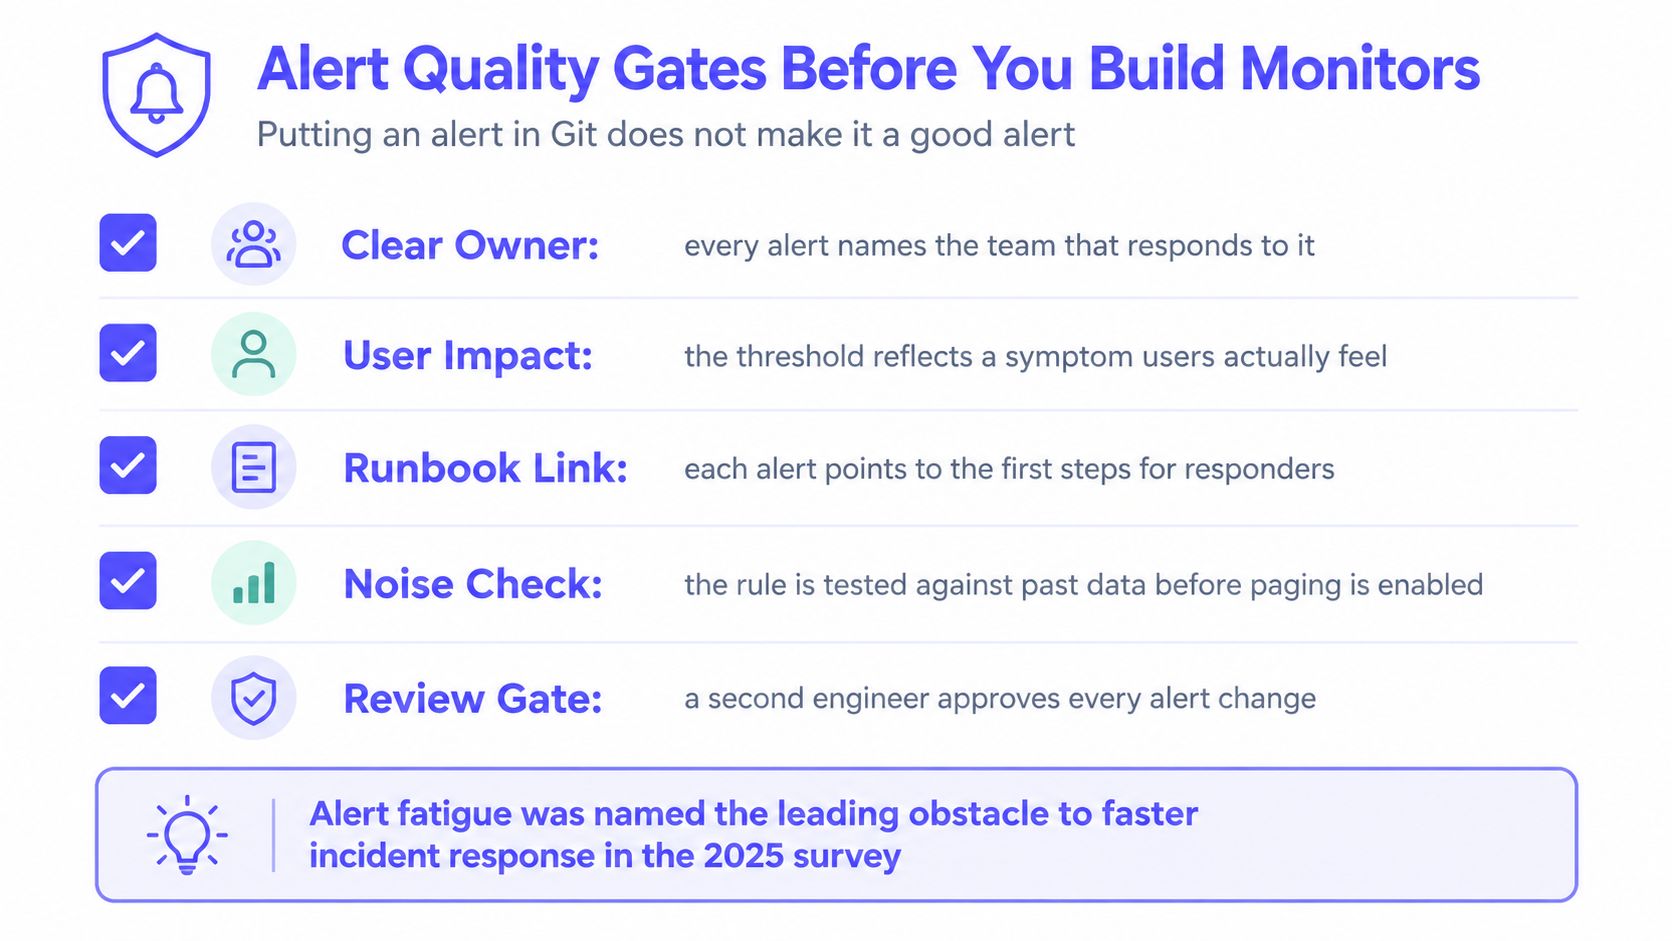
Putting an alert in Git doesn't make it useful. A 2025 Grafana observability survey of 1,255 respondents identified alert fatigue as the leading obstacle to faster incident response. Codification can reproduce noise just as reliably as useful detection.
Required metadata before admission
Every proposed monitor needs:
- Owner: The team accountable for its behavior and maintenance.
- Severity: The response urgency, justified by impact.
- Runbook: A maintained link to diagnosis and safe first actions.
- Escalation policy: The fallback when the initial responder doesn't acknowledge.
- Deduplication rule: How related events become an actionable incident.
- Maintenance window: The suppression policy, including an explicit no-suppression choice.
- Impact statement: The user or business failure the monitor detects.
Schema validation should reject missing or empty fields. A runbook URL alone isn't sufficient if responders can't access it.
The checklist emphasizes the operational review behind those fields.
Reject noise rather than formalizing it
Consider a hypothetical CPU alert that repeatedly fires without prompting action. Changing its condition to sustained load might remove transients, but paging should still require a credible relationship to service impact; otherwise, retain it as diagnostic information or retire it.
The alert setup guide provides context for configuring the delivery side. Before paging is enabled, the rule must also pass behavioral tests, including recovery.
A monitor belongs in production when responders can explain what decision its alert requires.
Review monitor usefulness quarterly. Record retirement and threshold decisions in commits so future maintainers understand the operational reasoning.
How to Build Monitors with Terraform and the API
The implementation needs a clear boundary between an internal monitor schema and the provider's actual resources. Resource names, authentication variables, and endpoint paths must come from the installed provider and API documentation, not from guessed examples.
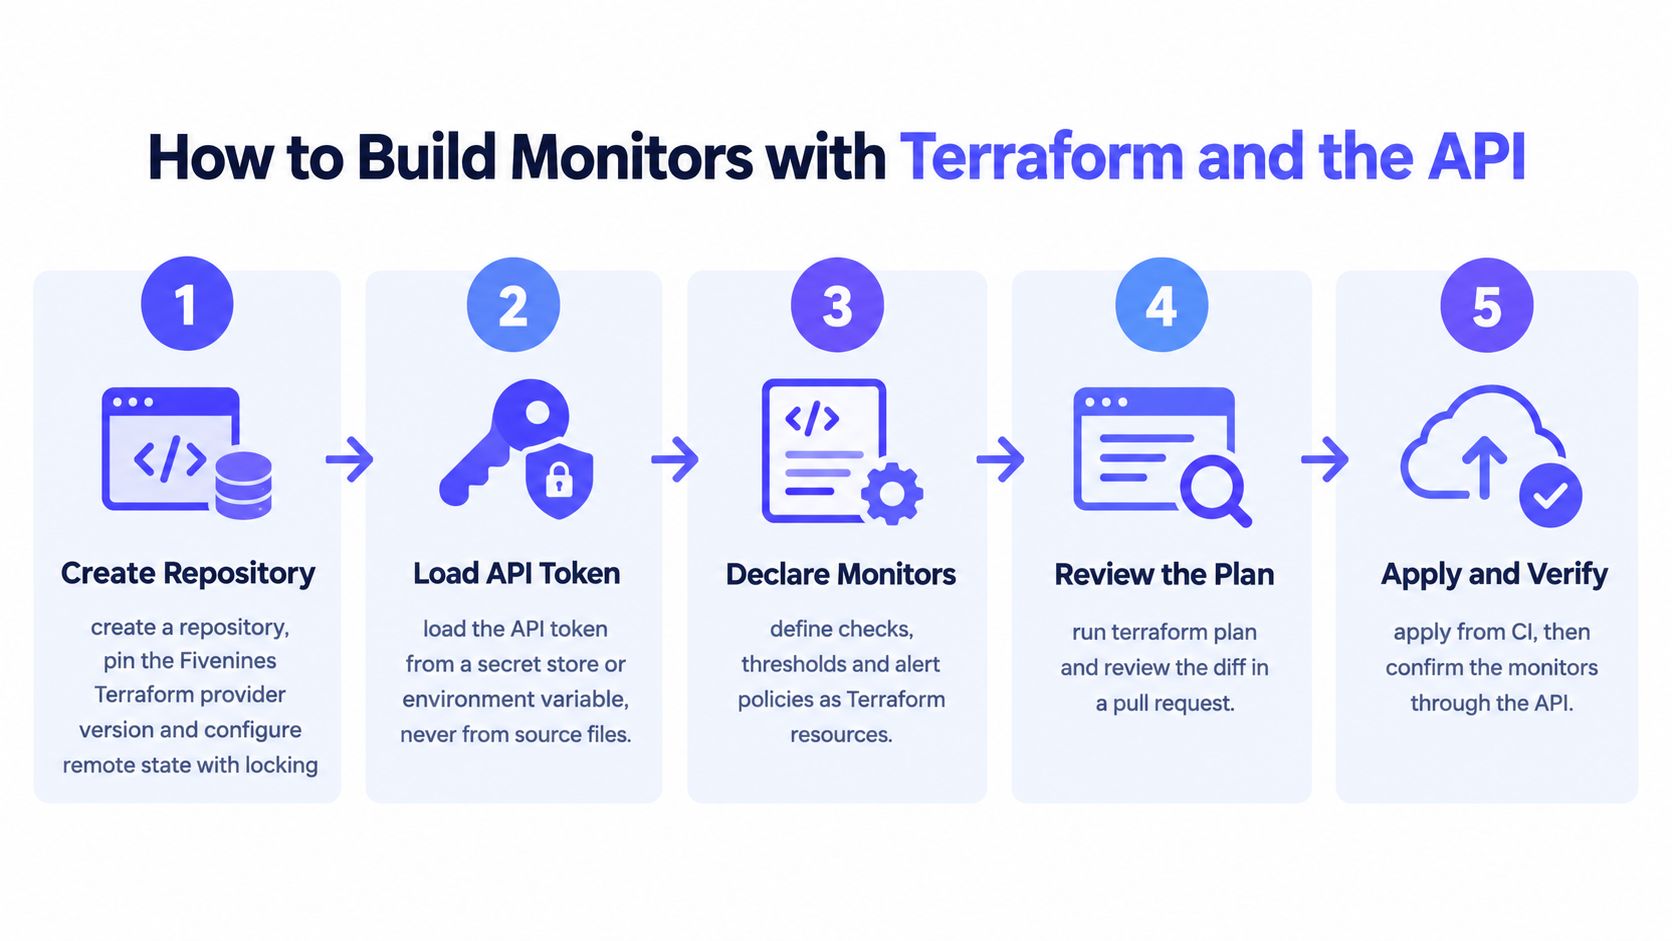
The workflow below separates declaration, review, deployment, and verification.
Establish the deployment boundary
Create the repository and state backend. Pin the selected provider version, commit the dependency lock file, and configure a remote backend with supported locking. Keep production state and permissions separate from staging.
Inject authentication. Load the API token using the provider's documented environment variable or secret-store integration. Avoid committing credentials in variable files, backend configuration, or generated plan artifacts.
Define the input contract. Include name, check type, target, interval, probe regions, confirmation count, and all required quality metadata. Validate supported HTTPS, TCP, ICMP, and DNS types before mapping inputs to resources.
An illustrative record could identify checkout-https, use HTTPS, reference a checkout target variable, select configured probe regions, and assign payments-team as owner with high severity. It should also contain the runbook reference, impact statement, grouping policy, escalation reference, and explicit maintenance policy.
Plan, apply, and reconcile
Map records to documented resources. Use
for_eachwith stable keys, filtering records by monitor type where the provider uses separate resources. Renaming a key can change Terraform's resource address, so use supported state-move mechanisms for intentional refactoring.Run the review commands. Execute
terraform init,terraform validate, andterraform plan, then attach a redacted plan summary to the pull request. Save the approved plan securely when the deployment process supports applying that exact artifact.Deploy to staging. Use non-production targets and test notification destinations. The Terraform infrastructure automation guide provides broader context for structuring the infrastructure workflow.
Verify through the API. Call the documented list endpoint with its specified bearer-token authentication and follow pagination. Compare returned monitor identities, types, and routing against the expected definitions; a matching count alone can conceal the wrong objects.
Import existing monitors before creation. Declare their configuration, then use
terraform importwith documented resource identifiers. Review the resulting plan until it contains only intentional changes.Promote and schedule drift detection. Apply after approval, then run a nightly
terraform plan -detailed-exitcode. Treat the documented changed-plan result as an investigation trigger, distinguish it from execution failure, and avoid automatically applying unexplained differences.
The accompanying video provides another view of the implementation workflow.
Typical failures include duplicate display names, omitted confirmation settings that inherit unexpected defaults, and emergency UI edits overwritten by the next apply. Establish an emergency-change procedure that requires reconciliation into configuration before routine deployment resumes.
Testing and Validating Monitors in CI/CD
A passing plan doesn't prove an alert works. It shows proposed changes against Terraform's model, not whether a failed service produces a useful notification.
CI/CD needs to test both configuration and behavior. The GitOps workflow explanation helps frame the desired-state approach, but alert delivery still requires an end-to-end exercise.
CI/CD stages that validate monitors
| Stage | What runs | Blocks the merge when |
|---|---|---|
| Format and lint | terraform fmt -check and tflint with configured rules |
Formatting or enabled lint checks fail |
| Metadata validation | Schema checks for every required quality field | Fields are missing, empty, or invalid |
| Plan review | A redacted plan summary posted to the pull request | Unapproved deletions or replacements appear |
| Staging apply and API check | Apply, then compare API results with expected monitors | Counts, identities, or relevant settings differ |
| Synthetic alert test | Canary fails intentionally, then recovers; verify test-channel delivery | Alert or recovery misses its defined window |
| Production apply and drift check | Approved apply followed by scheduled plans | Deployment fails or subsequent drift requires investigation |
The later stages gate release rather than retroactively blocking a merged pull request. Branch protection should require static checks; deployment environments should enforce staging tests and production approval.
Exercise the decision, not just the endpoint
The synthetic test should use an isolated canary endpoint with controlled healthy and failing behavior. Record when failure begins, when the monitor changes state, and when the notification arrives. Restore the endpoint and verify recovery notification, incident closure, and suppression reset.
Define the expected window from the configured interval, confirmation logic, processing delay, and delivery allowance. An arbitrary timeout makes tests flaky and can hide a configuration that cannot meet the service's response needs.
Failure-mode fixtures should cover:
- Delayed telemetry: Missing samples must follow an explicit missing-data policy rather than becoming healthy by default.
- Regional disagreement: A failed probe location must produce the intended local or service-wide decision.
- Deployment transients: Brief, expected disruption should respect confirmation and maintenance behavior.
- Retired destinations: Routing validation should detect inaccessible channels or rejected webhook delivery.
Release gate: A notification accepted by a vendor isn't the same as a notification received by the response team.
GitHub Actions or GitLab CI can run formatting, schema checks, and planning on pull requests. Run behavioral tests after protected merges in staging, using dedicated test routes so routine validation doesn't page production responders.
Keep test results with the deployment record. A monitor change should carry evidence of its behavior, not merely a green Terraform command.
How to Migrate from Legacy Monitoring
Migration should use small, reversible cutovers rather than a simultaneous replacement. Keep the existing paging authority until the replacement has demonstrated equivalent coverage.
Inventory and translation
Export the existing configuration. Collect Prometheus rules, Alertmanager routes and receivers, UptimeRobot monitors, healthchecks.io checks, and Zabbix triggers and templates. Include dependencies and suppression rules, not just thresholds.
Classify each item. Mark definitions keep, merge, or retire. Check whether their targets still exist and whether responders still use their output.
Translate semantics explicitly. Map HTTP checks to uptime definitions and Alertmanager grouping to the destination system's incident model. Preserve missing-data behavior, confirmation, and recovery logic rather than translating syntax alone.
Parallel operation and cutover
Run the replacement in shadow mode. Send replacement notifications to a non-paging channel while the legacy system remains authoritative. Choose a comparison period that includes normal deployment and operating patterns.
Investigate differences. Compare incident identity, detection timing, recovery, and grouping. Matching totals don't establish equivalent coverage.
Move notification authority gradually. Begin with lower-severity routes and retain a documented rollback. Avoid leaving both systems responsible for paging the same failure.
Decommission deliberately. Require an on-call rotation without unexplained gaps before removing legacy components. Archive exports and retain any infrastructure still needed for unrelated telemetry.
The monitoring strategy guide can help define which layers need replacement. Prometheus can remain responsible for application metrics while server, uptime, or cron checks move elsewhere; migration doesn't require removing useful instrumentation.
Choose Your Starting Point for Teams and MSPs
Start with the smallest monitor set that protects a revenue-critical service. Expand only after the first alert has passed its delivery and recovery tests.
Match the implementation to the operating model
- Solo operators and homelabs: Codify important uptime and cron checks without introducing a module framework prematurely. A readable repository is more useful than an elaborate abstraction nobody maintains.
- SaaS DevOps and SRE teams: Use service-type modules and protected deployment pipelines. Let service owners review impact and runbook changes while platform engineers maintain shared resource behavior.
- MSPs: Keep client state, credentials, and routing separate. Validate tenant identity during planning so a shared module can't silently attach a client's monitors to another client's destinations.
- Hosting providers: Group server policies by fleet role and operational tier. Push-agent collection can avoid inbound access, but rollout controls still need to limit fleet-wide mistakes.
- Legacy-stack migrations: Preserve working coverage while replacing selected layers. Reconcile behavioral differences before transferring paging responsibility.
Select tools for the actual scope
Prometheus rules, OpenTelemetry configuration, and vendor Terraform providers address different parts of the monitoring stack. Fivenines is an option when teams want server, uptime, and cron monitoring in a shared dashboard with a Terraform provider and public REST API.
The next action should be concrete: codify a critical check, apply it to staging, and run the synthetic failure-and-recovery test this week.
Fivenines offers server, uptime, and cron monitoring with Terraform and REST API automation. Teams can visit Fivenines to evaluate that workflow against a staging service, including ownership metadata, notification routing, and an end-to-end alert test.