What Is Synthetic Monitoring and How It Works

Synthetic monitoring is a method that sends scripted probes on a fixed schedule to test whether websites, applications, APIs, and services are available and completing expected transactions. A controlled browser journey can reveal a change from 1.2 seconds to 3.0 seconds after a release, even before a real customer reports a problem.
A SaaS team can have a quiet Saturday morning while its checkout API returns errors. Traffic is low, the support inbox is empty, and no dashboard shows an obvious infrastructure failure. Forty minutes later, someone notices that customers couldn't complete purchases, but the first warning came from a person rather than the monitoring system.
That situation gets to the heart of what is synthetic monitoring. It uses scripted probes to test availability and transactions on a fixed schedule, whether real users are currently active or not. A probe can request a URL, call an API, resolve a domain, open a page in a browser, or reproduce a multi-step journey such as signing in and checking out.
The important distinction is that a monitor runs automatically. Synthetic monitoring creates controlled, repeatable observations. The same request or script can run from selected locations, record whether it succeeded, measure latency, and compare results over time. Google Cloud's documentation on synthetic monitors describes this approach as periodic simulated requests that test availability, consistency, and performance.
The technology also has a boundary. A green synthetic check proves that a chosen path worked under chosen conditions. It doesn't prove that every customer, device, browser, network, or region had a successful experience. Understanding that boundary prevents teams from treating synthetic monitoring as either a magic early-warning system or a basic ping with a more impressive name.
Table of Contents
- A Quiet Outage and the Question Synthetic Monitoring Answers
- How a Synthetic Probe Actually Works
- The Main Check Types and What Each One Proves
- Synthetic Monitoring vs Real-User Monitoring
- Implementing Synthetic Monitoring with Multi-Region Checks and Alerts
- Common Pitfalls and How to Avoid Them
- Putting Synthetic Monitoring to Work in Your Stack
A Quiet Outage and the Question Synthetic Monitoring Answers
A useful starting question is simple: does the critical path work when nobody is clicking?
An availability check might request the checkout endpoint and verify an expected response. A stronger transaction monitor might load the login page, submit test credentials, call a payment-related API, and confirm that the resulting page contains the expected business marker. Both checks run independently of customer traffic, so a quiet period doesn't create a visibility gap.
That independence is synthetic monitoring's main operational advantage. A real user can expose a failure, but a scripted probe can test the same path before the next user arrives. It can also run against a pre-production system, where no customers are present, and act as a regression check before deployment. Web.dev's explanation of synthetic and lab data describes controlled testing as useful for pre-production workflows and continuous integration.
Practical rule: A synthetic result should be phrased as a claim about the test, not as a claim about every user.
For example, “the checkout script completed from this location” is defensible. “Customers are fine” is not, unless field data supports it. This wording may seem cautious, but it makes incident discussions much clearer. Engineers know what failed, what was tested, and what remains unknown.
The rest of the subject follows that distinction. Probe anatomy explains how a result becomes repeatable. Check types show which user-experience claim each test can support. The comparison with real-user monitoring clarifies the missing population data, while multi-region alerting turns individual observations into an operational process. The final test is whether a monitor helps a team act on a real service risk instead of adding another green tile to a dashboard.
How a Synthetic Probe Actually Works
A synthetic probe resembles a scheduled actor with a script and a checklist. It starts from a defined place, runs at a defined time, sends a defined request, and checks the response against a defined expectation.
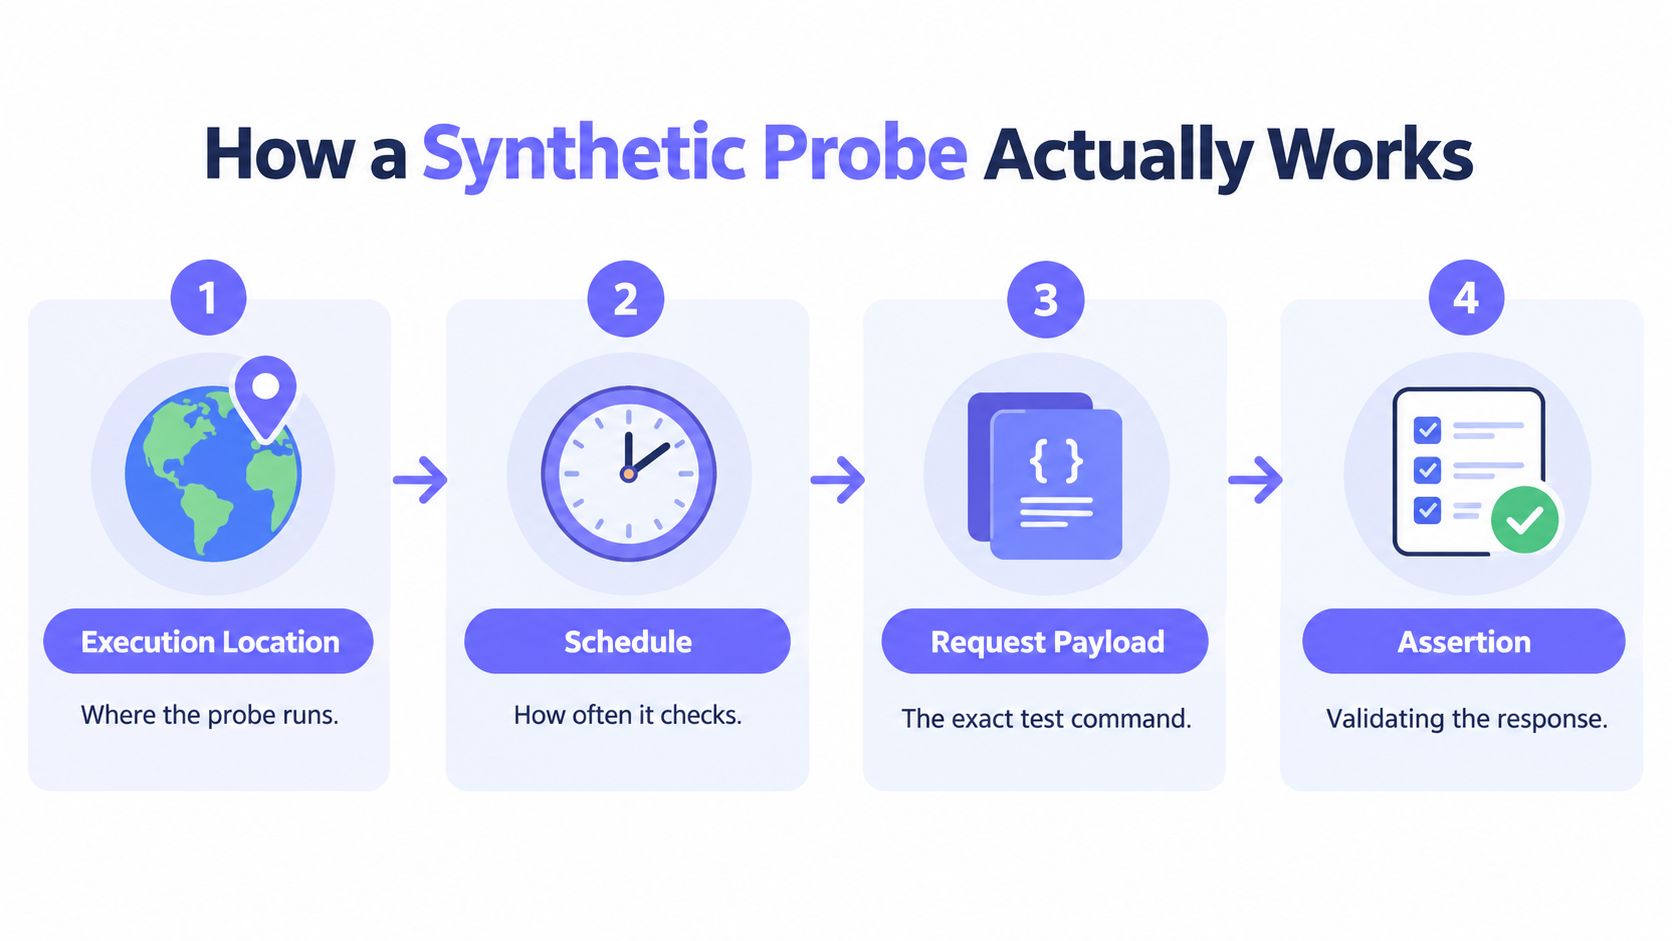
1. Execution location
The location is part of the measurement, not a decorative setting. A probe running near an application's infrastructure may show that the application responds from that network path. A probe in another region can expose slower routing, a regional DNS problem, a CDN issue, or a failure that affects only customers connecting from that area.
A fixed location also makes comparisons meaningful. If the same script runs from the same kind of environment, a change in response time is easier to investigate than a change observed across constantly shifting clients.
2. Schedule
The schedule determines how often the service receives a controlled check. A fixed cadence produces a time series rather than a one-off observation. That series can reveal a hard outage, a recurring failure, or a gradual performance regression.
The cadence should follow the service's objectives and failure budget. A low-risk informational page may need less frequent checking than a login or payment path. Retrying every failure immediately can create noise, so confirmation rules should distinguish a transient network blip from a repeatable failure.
3. Request payload
The payload is the exact work performed by the probe. It might be a simple HTTP request, a TCP connection attempt, an API request with test data, or a browser script containing several interactions. A command run manually from a laptop can help troubleshoot, but it doesn't provide the same controlled schedule and location history. Teams that need to understand the lower-level distinction can review this guide to testing a TCP port.
A browser journey can record navigation timing, resource availability, JavaScript failures, and step duration. Standardized browser timing made it possible to separate stages such as redirects, DNS lookup, connection setup, and server response instead of reducing the experience to one page-load value, as described in the W3C Navigation Timing specification.
4. Assertion
An assertion states what counts as success. The probe may require a successful status, expected content, a valid authenticated response, or completion of a business step. Without an assertion, a server can return an error page successfully at the network level and still be recorded as healthy.
The resulting measurement supports two narrow but useful claims: this path is reachable, and this path behaved as expected under these conditions. It doesn't support a broader claim about every customer unless other telemetry confirms it.
The video below provides another visual introduction to the probe lifecycle.
The Main Check Types and What Each One Proves
The right check depends on the claim an operator needs to make. A network-level test can show reachability, but it can't prove that a customer can complete checkout. A browser test can validate that journey, but it introduces more script maintenance than a simple endpoint check.
| Check type | What it proves | Limitation to know |
|---|---|---|
| HTTP or HTTPS | A web entry point responds and can satisfy the configured response assertion | It doesn't prove that the full page renders correctly or that a multi-step journey works |
| TCP | A service accepts connections on the tested port | It doesn't prove that the application protocol returns correct content |
| ICMP | A host or network destination is reachable through the tested network path | It doesn't prove that the relevant application is available or that ICMP is permitted |
| DNS | A name resolves according to the configured expectation | It doesn't prove that the resolved service responds correctly afterward |
| Scripted browser flow | A selected user journey completes in the tested browser and environment | It doesn't cover untested devices, browsers, paths, or customer data |
| API transaction | A backend endpoint or sequence of API calls returns the expected contract and data | It doesn't prove that the front-end presents the result correctly |
Entry-point checks
An HTTP or HTTPS check is often the simplest useful monitor for a public web service. It can establish that an endpoint responds, that the response meets a status or content expectation, and that response time remains within an agreed boundary. An HTTPS check may also include certificate-related validation where the monitoring system supports it.
A TCP check makes a narrower statement. It shows that a connection can be accepted, which helps isolate a listener, firewall, or service-availability problem. A successful connection doesn't mean the application will authenticate a user or return valid content.
ICMP is narrower still. It can show network reachability to a host that permits the protocol, but an application may remain broken while the host answers. The reverse can also occur when a healthy service or firewall blocks ICMP.
Name resolution checks
A DNS check tests whether a service name resolves as expected. It can identify a resolution failure or an unexpected record result before an HTTP request ever reaches the application. A DNS success doesn't prove that the destination is serving the right page, accepting authentication, or completing a transaction. Teams working specifically on this layer can use a DNS health check guide to separate name resolution from application availability.
Journey and contract checks
A scripted browser flow is appropriate when the journey itself is the risk. A login, search, form submission, or checkout can succeed at the API layer while a broken selector, JavaScript error, or rendering problem prevents the browser user from completing it. The trade-off is maintenance. UI changes can invalidate brittle selectors, so scripts need ownership and regular review.
An API transaction sits between a basic endpoint test and a full browser journey. It can verify authentication, dependent calls, response fields, and business rules without the overhead of rendering a page. The decision rule is straightforward: choose the simplest check that proves the required claim, then escalate to a browser script only when the user journey is what needs protection.
Synthetic Monitoring vs Real-User Monitoring
A synthetic check can report that a login works from a selected location at a scheduled time. It cannot show whether every customer can log in. Synthetic monitoring and real-user monitoring answer different questions because their signals come from different sources.
| Dimension | Synthetic Monitoring | Real-User Monitoring |
|---|---|---|
| What it measures | A controlled request, transaction, or scripted journey | Actual sessions and interactions |
| Who generates the signal | A scheduled probe from selected environments | Customers using real devices, browsers, networks, and locations |
| What it can credibly prove | A selected path is available and behaves within defined conditions | How the service behaves across observed users and cohorts |
| Best operational use | Early warning, regression detection, critical-path checks, and controlled comparisons | Field experience, cohort analysis, device variation, and user outcomes |
| Main blind spot | Conditions and paths that the script does not represent | Quiet periods or pre-release environments with no real traffic |
A synthetic test can catch an outage during a quiet period because it does not wait for a customer session. It can also run before launch and repeat the same script across controlled environments. That makes it useful for detecting release-related changes with clearer causal context.
RUM sees a broader and messier reality. A customer may use an older browser, a mobile network, an accessibility configuration, or a regional provider that the synthetic fleet never tests. A desktop browser script may pass while a layout breaks for an untested device class. RUM can also connect observed behavior with cohorts and business outcomes that a synthetic transaction cannot represent. For the field-data side of this comparison, see an introduction to real-user monitoring.
Treat a synthetic monitor as an auditable sample of intended behavior; it never substitutes for the census that field data provides.
The distinction matters when interpreting performance. Controlled lab results help detect regressions, but they should not be treated as population-wide user percentiles. Core Web Vitals are intended to represent user experience measured across real sessions, so synthetic data and RUM work best as complementary signals.
A practical operating model gives each method a defined job. Synthetic checks protect critical paths and service objectives under known conditions. RUM exposes the long tail of device, network, location, and cohort behavior. When both systems report a problem, comparing them helps establish whether the failure is broad, regional, device-specific, or limited to the scripted path.
Implementing Synthetic Monitoring with Multi-Region Checks and Alerts
A useful rollout starts with service risk, not with the monitoring tool. The team first identifies the paths whose failure would matter most, then chooses tests and locations that can support precise claims about those paths.
Select locations that reflect the service
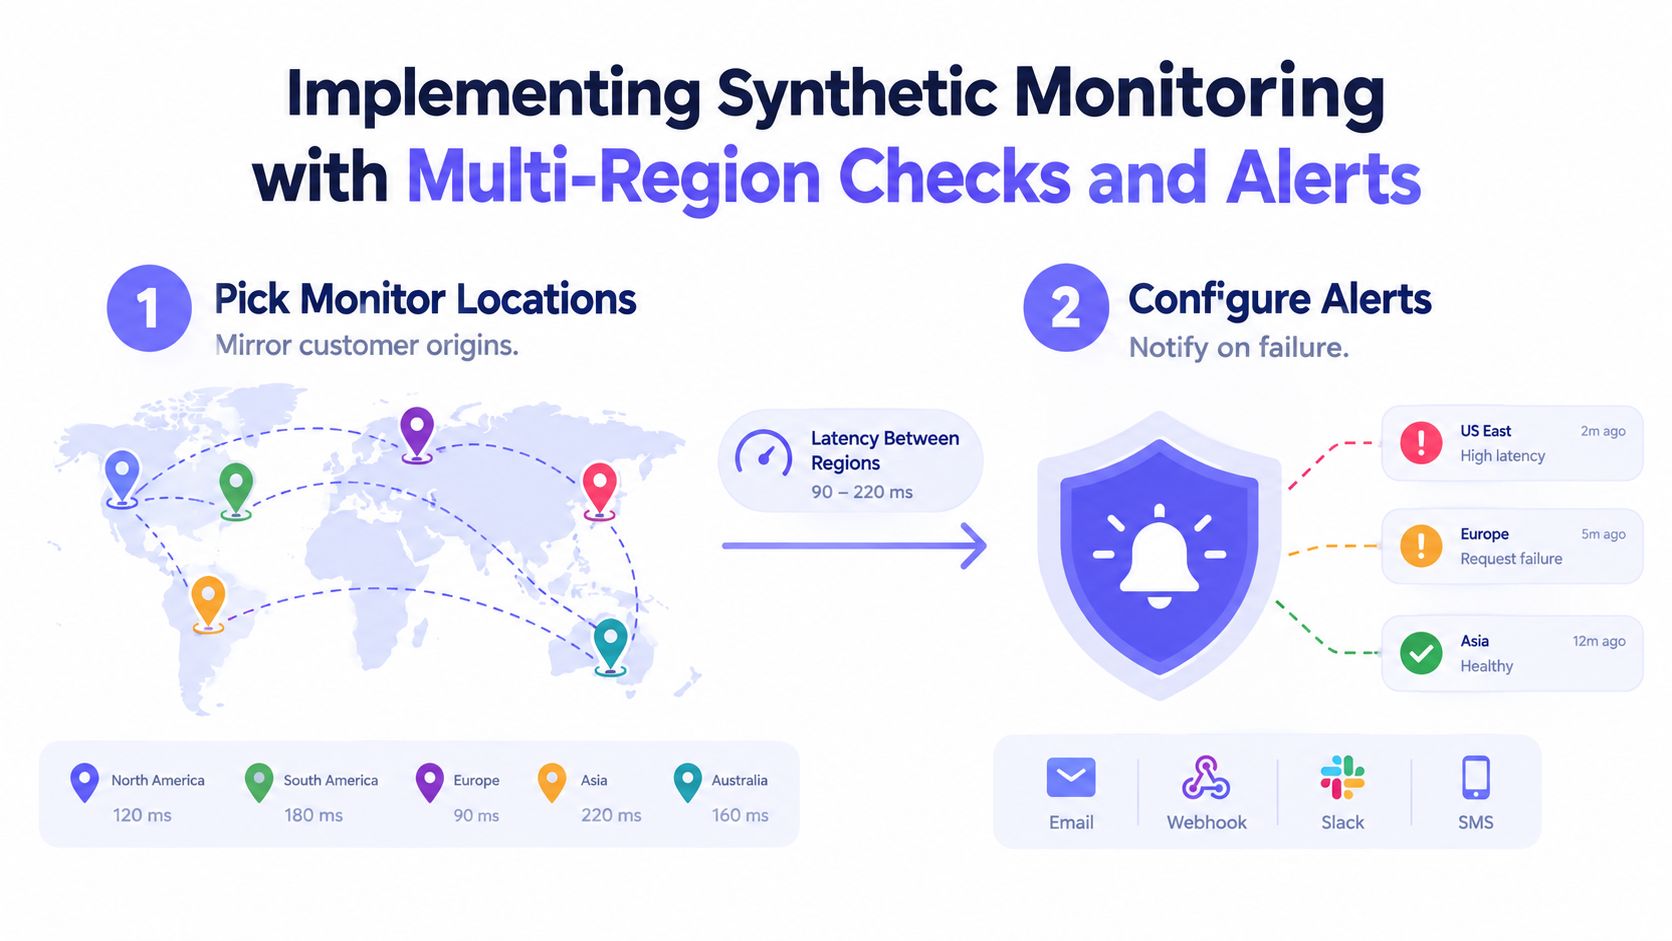
Monitor locations should mirror customer origins and network reality. A location near primary infrastructure can show whether the service works close to its hosting environment. A distant location can expose routing, backbone, CDN, or regional resolution problems that the nearby probe won't see.
The location set should also include the regions that matter operationally, not just the regions that are convenient for the engineering team. A fixed probe fleet is still a sample, so operators should record exactly which regions and environments a result represents.
Establish normal behavior
A baseline gives thresholds meaning. Teams should collect successful runs under normal conditions and examine availability, response time, transaction duration, step-level latency, network errors, and assertion failures. A single average can hide a slow step or a regional problem, so each important stage deserves its own view.
The baseline period should include ordinary variation before thresholds become strict. If the threshold is chosen before normal behavior is understood, the monitor may page on expected fluctuation or fail to report a meaningful degradation.
Confirm failures before paging
A single failed probe is an observation, not necessarily an incident. The failure could come from a temporary network interruption, a provider issue, or a brittle test. Confirmation rules can rerun the check and require consistent evidence before escalation.
Multi-region confirmation adds another useful distinction. A failure in one region may indicate a local path problem. Similar failures across regions are stronger evidence of an application or shared dependency issue. The rule should match the service's risk, because a payment path may deserve faster escalation than a low-priority informational page.
Route alerts to ownership
Alerts should enter the system where the responsible team works. That may be a paging channel, ticketing system, chat integration, or incident platform. Each alert should identify the monitor, location, failed step, observed response, and relevant history instead of sending only a generic “down” message.
Severity should follow user impact. A failed checkout transaction belongs with the team that owns checkout or its dependency chain. A failed status endpoint may have a different escalation path. Teams evaluating broader infrastructure coverage can compare this workflow with AWS site monitoring guidance.
Keep history long enough to see drift
Hard outages are easy to notice. Slow regressions are not. Retained probe history lets teams compare response time, success rate, and failed steps across releases, locations, and time periods. It also creates evidence for service-level discussions, provided the team records the test conditions and avoids presenting the sample as a complete account of user experience.
Common Pitfalls and How to Avoid Them
Synthetic monitoring fails most often when teams confuse convenience with coverage. A monitor can run reliably and still observe the wrong thing.
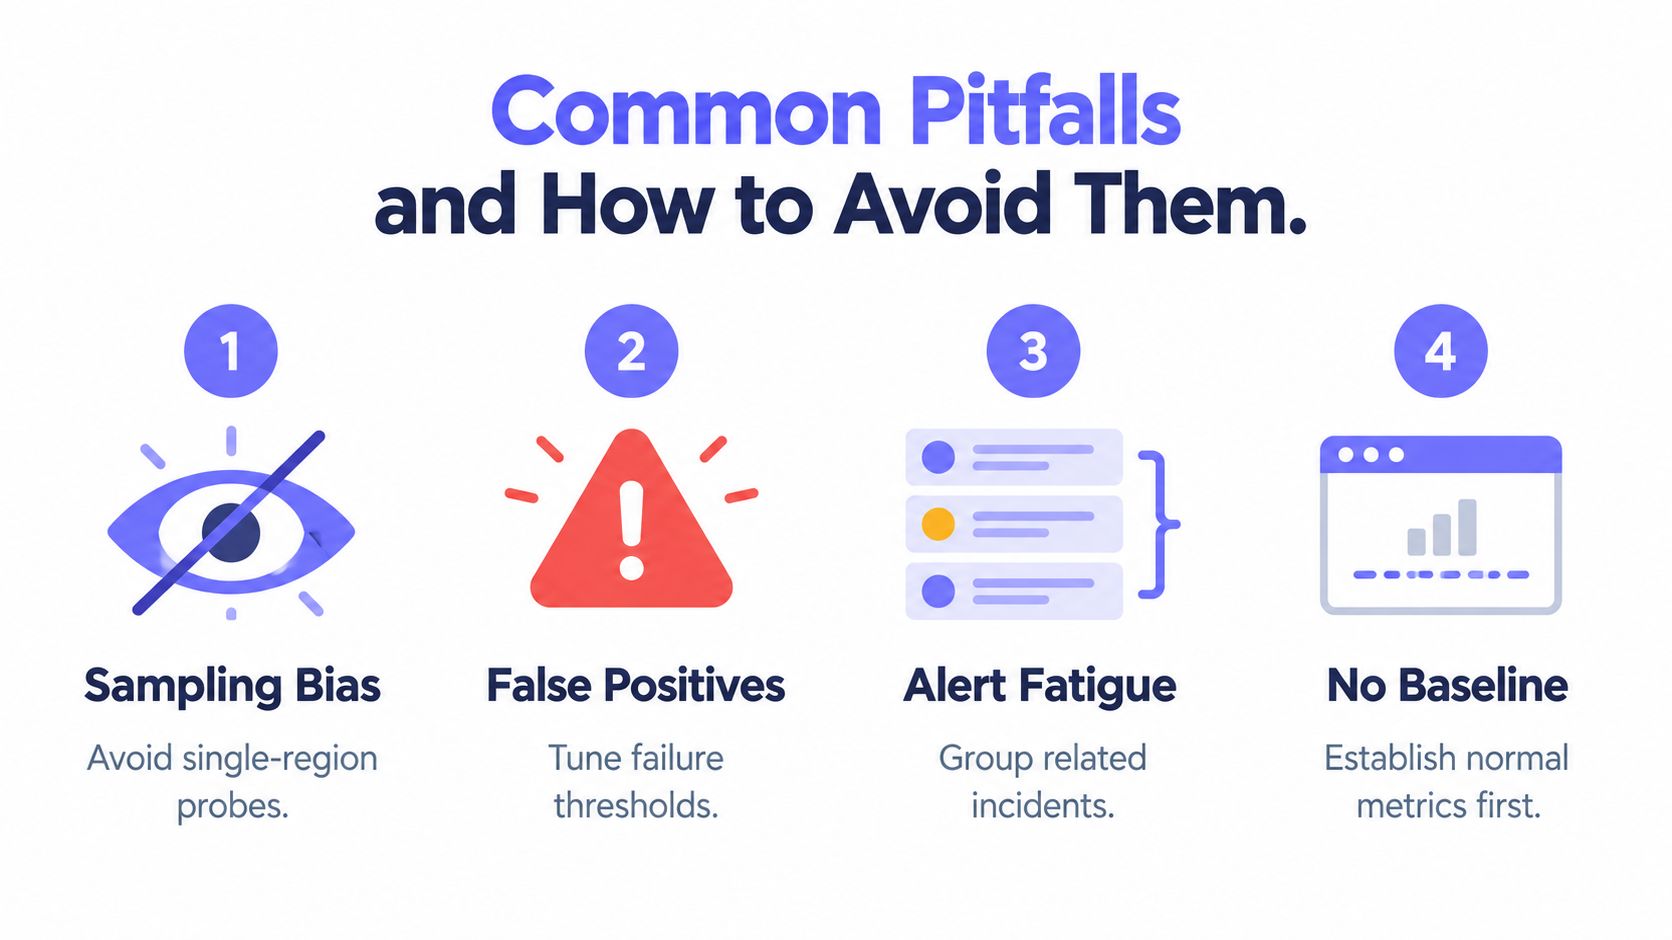
Sampling bias
Probes that all run from the same cloud region as the application may report excellent results while customers in another region face routing or CDN problems. The correction is to choose locations based on customer origins, infrastructure boundaries, and known dependency paths. A monitor should state which location it represents rather than implying global coverage.
Flaky scripts
A transaction that fails intermittently may have brittle selectors, expiring credentials, shared test data, or an assertion that depends on changing content. The correction is to give the test a stable identity, reset its data deliberately, and capture step-level evidence. A script that pages repeatedly for reasons unrelated to customer impact will lose credibility with the on-call team.
Alert storms
Paging on every failed check creates multiple alerts for one underlying incident. Group related failures by service, use confirmation rules, and include location context so operators can distinguish a shared outage from a regional issue. The alert should help an engineer decide what to do next, not force that engineer to reconcile a pile of duplicate notifications.
No baseline
A threshold without a baseline is an opinion disguised as a policy. Teams need a record of normal response times, transaction duration, and expected content before they can identify meaningful deviation. The absence of a baseline also makes slow deterioration difficult to separate from ordinary variation.
Audit habit: Each week, operators should ask which monitors caught a confirmed incident, which exposed a useful regression, and which produced noise. The answers should change scripts, thresholds, locations, or ownership.
A final mistake deserves special attention: treating a green dashboard as proof that users are succeeding. It proves only that the configured paths worked under the configured conditions. RUM, support evidence, conversion data, and regional investigation remain necessary when the question concerns the wider customer population.
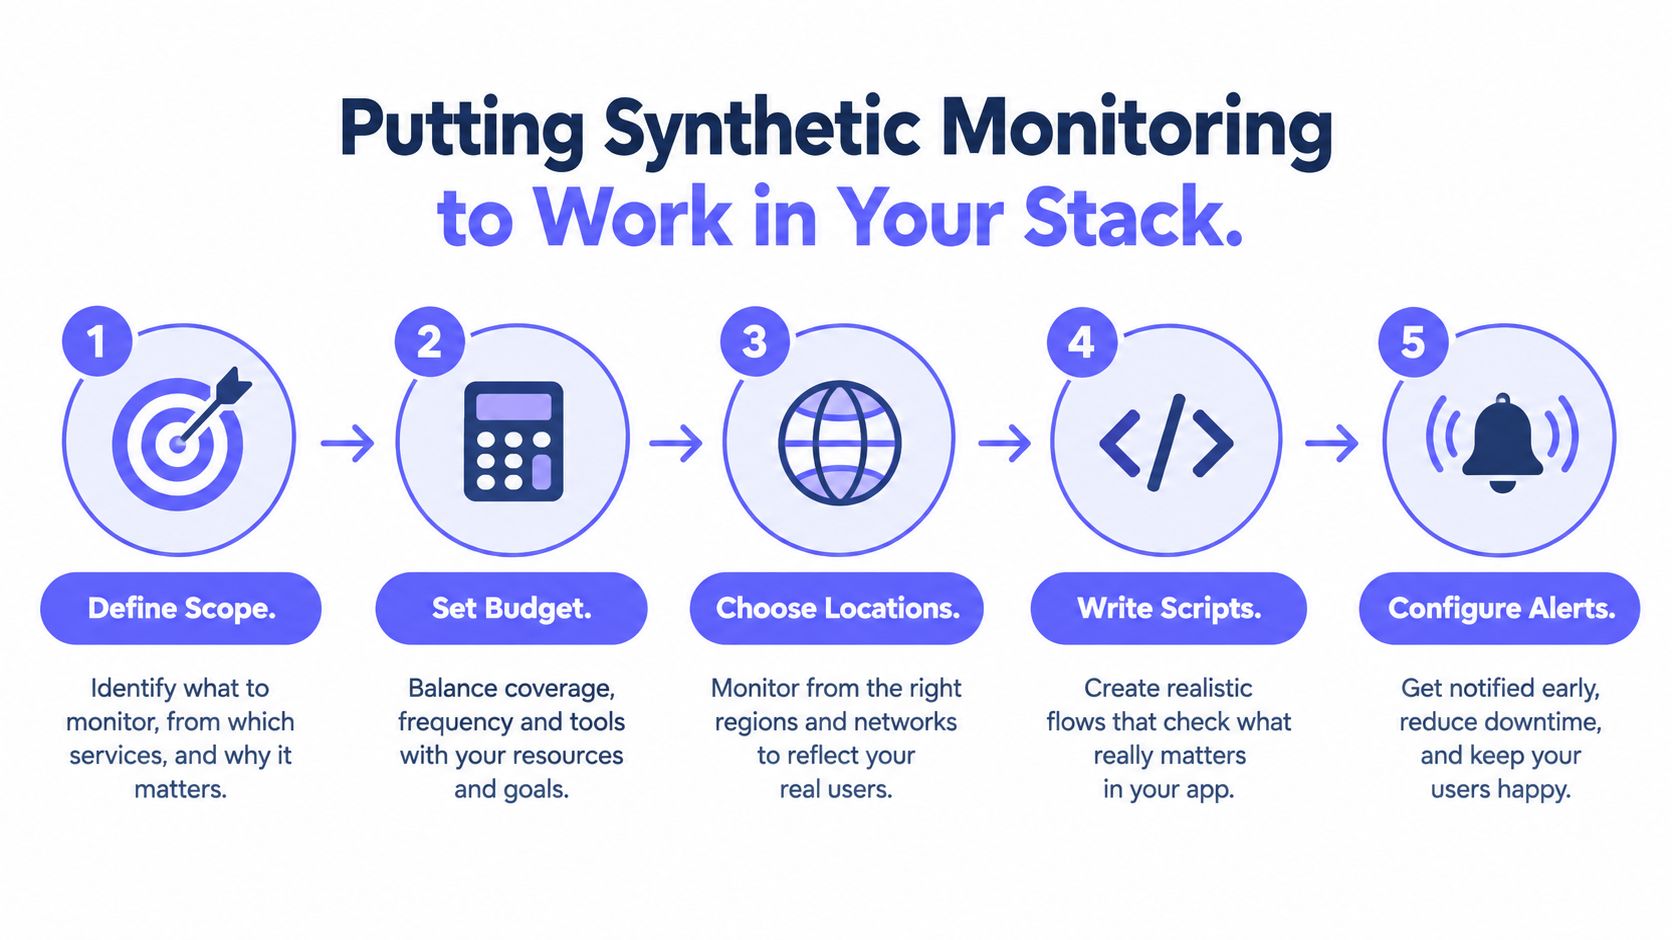
Putting Synthetic Monitoring to Work in Your Stack
A checkout monitor can report success while customers still fail because of an untested payment method, browser, or region. Start by writing the exact claim the check should support. “The service is healthy” says too little. “The checkout API accepts the expected transaction from the selected locations” gives the monitor a testable condition and makes its result useful during an incident.
A small implementation can establish that boundary:
- Define scope: Choose one revenue-critical flow and one availability or status endpoint.
- Cover two layers: Use an HTTP check for the entry point, then a scripted browser or API transaction for the chosen flow.
- Use representative locations: Select regions that reflect customer origins and infrastructure boundaries.
- Create a baseline: Record normal latency, successful steps, failed steps, and regional differences before tightening thresholds.
- Connect response: Send confirmed failures to the owning on-call channel, then review incidents and monitor noise regularly.
Each check supports a specific user-experience claim. An endpoint check can show that a service answered from a location. A browser journey can show that the selected steps completed. An API transaction can show that the expected request and response worked. None of these proves that every customer succeeded, so compare the results with RUM, support reports, conversion data, and regional investigation.
Treat the monitor as a living audit of intended behavior. Review the exact claim, location, request, assertion, owner, and escalation rule after the first failures, using the same discipline applied to production incidents.
Teams can use Fivenines for multi-region HTTPS, TCP, ICMP, and DNS endpoint checks, failure confirmation, response-time and availability tracking, and routing through Slack, Microsoft Teams, email, SMS, or webhooks. Visit Fivenines to connect an uptime check to the service that needs earlier failure visibility. A browser journey or API transaction may require a specialized testing system.