10 Monitoring Best Practices for Reliable Operations

A dashboard full of CPU, memory, and disk graphs can still miss the outage that matters. Monitoring isn't observability just because it contains more metrics. A service can look healthy at host level while customers face failed payments, a regional API timeout, a stalled background job, or a status page that says nothing useful.
Reliable monitoring starts with the user-facing service and then connects availability to workload, network, platform, and operational signals. The Site Reliability Engineering monitoring framework identifies latency, traffic, errors, and saturation as the four golden signals, while also emphasizing simple, predictable, reliable rules for catching real incidents. That principle turns monitoring into an operating system for reliability rather than a collection of disconnected dashboards.
The checklist below covers multi-region checks, monitoring as code, per-container telemetry, escalation, scheduled jobs, specialized hardware, Proxmox, network devices, public communication, and anomaly detection. It also addresses the operational problems that dashboards alone won't solve, including false positives, silent failures, tenant isolation, fragmented tools, and migration from Prometheus, Grafana, Alertmanager, UptimeRobot, or healthchecks.io without losing context.
Table of Contents
- 1. Multi-Region Health Checks with Failure Confirmation
- 2. Infrastructure as Code for Monitoring Configuration
- 3. Per-Container and Per-Process Granularity Monitoring
- 4. Intelligent Alert Routing and Escalation Workflows
- 5. Cron Job and Background Task Monitoring
- 6. GPU and Specialized Hardware Resource Monitoring
- 7. Proxmox and Hypervisor-Level Infrastructure Monitoring
- 8. Network Device and Link Health Monitoring
- 9. White-Label Status Pages and External Transparency
- 10. Metric Baseline Establishment and Anomaly Detection
- 10-Point Monitoring Best Practices Comparison
- Turn the Checklist Into an Operating Standard
1. Multi-Region Health Checks with Failure Confirmation
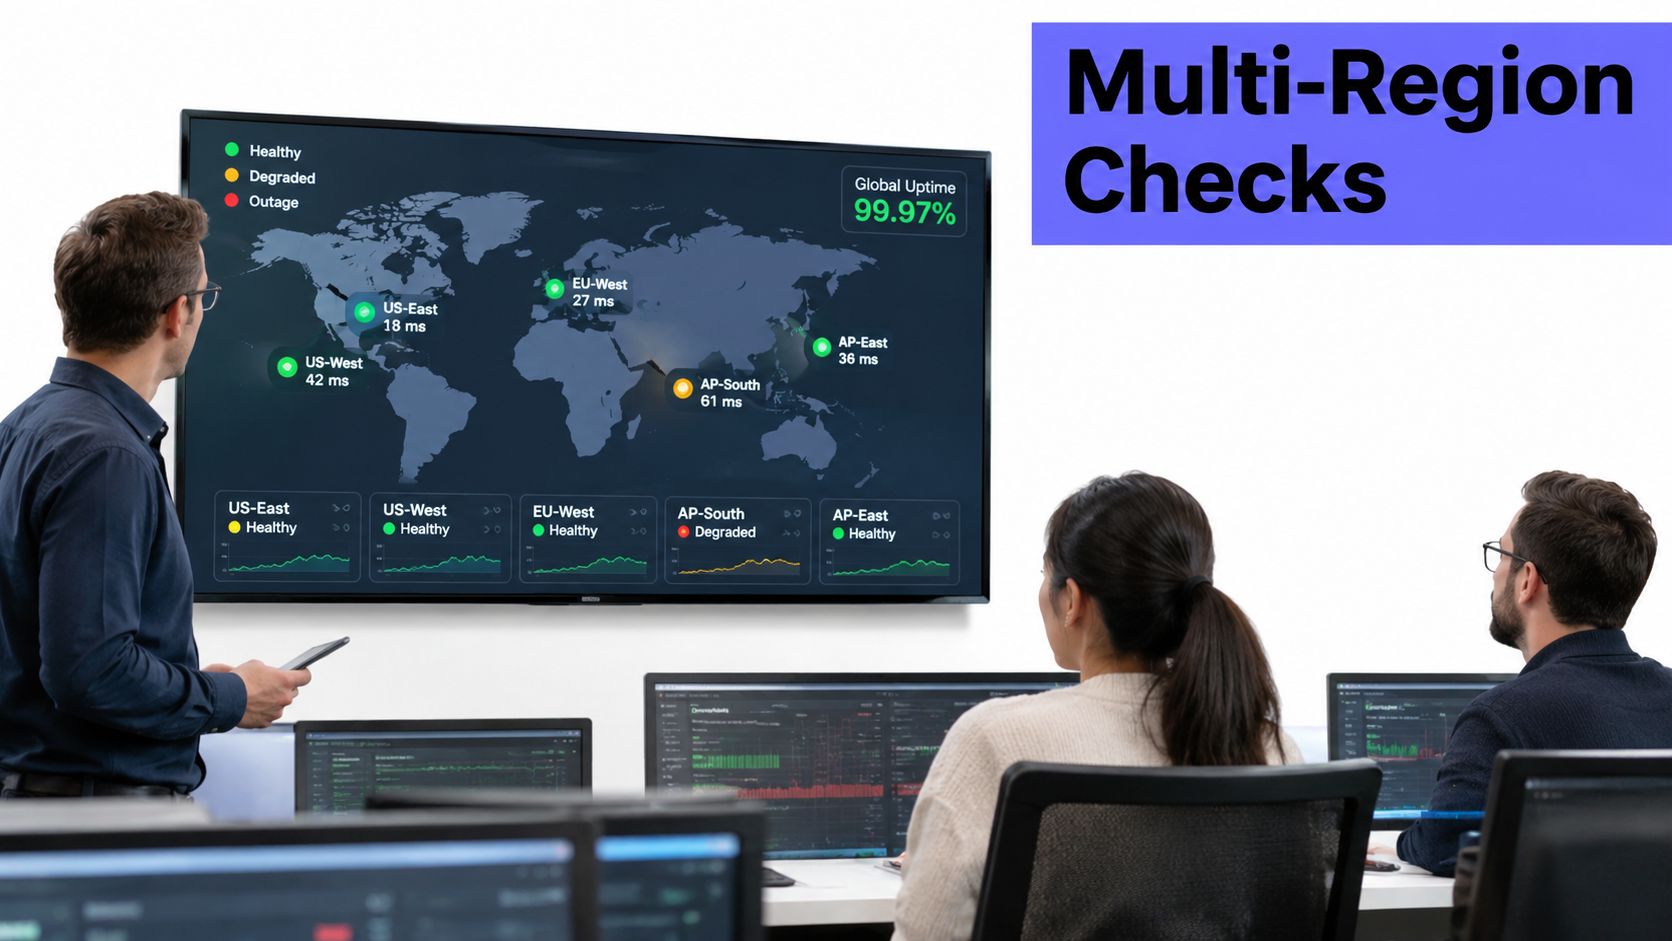
A single probe can prove that one monitoring location can't reach a service. It can't always prove that customers are experiencing a global outage. Routing faults, local DNS problems, transient network congestion, and regional provider incidents can create false alarms when a critical endpoint is checked from only one place.
Multi-region health checks create a more reliable view of availability. A SaaS team should select probe locations that reflect its customer distribution, then require consistent failure evidence across multiple locations before paging the primary responder. The exact confirmation policy should reflect the service objective. A global API may need broader geographic confirmation than an internal administrative endpoint.
Practical rule: A page should represent a condition that requires human action, not merely a failed observation.
Checks should cover both the public path and the service's own health path. An HTTPS request can verify routing, TLS, authentication behavior, and application response. A TCP check can expose a lower-level connectivity problem, while a backend check can confirm whether dependencies such as databases or queues remain available. Layered checks help distinguish “the website is unreachable” from “the website is reachable but a critical operation is failing.”
Teams evaluating regional endpoint monitoring can review AWS site monitoring practices when designing probe locations and failure confirmation. Check intervals should match the service's reliability objectives, but a shorter interval isn't automatically better if it creates unnecessary noise or load. Each alert should include the failed regions, observed response, affected endpoint, and confirmation status.
2. Infrastructure as Code for Monitoring Configuration
Manual monitoring configuration works until environments multiply, ownership changes, or an incident exposes an undocumented threshold. A dashboard edited in a web interface may be useful today, but it becomes difficult to reproduce, review, or migrate when nobody can explain why a monitor exists.
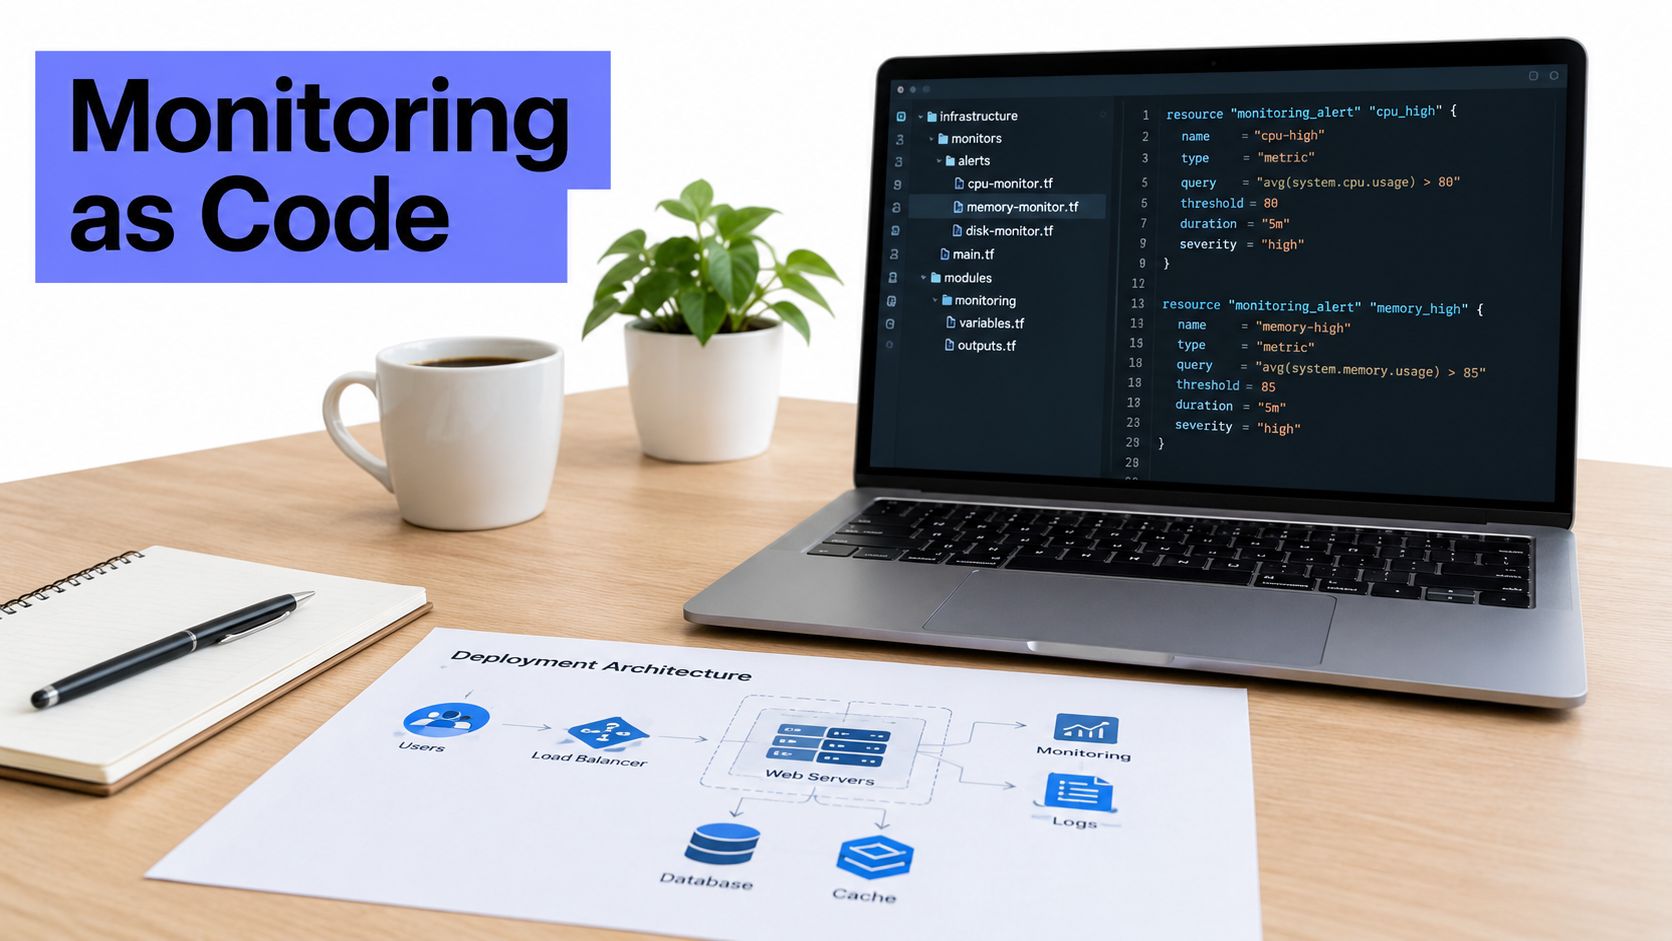
Monitoring as code applies version control, review, and repeatable deployment to dashboards, checks, alert rules, notification routes, and service metadata. Terraform modules can define common patterns for web servers, databases, cron jobs, containers, and customer environments. An MSP can then create consistent monitoring for each tenant while preserving tenant-specific endpoints, owners, escalation policies, and retention settings.
The code should distinguish environments rather than copying production settings blindly into development. Thresholds, notification channels, probe locations, and data retention may differ between development, staging, and production. Each definition should also document the signal being measured, the reason for the threshold, the owning team, and the expected response.
A useful implementation sequence includes:
- Create reusable modules: Package recurring monitor types so teams don't rebuild the same logic by hand.
- Require code review: Treat a paging change as an operational change that deserves peer review.
- Version alongside services: Keep service ownership, runbook references, and monitor definitions close to the application or infrastructure repository.
- Test the deployment path: Confirm that a failed plan, provider outage, or partial apply can't remove critical coverage.
Teams can compare implementation approaches through monitoring automation guidance before selecting provider APIs, Terraform resources, or custom deployment workflows. Code doesn't eliminate bad monitoring design, but it makes bad design visible, reversible, and repeatable.
A later stage can add dashboards and routing policies to the same delivery process. The critical requirement is that a new service should receive its minimum viable monitoring as part of provisioning, not weeks after its first production incident.
3. Per-Container and Per-Process Granularity Monitoring
Host-level CPU and memory metrics answer only part of the question. When several containers share a node, an average can conceal the service that is exhausting memory, throttling on CPU, filling a temporary filesystem, or restarting repeatedly.
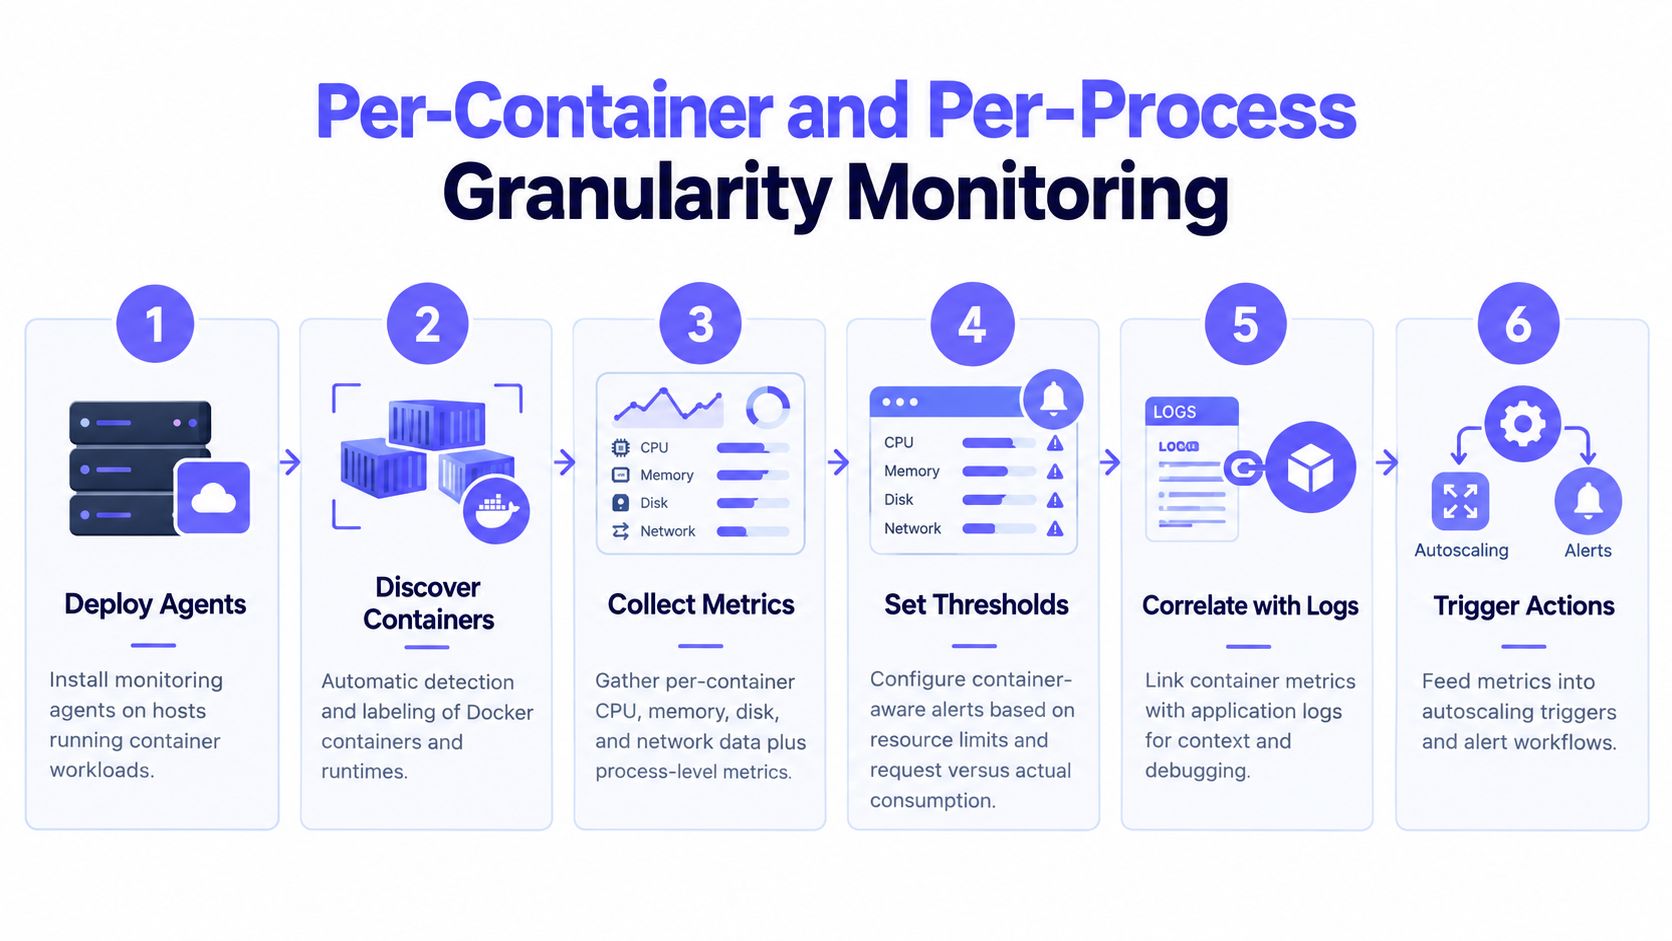
Per-container and per-process monitoring connects resource consumption to the workload responsible for it. Consistent labels should identify the service, environment, team, cluster, tenant where appropriate, and deployment version. Without stable metadata, an alert may identify a container ID that disappears before an engineer can investigate.
Resource alerts should account for both requested and actual consumption. A container using a moderate amount of host memory may still be close to its configured limit, while a workload using more than its request may create contention for neighboring services. Operators should monitor restarts, creation and destruction events, throttling, network activity, file-system use, and process-level behavior alongside application logs.
The most useful alert usually connects a symptom to a workload. “The checkout container is repeatedly restarting and its error rate is rising” gives an engineer a starting point. “Node memory is high” is a clue, but it doesn't identify ownership or customer impact.
Teams designing Kubernetes coverage can use Kubernetes monitoring tools and practices as a reference point. Container metrics should support autoscaling decisions, but autoscaling shouldn't become a substitute for diagnosis. A service that scales endlessly because of a memory leak may remain technically available while costs and latency rise.
Per-process visibility matters most when a shared host looks healthy enough to delay investigation.
For MSPs and hosting providers, workload-level telemetry also supports clearer customer boundaries. It can show which tenant's container is consuming resources without exposing another tenant's data, provided labels, dashboards, access controls, and retention policies are designed carefully.
4. Intelligent Alert Routing and Escalation Workflows
An alert sent to everyone is rarely an alert sent to the right person. Database symptoms belong with database owners, network faults with network specialists, and customer-specific infrastructure incidents with the support path responsible for that account. Routing should reflect service ownership, severity, availability, and escalation state.
A practical workflow starts with a service catalog. Every monitored component should have an owner, a fallback owner, a severity classification, a runbook, and an escalation policy. A critical service can notify the on-call engineer first, then use a progressively stronger channel if the alert isn't acknowledged. Sending every notification through Slack, SMS, email, and voice at once creates urgency without improving decision quality.
Alert content should carry enough context to support the first action. Useful fields include the affected service, tenant or region, observed condition, start time, recent deployment if available, related monitor state, and a direct runbook link. A notification that requires an engineer to search three systems for basic context is already consuming response time.
Teams can use workflow automation for monitoring operations to structure delays, retries, acknowledgments, and handoffs. Escalation schedules need regular tests because contact details, team rotations, and ownership change. A monthly workflow test can expose an unverified phone number or an abandoned integration before a real incident does.
The Critical Start incident responder survey reported that 44% of respondents experienced a false-positive rate of 50% or higher, and 22% reported rates between 75% and 99%. Those findings reinforce the need to measure alert acknowledgment, escalation, suppression, and resolution quality rather than assuming that a delivered notification equals effective monitoring.
5. Cron Job and Background Task Monitoring
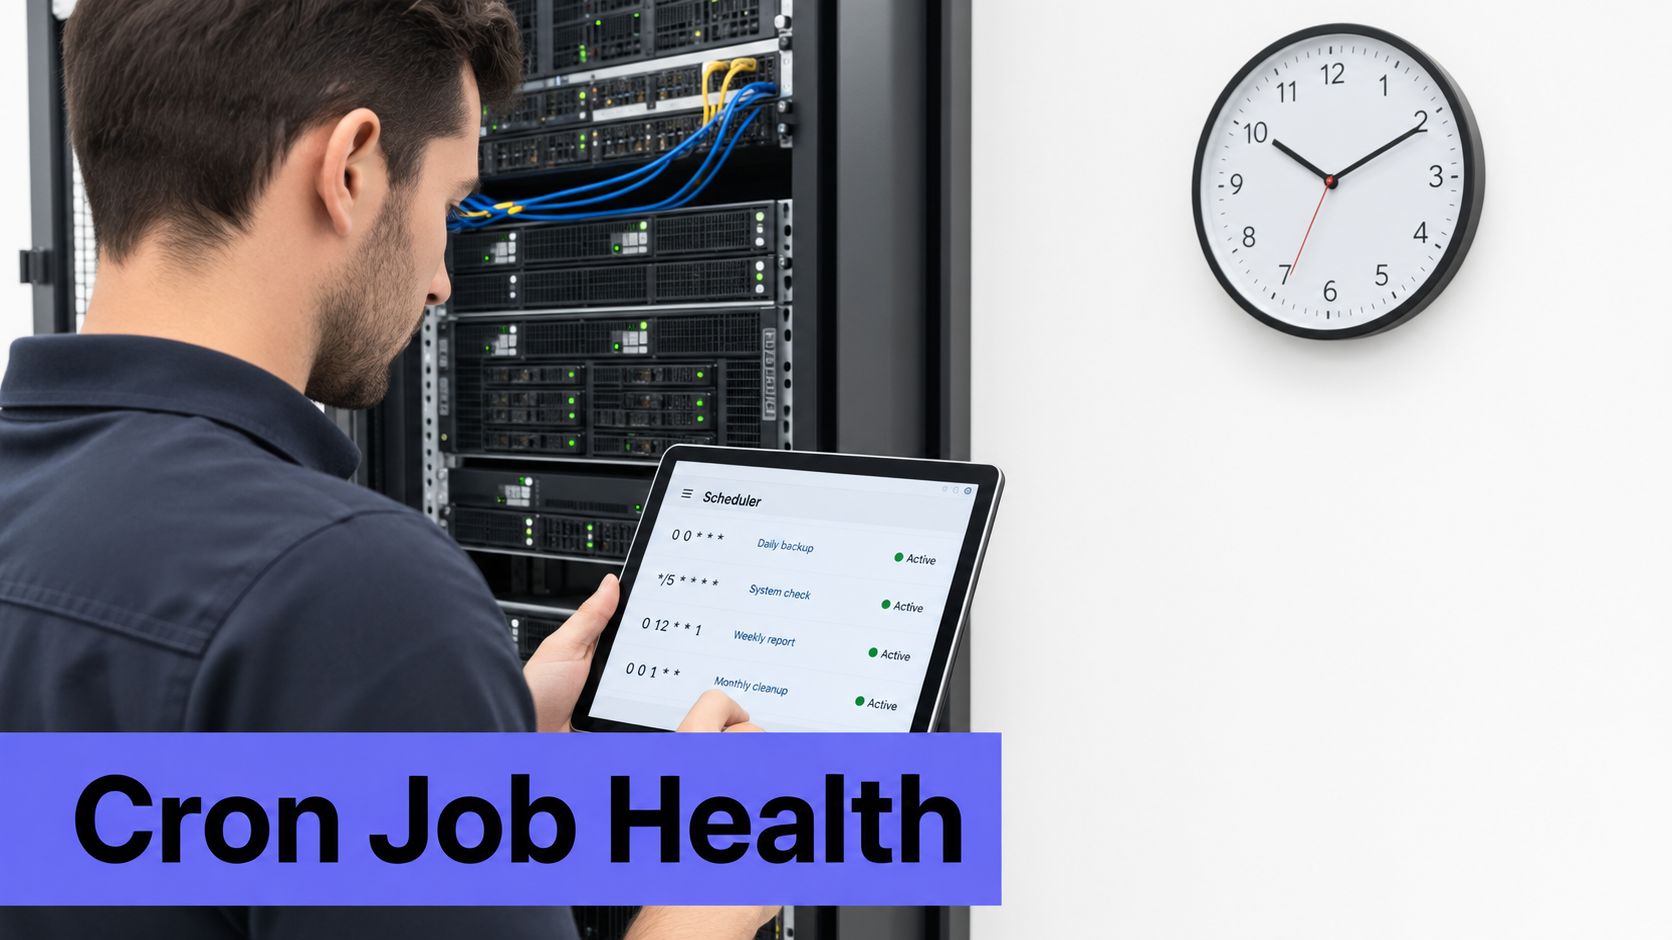
A scheduled task can fail without taking a server offline. That makes background work one of the most dangerous gaps in conventional monitoring. A database backup may stop running, a data synchronization process may become stale, or a report may miss its delivery window while every host and endpoint continues to answer normally.
Each critical job should send an explicit completion signal containing its status, execution time, and useful context. An exit code can indicate that a process ended, but a successful process exit doesn't always prove that the intended work completed. A report generator might produce an empty file, or a synchronization job might process no records because its input query returned unexpectedly.
Monitoring should distinguish at least three conditions: the job never started, the job started and failed, and the job completed but exceeded its expected duration. Those conditions lead to different responses. A missed start may indicate a scheduler or host problem. A failed run may require application investigation. A slow completion may signal capacity pressure before a hard failure occurs.
A strong job monitor records:
- Execution cadence: Whether the task ran when expected.
- Completion status: Whether the intended operation succeeded, not merely whether the process exited.
- Duration: Whether runtime is approaching or exceeding the operational window.
- Work context: Records processed, output generated, destination reached, or checkpoint advanced.
- Failure history: Whether repeated retries are masking a persistent defect.
Timeouts should account for peak workload, but they shouldn't be so generous that a stalled task remains invisible. Separate alert policies for “never started” and “started but failed” help the receiving team choose the correct runbook.
6. GPU and Specialized Hardware Resource Monitoring
CPU dashboards don't explain why a machine-learning workload is slow when the GPU is throttling, memory is fragmented, or a queue is growing. Specialized accelerators need their own health model because utilization, memory behavior, temperature, power state, and workload scheduling can diverge.
GPU monitoring should connect hardware signals to jobs and models. Average utilization can look healthy while short bursts saturate memory or cause queue delays. Conversely, low utilization can indicate an empty queue, a broken worker, an inefficient model, or a scheduler that isn't assigning work correctly. The metric matters only when operators can relate it to expected workload behavior.
A useful GPU view includes:
- Utilization and memory: Track both average and peak behavior, including fragmentation where the platform exposes it.
- Thermal and power state: Alert with enough headroom below the device's safe operating limit to allow investigation before throttling or shutdown.
- Clock behavior: Watch for throttling or unexpected frequency changes that can reveal thermal, power, or driver problems.
- Queue depth: Correlate hardware use with pending work so capacity decisions don't rely on utilization alone.
- Workload identity: Tag the model, job, customer, or rendering task where policy allows.
Static thresholds can be misleading across training, inference, rendering, and scientific workloads. A training run may create sustained high utilization by design, while an inference service may require low latency despite moderate average utilization. Baselines should therefore be workload-specific and reviewed after driver, model, or scheduler changes.
Access controls matter in shared accelerator environments. A tenant may need visibility into its own job performance without seeing another customer's model identifiers or data. GDPR-aware operations should avoid collecting personal data in job labels when technical identifiers are sufficient.
7. Proxmox and Hypervisor-Level Infrastructure Monitoring
Guest-level monitoring can show that a virtual machine is short on memory. It may not show that the physical host is oversubscribed, the storage backend is degrading, or a cluster operation is moving workloads during a sensitive period. Hypervisor monitoring supplies the missing layer between physical capacity and guest behavior.
A Proxmox view should cover cluster state, node health, guest availability, CPU and memory pressure, storage capacity, storage latency where available, backup completion, and migration events. Operators should correlate host metrics with guest metrics rather than treating either layer as authoritative by itself. A guest may report normal CPU use while waiting on a congested storage backend.
Capacity alerts should arrive before resource exhaustion. Oversubscription can remain invisible during ordinary load and become an outage during a deployment, backup window, or customer traffic surge. Storage consumption deserves the same attention. A full datastore can affect multiple guests at once, while a failed backup can remain hidden until recovery is needed.
For MSPs and hosting providers, tenant boundaries are central to the design. Dashboards should expose each customer's VM health, quota state, and service objective without revealing neighboring tenants. Resource usage can support internal capacity planning or contractual review, but billing and enforcement rules should remain separate from a raw metric unless the data has been validated.
Hypervisor coverage answers the question that guest monitoring can't: what else is competing for the same physical resources?
Migration events also deserve context. A VM that slows immediately after relocation may point to a host, storage, network, or configuration difference. Monitoring should record the event alongside performance signals so incident responders don't have to reconstruct the timeline manually.
8. Network Device and Link Health Monitoring
Application teams often discover network incidents through latency and error alerts, but those symptoms don't identify the failing link, interface, or control plane. Switches, routers, firewalls, and inter-datacenter connections need direct monitoring to expose degradation before it spreads across services.
Network monitoring should separate data-plane behavior from device health. Interface utilization, packet loss, errors, discards, and latency describe traffic delivery. Device CPU, memory, routing state, control-plane events, and restart frequency describe whether the network device can continue managing that traffic. A low-utilization link can still be unreliable if it is flapping or dropping packets.
Baselines should reflect working patterns rather than one universal bandwidth limit. A link that is quiet overnight may be expected to approach its normal daytime range, while a consistently busy interconnect may need capacity review even when no outage has occurred. Alerts should focus on sustained errors, packet loss, or repeated interface changes instead of every short-lived fluctuation.
Network checks should include redundancy. A port may be up while its peer, failover path, routing relationship, or upstream provider is unavailable. Monitoring only individual interfaces creates a false sense of resilience. The useful question is whether the designed path still works when a component fails.
Correlation with application data turns infrastructure signals into operational evidence. A rise in API latency that coincides with packet loss on a regional link deserves a different response from an API slowdown with stable network delivery. The monitoring system should preserve region, device, interface, service, and ownership labels so the right team can investigate without guessing.
9. White-Label Status Pages and External Transparency
Customers shouldn't need to open a support ticket to learn whether a provider already knows about a service disruption. A branded status page gives external stakeholders a controlled view of service health while keeping internal dashboards, hostnames, credentials, and sensitive incident details private.
A useful status page maps technical components to customer-facing services. “API,” “file transfers,” and “billing” may be more meaningful to customers than internal cluster names. Regional status can help a global SaaS provider communicate partial impact without declaring a full outage. An MSP can provide separate customer views when each client has distinct services, maintenance windows, or contractual objectives.
Status thresholds must align with customer-facing service objectives. Publishing every internal warning creates unnecessary concern, while waiting until support volume rises makes the page appear untrustworthy. Incident updates should include the affected service, current impact, mitigation status, and a timeline. After resolution, a concise root-cause summary can explain what happened without exposing security-sensitive implementation details.
Planned maintenance belongs on the same page. Customers can then distinguish an announced interruption from an unexpected failure, and operations teams can direct support conversations to a shared source of information. The page should also show historical availability information where the underlying calculations are clear and consistent.
A status page is itself an operational dependency. Teams should test who can publish updates, whether updates propagate correctly, and whether the page remains reachable during an incident affecting the primary platform. Access should use least privilege, with audit records for changes and a fallback communication method for a status-page outage.
White-labeling matters for MSPs and hosting providers because the communication layer should reinforce the customer's brand and relationship. Transparency works best when the page is accurate, timely, and written for the people affected, not copied from an internal alert payload.
10. Metric Baseline Establishment and Anomaly Detection
Static thresholds are easy to explain and often easy to get wrong. A fixed latency limit can page during an expected traffic peak, while a slow upward drift can remain below the threshold long enough to affect customers. Baselines and anomaly detection help teams identify behavior that differs from the service's normal operating pattern.
Baseline design should begin with a small set of important signals. For each metric, operators should define the population, time window, segmentation, and response. A web service may need separate baselines for business and quiet periods, while a batch system may need a baseline for each job phase. One baseline across unrelated workloads creates false confidence.
Anomaly detection should warn early, not replace absolute safety limits. A hybrid policy can combine a learned deviation with a hard ceiling, sustained duration, or second confirming signal. That approach catches gradual memory decline while still paging when a critical service crosses a known safety boundary.
The baseline itself needs monitoring. Deployments, traffic changes, new customers, seasonal behavior, hardware replacement, or a configuration change can make an old model inaccurate. Operators should record these changes and decide whether to retrain, segment, or temporarily suppress the anomaly rule.
A practical review should ask:
- Was the deviation actionable: Did the alert identify a condition that required intervention?
- Was the context sufficient: Could the responder see the affected service, region, tenant, and recent changes?
- Did the baseline drift: Has normal behavior changed without the model adapting?
- Did the alert predict impact: Did it reveal a developing issue before a user-facing symptom?
- Was the response sustainable: Would the same alert remain useful during a busy operational period?
The Grafana 2025 observability survey found average observability spend at 17% of total compute infrastructure spend, with 10% as the most common response. It also reported that 76% of organizations had centralized observability, and 79% of those organizations said centralization saved time or money. Those findings make a practical case for reviewing whether anomaly data, alert workflows, and operational context are consolidated enough to support decisions rather than adding another isolated signal source.
10-Point Monitoring Best Practices Comparison
| Item | Implementation complexity | Resource requirements | Expected outcomes | Ideal use cases | Key advantages |
|---|---|---|---|---|---|
| Multi-Region Health Checks with Failure Confirmation | Medium, configure distributed probes and confirmation rules | Multiple global check locations, additional monitoring nodes, modest cost | Reduced false positives; regional outage identification; realistic latency insights | Global SaaS, CDNs, multi-region APIs | Less alert fatigue; regional visibility; user-perspective validation |
| Infrastructure as Code for Monitoring Configuration | High upfront (IaC tooling, templates, pipelines) | Version control, CI/CD, Terraform/APIs, developer time | Reproducible, auditable monitoring; faster large-scale deployments | MSPs, large fleets, multi-environment deployments | Scalable, consistent, auditable configs; fewer manual errors |
| Per-Container and Per-Process Granularity Monitoring | Medium–High, instrumentation and labeling required | Agents with container runtime integration, increased metric storage | Deep workload visibility; precise alerts; resource contention detection | Kubernetes/microservices, multi-tenant hosting | Pinpoints offending services; enables autoscaling; cost optimization |
| Intelligent Alert Routing and Escalation Workflows | Medium, routing rules and schedules to design | Integrations (Slack/Teams/SMS/email), on-call system, rule maintenance | Faster response; reduced notification noise; reliable escalations | 24/7 ops, distributed teams, MSPs | Sends right alert to right person; reduces fatigue; automatic escalation |
| Cron Job and Background Task Monitoring | Low–Medium, instrument jobs or use webhooks | Lightweight webhook/endpoints, small storage, some instrumentation effort | Detects silent job failures; SLA enforcement for scheduled tasks | Data pipelines, backups, scheduled reporting | Catches unattended failures; prevents downstream impact |
| GPU and Specialized Hardware Resource Monitoring | Medium–High, vendor-specific metrics and thresholds | Specialized agents, domain expertise, additional sampling overhead | Prevents thermal/throttling/failures; improved GPU utilization | ML training/inference, rendering farms, HPC clusters | Protects expensive hardware; enables capacity planning; cost allocation |
| Proxmox and Hypervisor-Level Infrastructure Monitoring | Medium, integrate hypervisor APIs and guest metrics | Hypervisor integrations, storage and cluster metrics, higher cardinality | Visibility into host/VM contention, migration and storage issues | Hosting providers, virtualization-heavy environments | Prevents oversubscription; correlates hypervisor and guest health |
| Network Device and Link Health Monitoring | Medium, SNMP/NetFlow setup and vendor OID mapping | Polling infrastructure, collectors, network engineering expertise | Early detection of link/device failures; capacity planning | Multi-site networks, ISPs, enterprise WANs | Prevents bottlenecks; detects routing and interface problems |
| White-Label Status Pages and External Transparency | Low–Medium, branding and integration work | Public hosting, integration with monitoring, communication process | Reduced support volume; improved customer trust with public status | SaaS providers, MSPs, customer-facing services | Lowers support load; demonstrates SLA; transparent incident comms |
| Metric Baseline Establishment and Anomaly Detection | High, modeling, tuning, and re-baselining required | Historical data retention, ML/analytics, analyst time | Detects gradual regressions; adaptive alerts; fewer false positives | Variable workloads (e‑commerce, DBs), predictive ops | Adaptive, predictive alerts; reduces manual threshold tuning |
Turn the Checklist Into an Operating Standard
A monitoring program becomes reliable when the practices operate together. The implementation sequence should start with service indicators and objectives, not with a dashboard migration. Teams should define what customers experience as success, identify the most important user-facing paths, and connect those paths to latency, traffic, errors, and saturation.
The next step is to instrument the highest-risk workloads. That includes applications, containers, processes, scheduled jobs, databases, storage, network devices, hypervisors, and specialized hardware where those components can affect service delivery. Coverage should follow failure risk and ownership. A less important system with perfect telemetry shouldn't outrank a critical billing job that can fail undetected.
Multi-region checks then validate availability from the customer's perspective. Internal metrics can explain why a service is unhealthy, but regional checks reveal whether the problem is isolated, widespread, or specific to a network path. Failure confirmation should reduce isolated probe noise without delaying response to a genuine regional or global incident.
Alert routing should use the evidence already collected. Severity, service ownership, affected tenant, region, availability, and escalation state should determine who receives the notification and through which channel. A page should include a runbook and enough context to begin remediation. Teams should review false positives, acknowledgment rates, escalation outcomes, and missed incidents during regular operational reviews.
Noise deserves measurement rather than vague concern. The 2026 systematic review of alert fatigue identified 22 studies, with metrics ranging from 1 to 11 measures per study. Only one paper reported an operational definition of alert fatigue, while quantity, override rate, and acceptance rate appeared more often than sustained response quality. The practical lesson is that teams should track whether alerts remain actionable over time, not just whether alert volume falls.
Platform and silent-job coverage should follow the first alert review. Teams need to know whether backups completed, whether Proxmox storage is healthy, whether a GPU is throttling, whether a customer VM is within its resource boundary, and whether a network link is delivering traffic without errors. These signals complete the operating picture that uptime checks alone can't provide.
Monitoring changes should then move through version control. Terraform, APIs, reusable modules, code review, environment-specific policies, and documented thresholds make monitoring repeatable across SaaS environments, MSP tenants, hosting fleets, and solo-operated infrastructure. The Grafana 2024 observability survey reported that more than two-thirds of teams use at least four observability technologies, with respondents citing more than 60 technologies in use. It also reported that half of Grafana users had at least six active data sources. Reducing unnecessary tool sprawl can limit context switching and duplicated alert logic, but consolidation should never discard the evidence responders need.
Regular reviews should include tenant isolation, access controls, data retention, auditability, and GDPR-aware handling. Monitoring labels can accidentally contain personal or customer-sensitive information, so teams should collect only what supports diagnosis and service management. EU hosting and clear retention rules may be important requirements for organizations operating in regulated or privacy-sensitive environments.
Fivenines is one option for teams evaluating a move from Prometheus, Grafana, Alertmanager, UptimeRobot, or healthchecks.io. Its platform brings together Linux server metrics, network device health, website uptime, cron monitoring, per-container visibility, Proxmox data, and NVIDIA GPU insights, with multi-region checks, failure confirmation, status pages, workflow automation, a REST API, and Terraform support. The right platform isn't the one with the longest feature list. It's the one that preserves actionable context, supports required integrations, protects tenant boundaries, and makes reliable monitoring repeatable.
Fivenines brings server, network, uptime, cron, container, Proxmox, and GPU monitoring into one operational view, with routing, status pages, APIs, and Terraform support for repeatable workflows. Teams evaluating a move away from fragmented monitoring stacks can visit Fivenines to review how the platform fits their reliability and migration requirements.