System Health Monitoring Guide

A production service fails overnight. The first page points to a server with high CPU, the second points to a database connection pool, and the third points to an uptime check that still reports success. By the time an engineer traces the dependency chain, a customer has already reported that the application is unavailable.
This is the operational gap that system health monitoring must close. The discipline isn't a mere collection of CPU charts and ping checks. It's the continuous verification that infrastructure, applications, dependencies, and user-facing services are delivering the expected experience.
Table of Contents
- The True Cost of Fragmented Telemetry
- Essential Metrics for Modern Infrastructure
- Expanding Visibility Beyond the Server Rack
- Designing Symptom-Driven Alerting Strategies
- The Case for Unified Monitoring Platforms
- Deploying Secure Agents and Automating Workflows
- Building a Resilient Monitoring Culture
The True Cost of Fragmented Telemetry
Fragmented monitoring creates the illusion of coverage. A Prometheus instance collects host metrics, Grafana displays them, Alertmanager routes pages, and a separate uptime service checks the public endpoint. Each tool may work correctly in isolation, yet the team still lacks a dependable answer to the most important question: what is broken for the user right now?
A component-oriented dashboard might show healthy memory utilization while requests fail because a third-party API has slowed down. It might show normal web-server CPU while DNS resolution fails from a customer's region. It might page on a short-lived disk spike but remain silent when a scheduled job stops sending data.
Traditional monitoring began with basic availability checks and server alerts. Modern observability connects metrics, logs, traces, topology, and user-facing symptoms so responders can understand how a failure travels through a system. For teams evaluating that broader view, this guide to observability beyond uptime metrics provides useful context on why availability alone isn't enough.
The commercial shift reflects that operational change. The observability market was valued at USD 2.9 billion in 2025 and is projected to reach USD 6.93 billion by 2031, representing a projected 15.62% CAGR from 2026 through 2031. Cloud and SaaS deployments held 68.40% of the market in 2025, according to Mordor Intelligence's observability market analysis. The same source reports that solutions represented 71.30% of the market, compared with 28.70% for services, a structure that signals demand for packaged platforms rather than isolated consulting or manual instrumentation.
Why the toolchain becomes the incident
A fragmented stack adds more than subscription lines. It creates duplicated agents, separate authentication models, inconsistent retention policies, multiple alert languages, and several places where ownership can become unclear. Engineers spend incident time correlating timestamps across dashboards instead of deciding on a mitigation.
The operational burden also grows as teams add containers, virtual machines, network devices, edge locations, and scheduled jobs. A useful review of the cost of monitoring should include engineer time, integration maintenance, alert review, and the cost of investigating signals that never represented a user-visible problem.
Practical rule: A healthy component isn't proof of a healthy service. Monitoring should prove that the service works from the perspective that matters.
A unified system-health program changes the unit of analysis. Hosts and containers remain important, but they become evidence supporting service health rather than the final objective. The team can still inspect CPU, memory, storage, and network behavior, while the alerting layer asks whether customers are experiencing errors, latency, failed transactions, or unavailable dependencies.
Essential Metrics for Modern Infrastructure
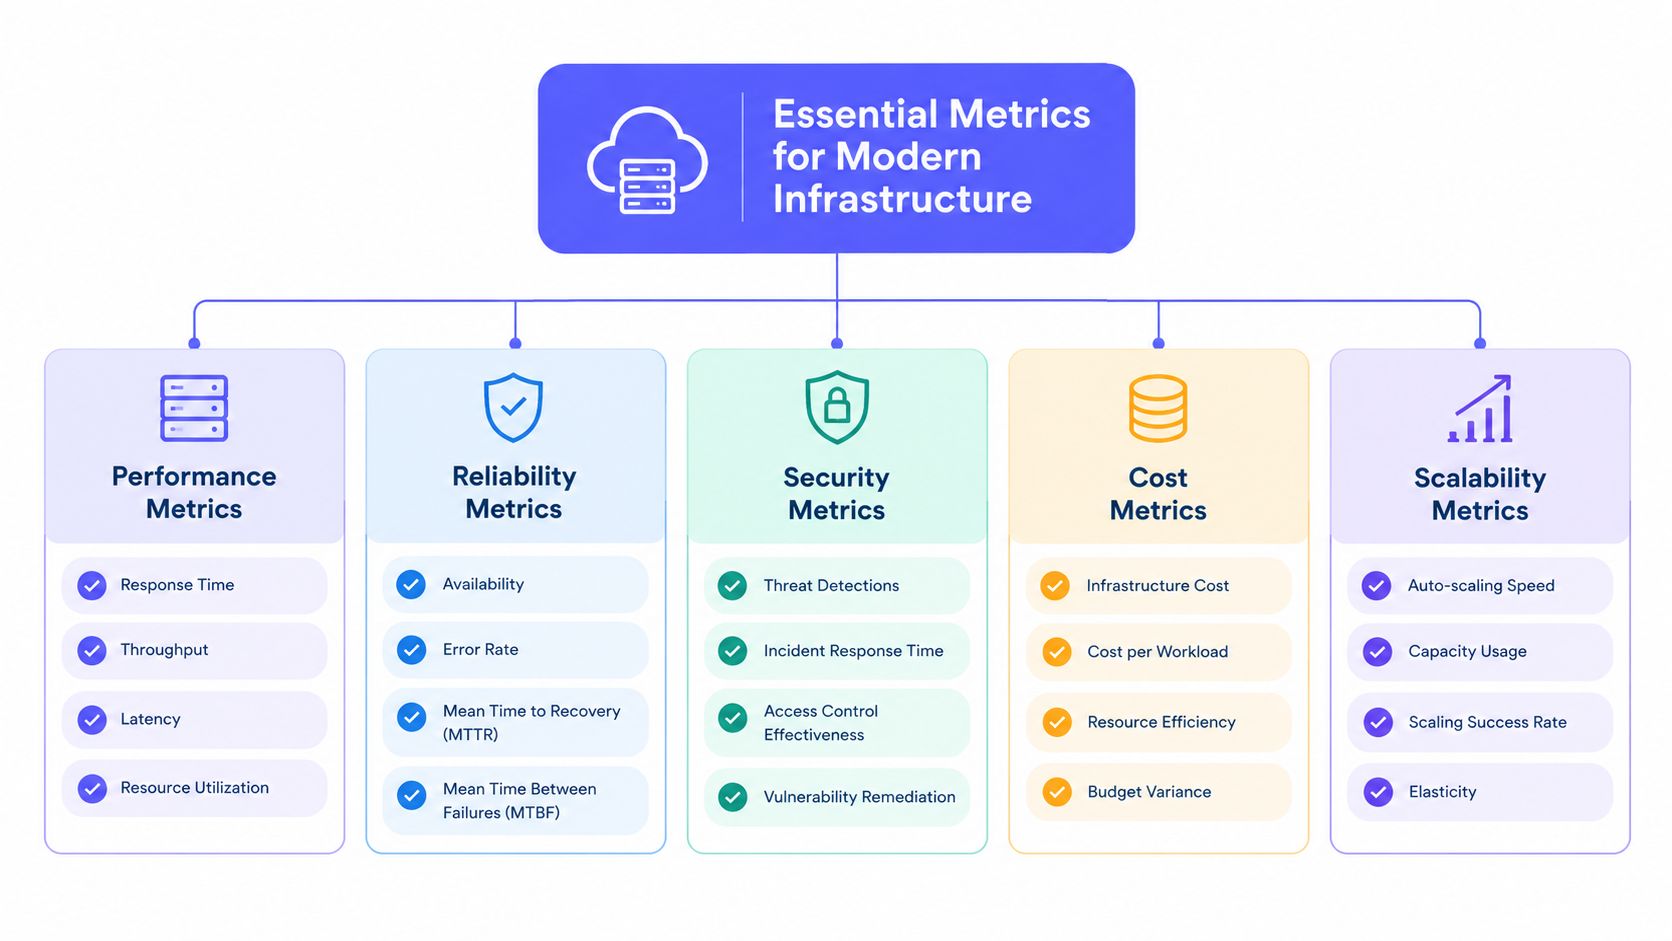
A useful telemetry design starts with capacity and ends with impact. Raw measurements matter because they reveal constraints, but each metric should answer a question about reliability, performance, or operational risk.
Start with the host, but don't stop there
CPU utilization provides a starting point for identifying saturation, inefficient processes, and capacity pressure. It becomes more useful when paired with load, process-level usage, throttling, and the distinction between user time, system time, and idle time. A busy CPU isn't automatically an incident. A service that exhausts CPU while response latency rises is a much stronger signal.
Memory telemetry should include used memory, available memory, swap activity, reclaim behavior, and, where relevant, container-level limits. A host can show acceptable overall memory while one container repeatedly reaches its limit and restarts. Monitoring should preserve the relationship between the host, workload, and service.
Disk metrics need more detail than free capacity. Teams should collect read and write throughput, I/O operations, latency, queue depth, filesystem capacity, inode availability, and storage errors. A full filesystem is obvious; rising I/O latency can degrade databases and queues long before capacity reaches a critical threshold.
Network metrics should cover throughput, packet errors, drops, retransmissions, interface state, connection counts, and latency. For switches, routers, and firewalls, interface counters and device health can expose the dependency that host dashboards miss. A server may be functioning normally while a congested uplink prevents customers from reaching it.
The relationship between a metric and a limit matters more than the metric alone. A disk with plenty of free space can still be too slow for a workload. A server with moderate CPU usage can still suffer from a single-thread bottleneck. Dashboards should therefore show both current behavior and an operational baseline.
Add workload-specific signals
Containerized environments require visibility at the container and orchestration layers. Restarts, pending workloads, resource throttling, failed scheduling, readiness state, and node pressure reveal failures that host-level averages hide.
Virtualization adds another layer. Proxmox environments should expose guest state, host capacity, storage latency, bridge and interface behavior, and the relationship between virtual machines and physical resources. Without that context, a guest performance complaint can be misdiagnosed as an application issue.
GPU workloads need their own health model. NVIDIA compute hosts benefit from telemetry covering utilization, memory consumption, temperature, power behavior, process allocation, and hardware errors. A GPU can remain online while a workload loses effective capacity because memory is exhausted or a device is repeatedly resetting.
A practical metric inventory can be organized like this:
- Compute: CPU saturation, load, process behavior, memory pressure, swap, and container limits.
- Storage: Capacity, inodes, throughput, latency, queue depth, and errors.
- Network: Traffic, drops, errors, retransmissions, connections, and interface state.
- Workloads: Restarts, job state, queue depth, request rate, errors, and latency.
- Specialized hardware: Virtualization health, GPU utilization, device memory, temperature, and hardware faults.
Dashboards should support investigation, not act as a museum of every available time series. Guidance on metrics and dashboards is useful here because the strongest dashboard design ties each panel to a decision, such as scaling, restarting, draining traffic, or escalating to an owner.
Expanding Visibility Beyond the Server Rack
A server can be healthy while the service is unavailable. That happens when the failure sits in the network path, a cloud dependency, DNS, a certificate, a scheduled job, or a remote integration. System health monitoring must therefore combine inside-out telemetry with outside-in checks.
A global survey of IT professionals found median annual downtime of 280 hours. The same research attributed 35% of downtime to network failure, 29% to third-party or cloud provider failures, and 28% to human error. It also reported that 62% of organizations experiencing high-business-impact outages paid at least USD 1 million per hour of downtime, as summarized in this observability and APM market analysis. The figures make the operational point clearly: server metrics cover only part of the failure surface.
Build an outside-in check layer
HTTPS checks confirm that a public endpoint responds and that the response matches an expected condition. TCP checks validate reachability to a service boundary. ICMP checks can help identify broad network reachability problems, while DNS checks verify that name resolution works from the intended locations.
A single monitoring region isn't enough for geographically distributed services. A failed route, regional resolver problem, or provider-specific issue can affect one population while the origin server remains healthy. Checks from multiple regions help separate a local observation from a broad outage.
Synthetic transactions go further by testing a meaningful user flow, such as authentication, search, checkout, or an API sequence. They should be designed carefully, with test accounts and clear separation from production business data. Synthetic traffic must also be excluded from production user signals, because test requests can distort service-health measurements and create misleading conclusions.
Track work that doesn't run continuously
Cron jobs and scheduled workers often fail without detection. A process can exit with an error, hang indefinitely, or complete late while the host continues reporting normal health. Heartbeat monitoring gives each job an expected completion signal and creates an incident when that signal doesn't arrive.
This model is especially useful for backups, report generation, data synchronization, certificate renewal, queue consumers, and billing workflows. The monitor shouldn't only ask whether a process started. It should verify that the expected work completed within an acceptable operating window.
Operational insight: A monitoring plan that checks servers but ignores scheduled work can miss the exact failure that causes stale data, delayed reports, or broken downstream automation.
Dependency monitoring should follow the customer journey. If a web application depends on DNS, a CDN, an identity provider, a payment service, and a database, the monitoring model should represent those relationships. A page on every individual dependency creates noise. A service-level alert that combines failed transactions with dependency evidence gives responders a more useful starting point.
Teams comparing approaches to infrastructure visibility should ask whether the platform covers public endpoints, network equipment, scheduled jobs, and application symptoms in the same operational workflow. A broad view is valuable only when it remains actionable for the team responsible for response.
Designing Symptom-Driven Alerting Strategies
More alerts don't create more reliability. They create more opportunities for responders to distrust the monitoring system.
A 2025 observability study found that only 18% of incidents were actionable, with the average enterprise receiving 9.6 million events per year and 27% of events arriving on weekends. A separate survey identified alert fatigue as the No. 1 obstacle to faster incident response, while 15% of UK IT teams reported deliberately ignoring or suppressing alerts. These findings are reported in the Siemens IT monitoring report.
The remedy isn't to remove alerts indiscriminately. It's to distinguish a component anomaly from a user-visible symptom and page only when a human can take a useful action.
Page on symptoms and consequences
Google's SRE guidance recommends alerts that reliably identify a real problem when automation can't self-heal. The responder needs a clear mitigation path and a route toward understanding the cause, as explained in Google's guidance on monitoring distributed systems.
A high CPU alert may be appropriate for capacity management, but it isn't automatically an overnight page. A sustained rise in failed requests, an error-budget breach, or a confirmed transaction failure is closer to a symptom that warrants immediate attention.
The alert payload should include:
- User impact: Which service, region, tenant, or transaction is affected.
- Evidence: The breached condition, time window, and related signals.
- Ownership: The responsible team and escalation route.
- Mitigation: The first safe action, such as rollback, failover, or traffic reduction.
- Investigation: Links to dashboards, logs, traces, and a relevant runbook.
Fault analysis can improve this design. A practical resource on fault tree analysis and prevention tips can help teams map how several low-level conditions combine into a customer-visible incident instead of paging on every leaf condition.
Use two time windows
Multi-window, multi-burn-rate alerting uses a short window and a long window together. A page is triggered only when both windows breach the defined condition, which filters transient spikes while still detecting sustained degradation, as described in this guide to burn-rate alerting.
This approach works because a brief burst and a persistent failure have different operational meanings. A transient queue increase may resolve without intervention. A continuing error-rate breach consumes reliability capacity and demands a response.
| Feature | Traditional Threshold Alerting | Symptom-Driven Burn-Rate Alerting |
|---|---|---|
| Primary trigger | A component crosses a fixed limit | User-facing reliability degrades |
| Time context | Often a single window | Short and long windows together |
| Noise profile | Sensitive to transient spikes | Filters brief excursions |
| Response | May require interpretation before action | Designed around mitigation and ownership |
| Best use | Capacity observation and diagnostics | Paging for sustained service impact |
Alert routing should match severity. Low-risk diagnostics can remain in dashboards or team channels. Sustained service impact can route to PagerDuty, Slack, Microsoft Teams, or another on-call path, with maintenance windows and deduplication applied before escalation.
The final test is simple: can the recipient explain why the page matters and what action comes next? If not, the rule belongs in a diagnostic view until its context improves.
The Case for Unified Monitoring Platforms
A Prometheus, Grafana, Alertmanager, and external uptime stack can be a sensible starting point. The difficulty appears later, when every team adds exporters, recording rules, dashboards, routing exceptions, credentials, retention settings, and custom integrations.
The stack becomes a product that the operations team must build and maintain. That can work for organizations with dedicated platform capacity. It is often a poor trade-off for a lean team that needs Linux metrics, network health, public uptime, and scheduled-job coverage without owning every layer of the monitoring architecture.
Compare the operational model
| Area | Fragmented Toolchain | Unified Monitoring Platform |
|---|---|---|
| Deployment | Several agents, exporters, and services | A consistent enrollment workflow |
| Investigation | Context switching across dashboards | Shared service and infrastructure views |
| Alert policy | Rules distributed across tools | Centralized routing, suppression, and escalation |
| Coverage | Teams assemble host, network, and uptime components | Common model for mixed infrastructure |
| Automation | Separate APIs and configuration formats | Monitors and workflows managed through one interface |
| Client reporting | Often requires another service | Status pages and access controls can be part of the platform |
The strongest reason to consolidate isn't visual polish. It's the reduction of operational boundaries. One system can connect a Linux host, a network device, a website check, and a cron heartbeat to the same ownership model. That makes it easier to identify whether an incident originates inside the server, at the edge, or in a dependency.
The trade-off deserves equal attention. A unified platform can limit deep customization that an in-house Prometheus deployment provides. It may also require teams to adapt existing dashboards and alert expressions. Before migrating, the team should identify which custom queries are essential and which exist only because the old stack lacks a practical default.
Consolidate without creating a new silo
The platform should support open integrations, APIs, infrastructure-as-code, and clear export options. It should also provide role-based access, auditability, retention controls, and predictable configuration behavior. A unified interface that cannot integrate with incident response or deployment workflows only creates another silo.
Google's SRE principles support the shift from component obsession to user-visible symptoms. Monitoring should prioritize true positives, provide enough context for action, and avoid allowing synthetic or test traffic to contaminate production signals. That principle applies whether the underlying system is open source, commercial, or built internally.
Teams researching application monitoring platform picks can use a practical evaluation checklist: coverage across infrastructure and applications, alert quality, deployment security, API access, ownership controls, and the effort required to migrate existing monitors.
For teams that need a single operational view, the decision framework in this guide to a unified observability platform can help separate genuine consolidation from just adding another dashboard. The migration succeeds when the new system reduces decisions and maintenance, not merely when it displays more data.
Deploying Secure Agents and Automating Workflows
A monitoring architecture should be secure by default and repeatable across the fleet. The safest rollout pattern usually starts with outbound telemetry from the monitored host, rather than opening inbound firewall ports or creating a remote command path for the collector.
Establish the collection path
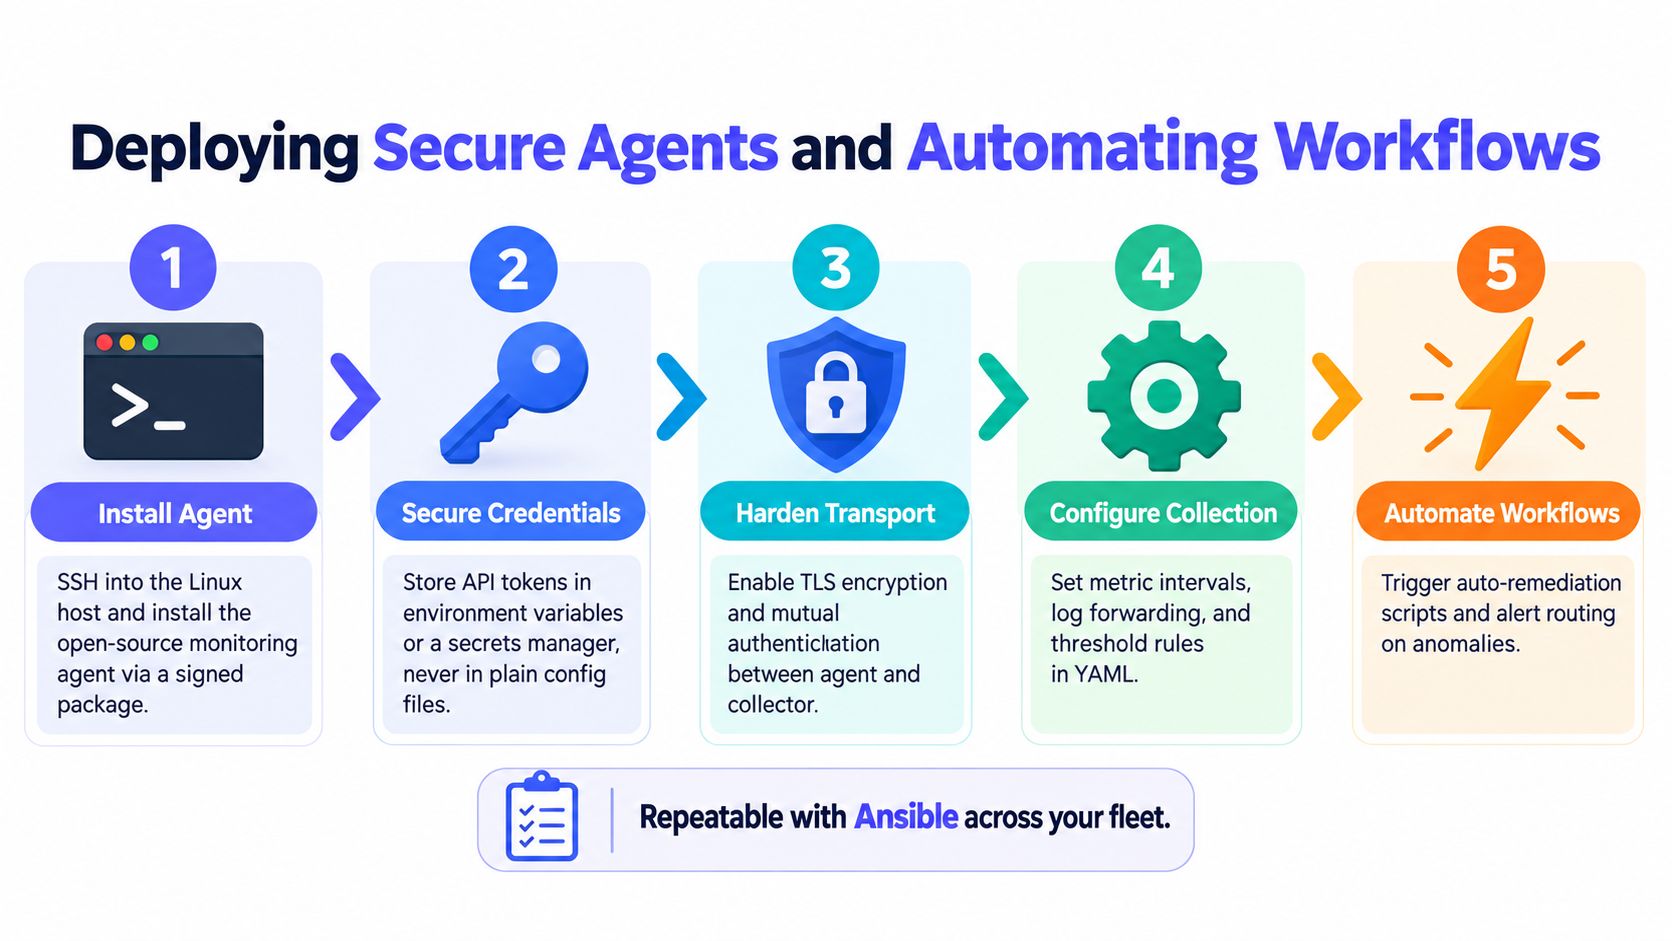
The deployment sequence should be deliberate:
Install a signed agent package. Use the operating system's normal package controls, verify the package source, and run the agent with only the permissions required for collection. A lightweight agent can gather host and workload signals without exposing an administrative shell.
Protect credentials. Store API tokens in environment variables or a secrets manager. Plain-text credentials in configuration files create unnecessary exposure through backups, support bundles, and accidental repository commits.
Harden transport. Send telemetry over encrypted HTTPS. Validate certificates, restrict outbound destinations where practical, and rotate credentials without rebuilding the host.
Configure collection as code. Define intervals, labels, log forwarding, thresholds, and ownership in version-controlled configuration. A code review should be able to show why a new signal exists and who receives its alerts.
Automate enrollment. Use Ansible or another fleet-management tool to install the agent, apply policy, verify connectivity, and assign the host to the correct service group.
Connect remediation carefully. Trigger safe actions such as restarting a known-stuck worker, opening a ticket, delaying escalation during maintenance, or routing an incident to the owning team. Destructive actions should require explicit safeguards and an audit trail.
The public REST API and Terraform provider should be treated as operational interfaces, not optional conveniences. They allow teams to create monitors, maintain tags, define notification policies, and reproduce an environment without manually clicking through every host.
Roll out in controlled layers
A migration should begin with a small representative slice of the estate. Include a Linux server, a public endpoint, a network device, and a scheduled job if those assets exist in production. The team can then validate collection, labels, alert routing, maintenance behavior, and runbook links before extending the model.
Avoid copying every legacy alert into the new system. That only transfers historical noise. Instead, classify each rule as a page, ticket, dashboard signal, automated action, or deletion candidate. A monitor without an owner or response path shouldn't become part of the new baseline.
The alert pipeline also needs failure testing. Teams should confirm that a disconnected agent, failed endpoint, delayed heartbeat, and notification integration outage each produce the intended operational result. A monitor that works only during normal conditions isn't a reliable control.
Multi-window burn-rate policies belong in this rollout because they reduce pages caused by short-lived fluctuations while preserving sensitivity to sustained service degradation. The policy should also include an owner, a runbook, a severity, and a maintenance procedure from the start.
Building a Resilient Monitoring Culture
Tools don't create trusted monitoring on their own. Teams build trust when every alert has an owner, every page has a reason, and every incident produces a concrete improvement to detection or response.
Recent observability guidance indicates that infrastructure monitoring is growing modestly while audits, end-user reporting, and real-user monitoring are advancing faster. The implication is practical: teams are looking beyond classic CPU and memory checks to understand dependency health and actual user impact, as discussed in Grafana's observability survey takeaways.
Use a migration checklist
A resilient operating model should answer these questions:
- Ownership: Does every critical service have a named team and escalation route?
- Symptoms: Does each page represent current or imminent user impact?
- Coverage: Are hosts, containers, network devices, public endpoints, dependencies, and scheduled jobs represented where relevant?
- Context: Does the alert include evidence, a dashboard, and a mitigation path?
- Noise: Are transient spikes, duplicate events, maintenance windows, and test traffic handled deliberately?
- Security: Do agents use least privilege, encrypted transport, protected credentials, and controlled destinations?
- Automation: Can teams manage monitors, policies, and routing through version control or an API?
- Learning: Do incident reviews produce updated thresholds, new checks, better runbooks, or safer remediation?
The review cadence matters more than the initial configuration. Services change, dependencies move, traffic patterns evolve, and old alerts lose their meaning. Teams should periodically examine pages that didn't lead to action, incidents that had no alert, and alerts that arrived after customers had already reported the issue.
Measure the quality of the signal
Alert count is a poor success metric. Better measures include the proportion of pages that lead to a meaningful action, the number of incidents discovered by customers, the frequency of duplicate pages, and the percentage of alerts with a current runbook. These measures encourage teams to improve signal quality instead of increasing telemetry volume.
A resilient culture also treats monitoring as part of service ownership. Developers should expose useful application symptoms, infrastructure teams should maintain capacity and dependency signals, and on-call engineers should be able to change noisy rules without navigating an opaque approval process.
The objective isn't maximum visibility. It's dependable visibility that helps the right person make the right decision before a small fault becomes a customer-facing outage.
Teams moving away from fragmented Prometheus stacks should begin with the highest-cost blind spots, not a wholesale rewrite. Map the customer journey, identify the signals that prove service health, remove pages that don't lead to action, and then automate the resulting design. That sequence turns system health monitoring from a reactive collection of dashboards into a maintainable operating practice.
Fivenines brings Linux and Windows metrics, network device health, website uptime, DNS and TCP checks, and cron monitoring into one operational view, with outbound agent telemetry, multi-region checks, alert routing, and workflow automation. Teams evaluating a simpler alternative to fragmented monitoring stacks can visit Fivenines to review the platform and plan a focused migration.