Unified Observability Platform: A Practical Guide


At 3 a.m., an on-call engineer is rarely looking at one screen. A latency alert opens Grafana, an application error requires a log search, a trace lives in a separate APM console, and a customer-facing outage still needs confirmation from an uptime service. The incident isn't difficult because the signals are unavailable. It's difficult because the engineer must reconstruct their relationship under pressure.
A unified observability platform promises to reduce that reconstruction work. The promise is useful, but incomplete. A single interface doesn't automatically create shared context, control telemetry waste, or cover every operational signal a production environment needs. The practical question is whether the platform helps teams isolate faults faster while keeping ingestion, retention, and alerting economically disciplined.
Table of Contents
- What a Unified Observability Platform Actually Means in Practice
- How the Industry Got Here and Where OpenTelemetry Fits
- The Five Core Signals Every Unified Platform Must Handle
- Unified Platform vs Componentized Prometheus and Grafana Stacks
- Layered Architecture and the Real Cost of Telemetry Volume
- Migration Patterns and Automation-as-Code for DevOps and MSPs
- What Still Stays Outside the Single Pane of Glass
- Choosing a Unified Observability Platform That Fits Your Team
What a Unified Observability Platform Actually Means in Practice
A unified observability platform should provide more than a dashboard that embeds panels from unrelated products. It should collect telemetry from heterogeneous sources, normalize that data through a common ingestion layer, store it by signal type, correlate related records, and expose the result through a shared query and alerting experience. A request spike, its associated error logs, the trace that identifies a slow dependency, and the affected service owner should connect without an engineer manually copying identifiers between consoles. This layered model is described in research on single-pane-of-glass observability architecture.
A dashboard aggregator can look similar while working very differently. It may place Prometheus charts, Elasticsearch searches, and an external uptime widget on one page, but each backend still has its own identity model, retention policy, alert syntax, and ownership metadata. That arrangement improves navigation. It doesn't necessarily improve correlation.
The operational test
The strongest test happens during an incident. Can the engineer move from symptom to likely cause without opening another product, translating labels, or locating a missing tenant context? Can the alert show the relevant service, deployment, host, customer, trace ID, and runbook together? Can the platform suppress duplicate pages when the same failure appears in metrics, logs, traces, and synthetic checks?
A useful evaluation should answer four practical jobs:
- Vendor selection: Determine whether the platform offers real shared data semantics or only a consolidated interface.
- Migration planning: Identify which agents, exporters, dashboards, alerts, and retention policies require translation.
- Architecture choice: Decide whether a unified backend or a componentized Prometheus and Grafana stack fits the team's skills and estate.
- Telemetry governance: Set rules for sampling, filtering, labels, ownership, and retention before volume becomes the main cost driver.
Practical rule: Count the signals that reach a trustworthy incident decision, not the number of products represented in a dashboard.
Unification therefore has a narrower and more demanding definition than “everything appears in one pane.” The platform must preserve useful signal coverage, make relationships queryable, and give operators control over what enters the system. A smaller platform with disciplined ingestion can serve an incident better than a larger platform that centralizes noisy, poorly labeled data.
How the Industry Got Here and Where OpenTelemetry Fits
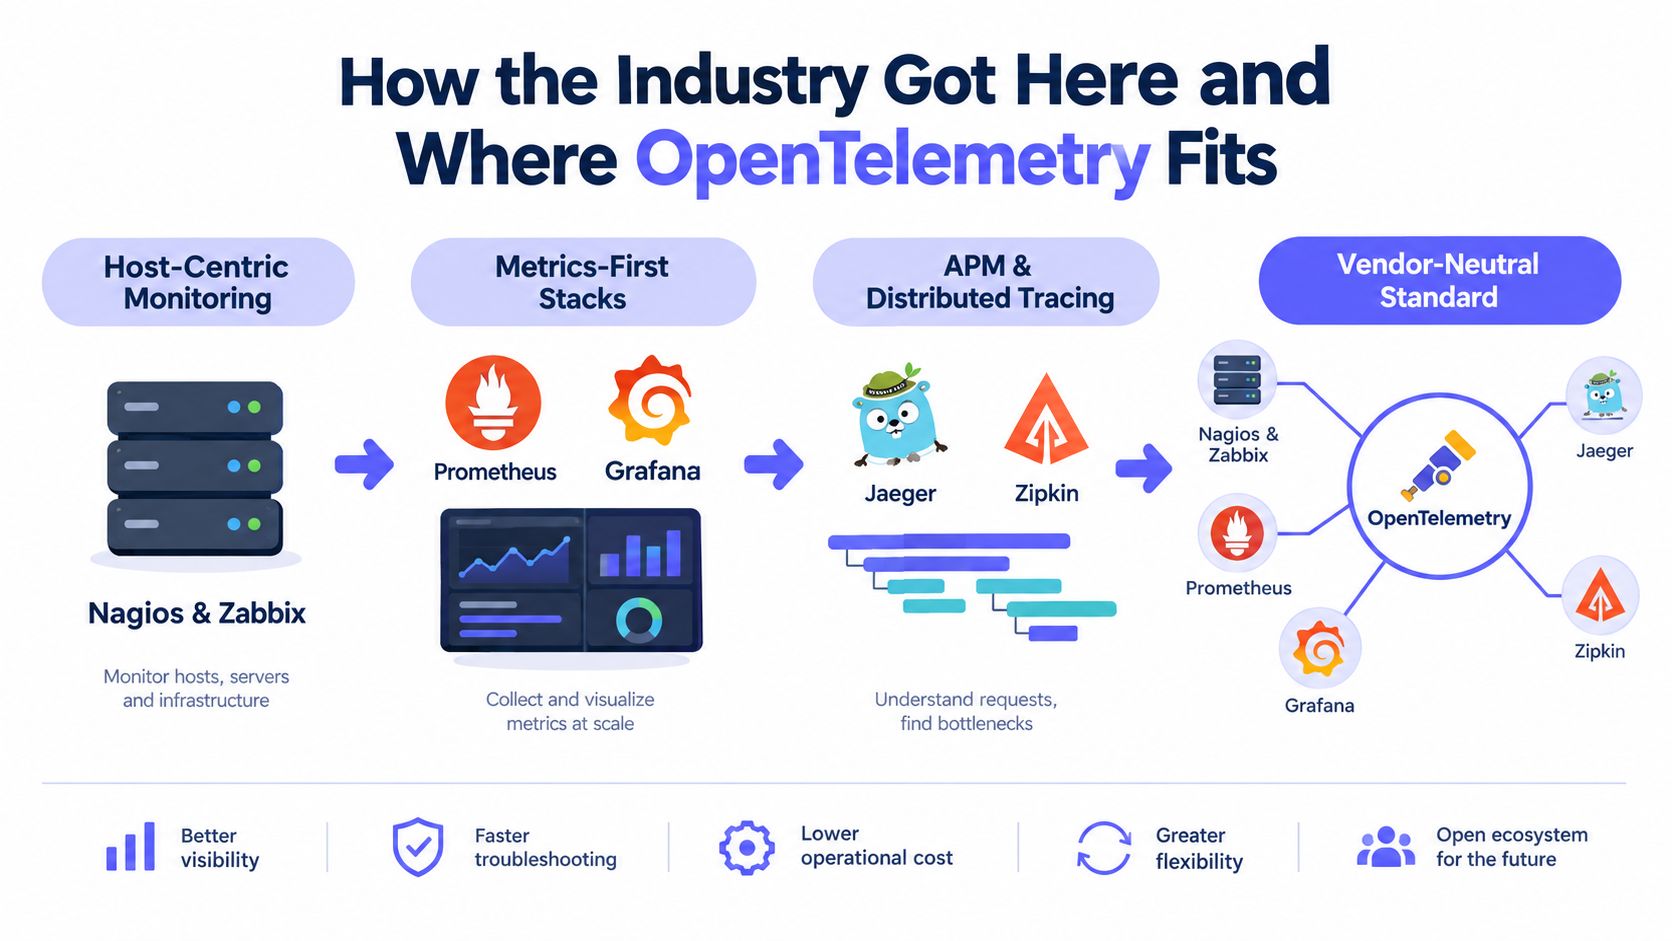
Monitoring started with machines. Host-centric tools such as Nagios and Zabbix checked whether servers, services, and basic thresholds looked healthy. Prometheus shifted attention toward labeled time-series metrics, while Grafana made those metrics easier to explore and share. Application performance monitoring then added code-level context, and Jaeger and Zipkin helped teams follow requests across distributed services.
Each step solved a real problem, but each also added another collection model. Teams had to decide which agent to install, which exporter to maintain, which backend to fund, and how to connect one tool's service name with another tool's host or application identity.
OpenTelemetry as the shared collection layer
OpenTelemetry changed the architectural boundary. Instead of instrumenting code directly for a vendor's proprietary agent, teams can emit telemetry through a vendor-neutral framework and route it to one or more backends. Collectors can receive, process, sample, enrich, and export signals without forcing the final storage decision into application code.
The adoption data shows why this matters. The CNCF Annual Cloud Native Survey reporting says 49% of respondents used OpenTelemetry in production, while 26% were evaluating it. The same reporting found that only 7.4% reported a fully unified observability experience, and 46.7% still operated two or three observability tools in parallel. The industry has moved toward common instrumentation, but most organizations haven't eliminated the stack beneath it.
Grafana Labs' 2025 Observability Survey coverage reinforces that transitional picture. 70% of respondents used both Prometheus and OpenTelemetry in some capacity, 67% used Prometheus in production, and 41% used OpenTelemetry for telemetry collection. Open-source licensing was used by 75% of respondents, while 38% were investigating OpenTelemetry and 6% had no plans to use it.
The historical implication is straightforward. Shared instrumentation made shared backends more practical, but it didn't make migration automatic. Teams still need to map PromQL queries, alert semantics, labels, ownership, retention, and dashboards. Guidance on tracing in Java is useful when application teams need to understand that instrumentation work remains distinct from backend selection.
The Five Core Signals Every Unified Platform Must Handle
A platform can claim broad coverage while treating each signal as if it were interchangeable. That approach fails because metrics, logs, traces, uptime checks, and device health have different collection paths, query patterns, retention needs, and noise profiles.
Metrics answer how a system behaves over time. A request-rate counter might arrive through OTLP or a compatible scrape path and land in a time-series engine. Downsampling can preserve longer-term trends, but it mustn't erase the resolution needed for current incident analysis. Labels require strict ownership because every new dimension can create additional series.
Logs preserve event detail. Structured JSON from a sidecar or agent should remain searchable by fields such as service, severity, tenant, and request identifier. Full-text indexing makes logs useful during diagnosis, while tiered storage can move older data away from the fastest search tier. Logs shouldn't become the default storage location for every debugging detail.
Traces explain a request's path. A checkout flow may produce spans across an API, payment service, inventory database, and message queue. Sampling controls cost, but the sampling policy must retain useful failure paths and preserve the trace ID that lets the engineer pivot from a slow metric or error log into the request.
Uptime measures reachability from outside the system. Synthetic HTTPS, TCP, ICMP, or DNS probes need locations, confirmation logic, and an SLO-oriented schema. An internal service metric can remain green while an external route, certificate, DNS response, or network edge fails.
Device health covers systems that application telemetry doesn't understand. SNMP polling, agent collection, and hardware checks can expose CPU, memory, storage, interface, and SMART status. These signals often arrive at a slower cadence and work better as batched, long-tail metrics than as high-frequency application events.
| Signal | Collection method | Storage profile | Cardinality risk |
|---|---|---|---|
| Metrics | OTLP, scrape, or agent collection | Time-series storage with retention tiers | High when labels describe requests, users, or dynamic resources |
| Logs | Structured agent or sidecar forwarding | Indexed search with tiered retention | Moderate to high when fields and message fragments vary freely |
| Traces | Instrumentation with collector sampling | Trace store keyed by trace and span IDs | High when full-fidelity data is retained without sampling |
| Uptime | External synthetic probes | Low-cardinality status and latency series | Usually controlled, but probe and endpoint dimensions still need governance |
| Device health | SNMP, agent, or hardware polling | Batched infrastructure metrics | Grows with devices, interfaces, sensors, and dynamic labels |
The storage layer can place these signals under one product identity. The engineering work lies in making their collection predictable, their metadata compatible, and their alerts actionable. Unifying storage is relatively easy. Unifying ingestion discipline is the project.
Unified Platform vs Componentized Prometheus and Grafana Stacks
A componentized Prometheus, Grafana, and Alertmanager stack gives experienced teams considerable control. It also gives them several operational boundaries to maintain. A unified platform trades some of that component-level freedom for shared identity, correlation, alerting, and tenancy.
| Criteria | Unified Platform | Prometheus + Grafana + Alertmanager |
|---|---|---|
| Ingestion cost per active series | Depends on vendor pricing and controls for volume, labels, and retention | Depends on infrastructure, storage, remote write, and engineering capacity |
| Query language parity | Usually offers one experience across supported signals, though translations may be needed | PromQL is strong for metrics, while logs and traces commonly use separate query models |
| Alerting rule portability | Rules may require migration into a platform-specific format | Prometheus rules and Alertmanager routing are familiar but remain component-specific |
| Cross-signal correlation | Often built into shared resource, service, and trace context | Possible, but commonly requires integrations, labels, and manual pivots |
| Multi-tenancy | Usually a product capability with tenant and access controls | Requires careful design across projects, data sources, folders, and routing |
| Operational toil | Fewer systems to upgrade and integrate, with greater vendor dependency | More control, exporters, and customization, with more systems to operate |
The failure modes matter more than the feature comparison. A label-cardinality explosion can make metric storage expensive or difficult to query. An alert-routing mismatch can page the wrong team or duplicate the same event. During a database incident, an engineer may see the metric spike in Prometheus, then search logs elsewhere, then paste a trace ID into another tool. Every handoff adds delay and opportunities for context loss.
Prometheus remains a strong choice for a greenfield Kubernetes environment with capable SRE staffing, custom exporters, and a desire to tune every component. A unified platform often fits an MSP with heterogeneous customer estates, or a small platform team that can't justify maintaining several backends, collectors, routing systems, and access models.
The migration cost is real. PromQL dashboards, recording rules, alert expressions, scrape assumptions, and runbooks may not transfer cleanly. OpenTelemetry Collectors provide a useful compromise because both architectures can share the collection and processing layer while the backend decision happens later. Teams evaluating application performance monitoring practices should treat that shared layer as migration infrastructure, not as proof that the destination platform is already equivalent.
Layered Architecture and the Real Cost of Telemetry Volume
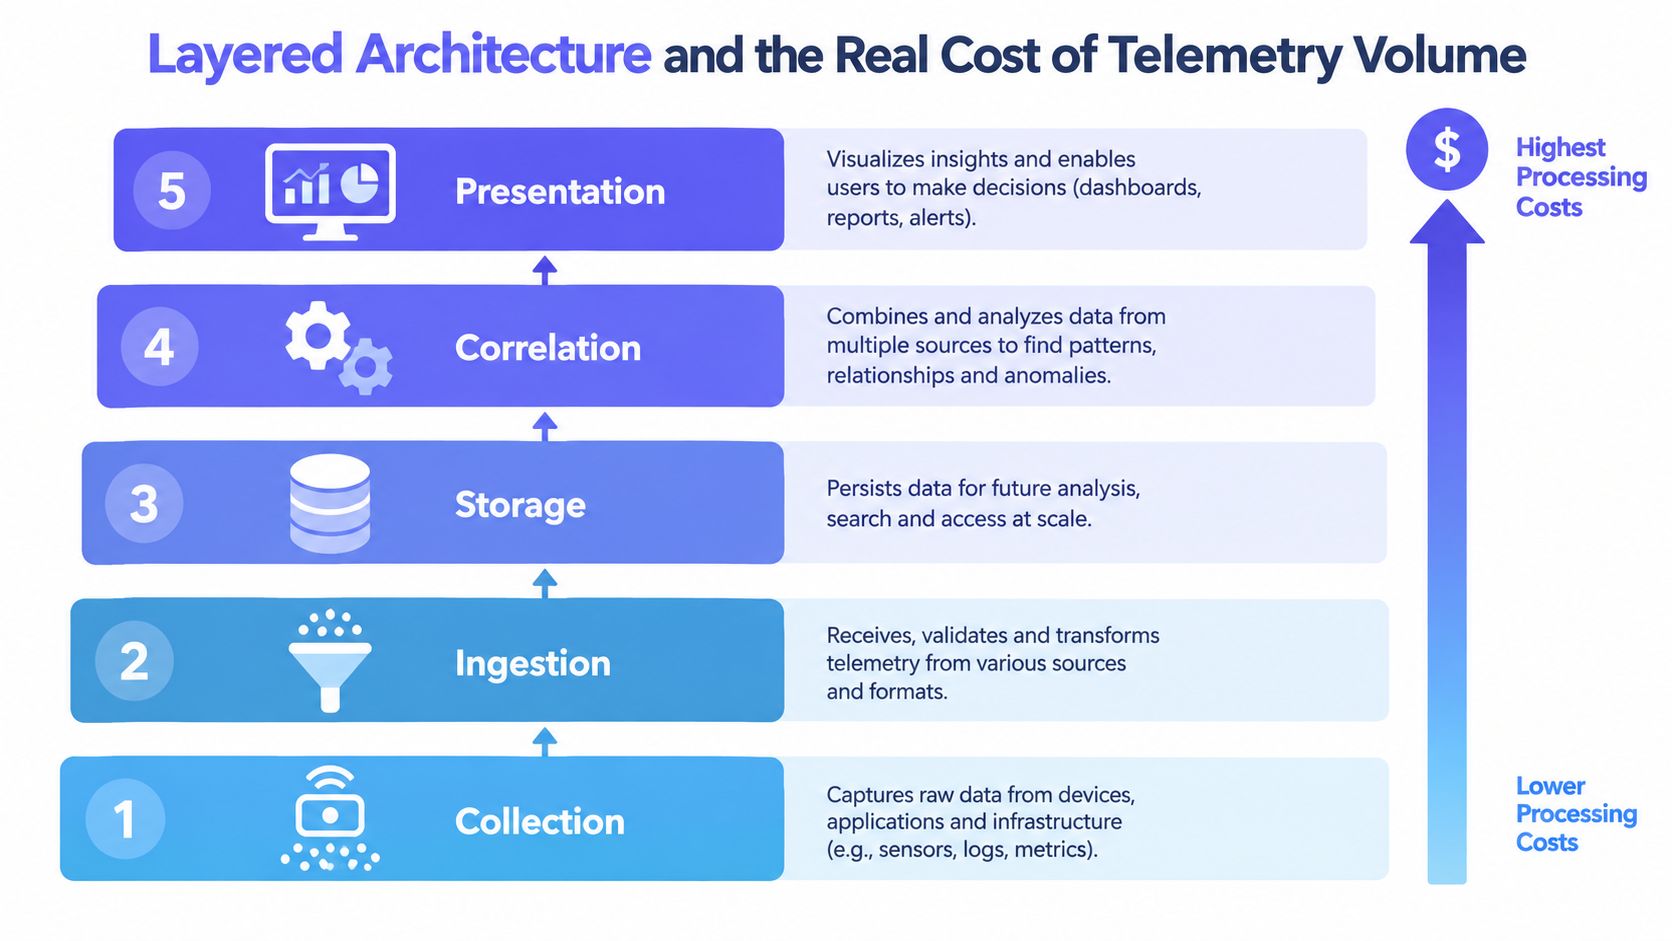
A unified platform usually has five functional layers:
- Collection gathers data from applications, hosts, containers, network devices, probes, and scheduled jobs.
- Ingestion receives, authenticates, normalizes, enriches, filters, and routes telemetry.
- Storage retains metrics, logs, traces, and events according to access and retention needs.
- Correlation connects signals through resource attributes, service identity, timestamps, ownership, and trace IDs.
- Presentation exposes dashboards, queries, alerts, topology, and incident workflows.
The cost pressure begins before presentation. Guidance on OpenTelemetry deployments on Kubernetes identifies ingest volume, unique label combinations, and host count as major scaling and billing factors. The same guidance recommends reducing cardinality at the source through aggregation, attribute truncation, and filtering. Research summarized there reports that a single collector instance can handle up to 15 GB of telemetry per minute while keeping p99 latency under 800 microseconds, illustrating why collector placement and processing policy matter before data reaches the backend.
Where waste enters
A platform can ingest everything and still provide poor observability. High-cardinality labels multiply series, full-fidelity traces consume retention capacity, and verbose logs create search and rehydration costs when incident responders need older data from cold storage. The dashboard isn't the source of that waste. It only makes the consequences visible.
Source-side controls should be explicit:
- Drop rules: Remove known-useless events before export.
- Tail sampling: Keep traces associated with errors, latency outliers, or selected business paths.
- Metric relabeling: Strip unstable or overly specific dimensions.
- Attribute limits: Truncate unbounded strings and reject dangerous dynamic fields.
- Retention tiers: Match fast access to incident needs instead of treating every signal as equally urgent.
A proprietary SaaS platform may couple collection, storage, correlation, and presentation tightly. That can simplify operations, but it can also make pricing and migration behavior harder to predict. OpenTelemetry keeps instrumentation and processing more decoupled, allowing teams to change exporters or introduce a second destination without rewriting every application.
The practical test is simple. At 3 a.m., can an engineer find the relevant failure without wading through data the platform collected merely because it could? A cardinality control strategy should be part of platform design, not a cleanup task after the first unexpected bill.
At the collector, every dropped field is a future query, storage, and paging decision that no longer has to be paid for.
Migration Patterns and Automation-as-Code for DevOps and MSPs
A safe migration keeps the existing monitoring path alive until the replacement has demonstrated equivalent coverage. The most reliable sequence uses the OpenTelemetry Collector beside current agents, then moves traffic and alert ownership in controlled stages.
A four-phase migration
Shadow collection comes first. Deploy collectors alongside Prometheus exporters, infrastructure agents, uptime services, or existing APM agents. Send a limited, representative stream to the candidate platform while preserving current dashboards and pages. During this phase, teams should inventory service names, labels, owners, alert dependencies, retention requirements, and signals that the current stack doesn't collect.
Parallel validation tests parity rather than appearance. Compare alert conditions, timestamps, missing data behavior, aggregation, and notification routing. A dashboard that looks similar isn't enough if a failed scrape, delayed log, or partial trace produces a different operational conclusion.
Cutover should move ownership in small groups. Deduplicate alerts before enabling new pages, retain a rollback path, and cut over services or customers by clear boundaries. MSPs need tenant isolation and customer notification policies validated separately from internal engineering alerts.
Legacy retirement happens only after runbooks, escalation paths, exports, and audit records work from the new system. Remove old exporters and dashboards gradually. Keeping unused agents active indefinitely defeats the cost and maintenance goals of unification.
Automation keeps migration repeatable
Every phase benefits from an API-first operating model:
- Provision tenants through APIs: Create customers, teams, roles, and notification routes consistently.
- Manage resources with Terraform: Store monitors, dashboards, alert policies, integrations, and escalation settings in version control.
- Keep SLOs and runbooks in Git: Review changes like application code and connect alerts to the correct operational documentation.
- Trigger workflows from webhooks: Open Jira or ServiceNow tickets, notify Slack or Microsoft Teams, and start remediation or audit tasks.
- Synchronize customer context: MSPs should connect monitoring identities with the CMDB so ownership and asset metadata don't drift.
Migration duration depends on estate complexity, signal coverage, and available operators. A mid-size estate may need roughly 8 to 12 weeks, while a solo operator may complete a focused transition in 2 to 4 weeks. Those are planning ranges, not guarantees. The work expands when teams discover undocumented alerts, custom exporters, or customer-specific routing.
An all-in-one option such as Fivenines can shorten the shadow and cutover work for MSPs when Linux metrics, uptime, cron tracking, SNMP device health, tenant workflows, API management, and Terraform support belong in the same operating model. Teams planning the infrastructure-as-code layer can also review Terraform infrastructure automation practices before translating existing monitoring resources.
What Still Stays Outside the Single Pane of Glass
The single-pane promise often describes the signals a platform stores well, not every workflow an operations team must execute. Hybrid estates still depend on systems with different polling schedules, identity models, network paths, and ownership boundaries. Industry analysis from IDC on observability platform scope argues that enterprise stacks remain layered across hybrid and multi-cloud environments, which means unification can shift fragmentation instead of removing it.
Synthetic uptime checks commonly remain distinct because external probes need geographic distribution and an independent vantage point. Cron monitoring has a different question, whether a scheduled job completed on time, and needs schedule history rather than continuous service telemetry. Network devices may require SNMP or CLI polling from reachable collectors, while IPMI and hardware sensors can sit outside the application agent's permissions. SaaS status events, ticket updates, chat conversations, and approval workflows also belong to operational context, but they aren't the same as telemetry.
| Telemetry Source | Typical Coverage | Common Gap | Risk If Assumed |
|---|---|---|---|
| External uptime probes | HTTP, TCP, ICMP, or DNS reachability | Limited geography or missing confirmation logic | Internal health looks normal while customers can't connect |
| Cron and scheduled jobs | Success, failure, duration, and lateness | No durable schedule audit trail | Silent data gaps or missed maintenance jobs |
| Network devices | SNMP counters and interface state | Collector reachability, vendor-specific fields | Network faults get misclassified as application failures |
| IPMI and hardware sensors | Temperature, power, storage, and hardware state | Permission and protocol coverage | Hardware degradation remains invisible until outage |
| SaaS status events | Provider incidents and service changes | Webhook depth and identity mapping | External dependency failures appear unexplained |
| Incident workflows | Chat, tickets, approvals, and escalation | Weak ticket loopback or audit history | Alerts close without durable operational ownership |
An RFP should ask for probe geography, SNMP and IPMI collector support, scheduled-job audit history, webhook depth, and ticket loopback. It should also require a clear description of what the platform doesn't ingest, what it only visualizes, and which integrations carry separate retention or licensing rules.
“Single pane” is therefore a scope conversation. A platform may unify metrics, logs, and traces effectively while leaving uptime, cron, device health, and response workflows partially external. Buyers should judge those boundaries against their actual runbooks instead of accepting the label as finished architecture.
Choosing a Unified Observability Platform That Fits Your Team
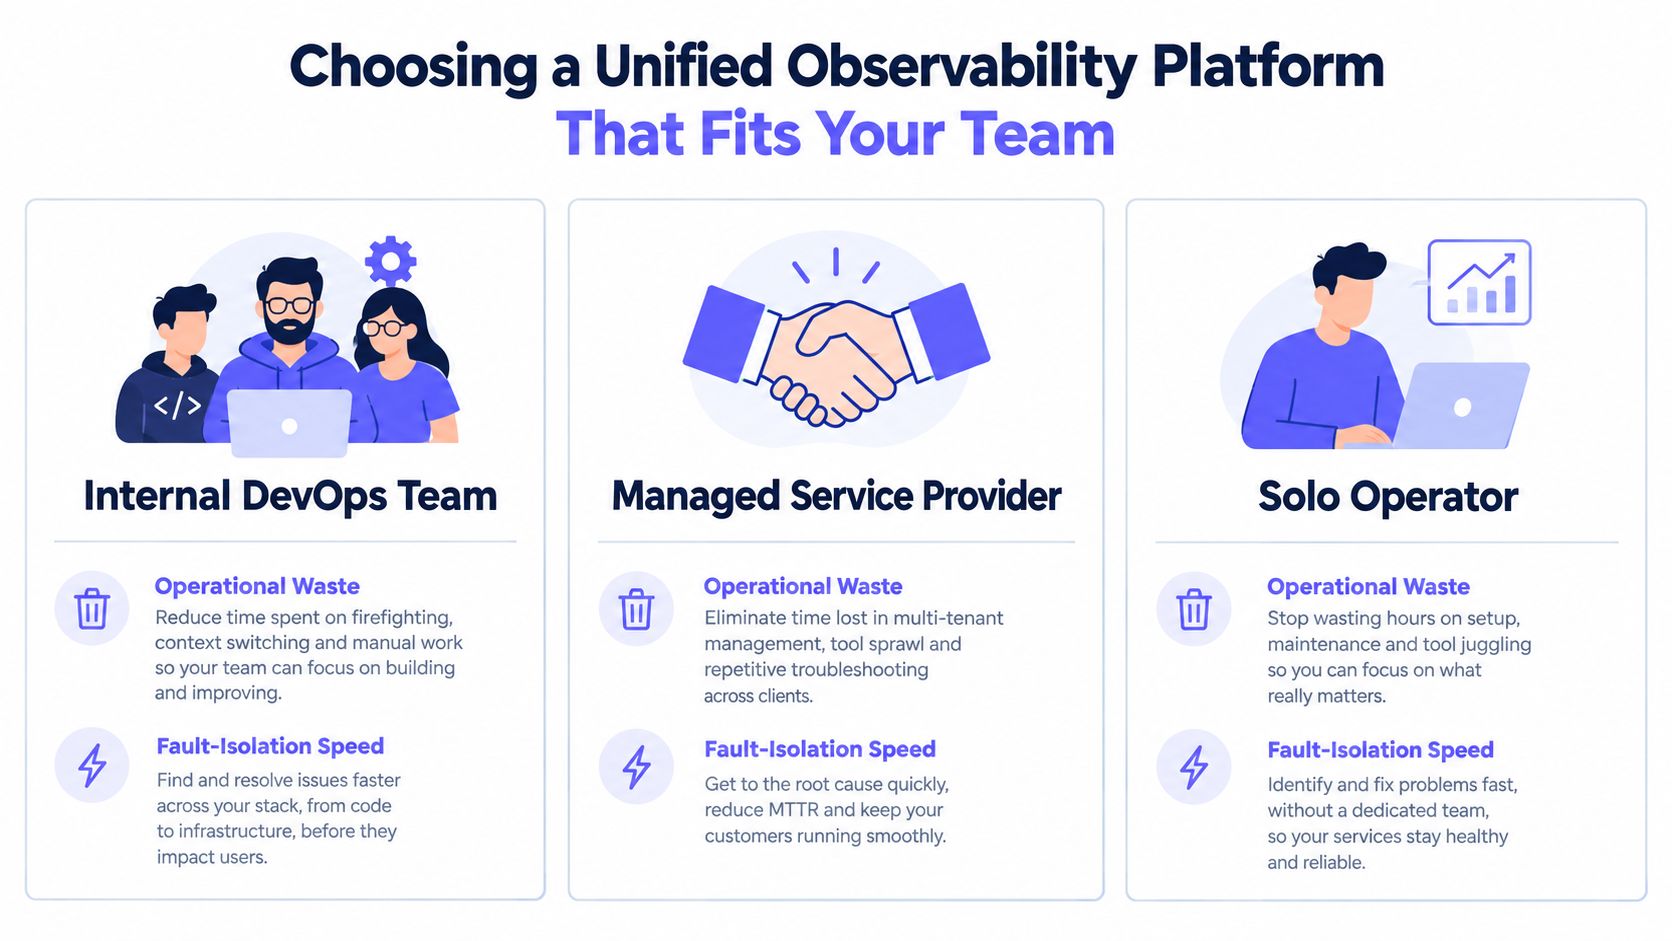
The right platform depends on who carries the pager and what remains outside the application stack. An internal DevOps team operating Kubernetes at scale may prioritize OpenTelemetry compatibility, source-side reduction, cardinality controls, query depth, and ingestion economics. An MSP managing many customer environments will care more about tenant isolation, delegated access, customer reporting, asset ownership, and repeatable provisioning. A solo operator needs dependable uptime, cron, and device visibility without building a small observability company on the side.
Weight the decision by operational waste
For an internal platform team, the evaluation should focus on whether the system preserves Prometheus flexibility while reducing cross-signal investigation time. API coverage, Terraform support, audit trails, SLO mathematics, and migration paths for PromQL should be tested with real dashboards and alerts, not just vendor demonstrations.
For an MSP, tenancy is the center of gravity. The platform should separate customer data, permissions, notifications, branding, and reporting while still allowing operators to see fleet-wide patterns. A customer-facing status workflow and CMDB synchronization can matter more than another visualization type.
For a solo operator or small hosting team, breadth at the edge is often more valuable than deep customization. Fivenines combines Linux server metrics, network device health through SNMP, website uptime, cron monitoring, alert routing, dashboards, a REST API, and Terraform support in one dashboard. That makes it an option for teams that would otherwise maintain separate infrastructure, uptime, and scheduled-job tools.
A buying test should include these questions:
- Can the collector reduce data before export?
- Can teams set and enforce cardinality limits?
- Are dashboards, alerts, tenants, and notification policies manageable as code?
- Does every alert retain an audit trail and an owner?
- Can the platform model external uptime and scheduled-job SLOs?
- How quickly can a new host, customer, device, or service become observable?
- Does the price model reward useful signal selection rather than unrestricted ingestion?
The decision should end with an incident rehearsal. Give each candidate a metric anomaly, a correlated application error, a failed external check, and an affected device. Measure how many pivots the responder needs, how much irrelevant data appears, whether ownership is clear, and whether the alert closes the loop into the ticketing system.
Choose the platform that removes pages and manual joins from the runbook, not the one with the longest feature list.
Fivenines brings Linux metrics, uptime checks, cron monitoring, SNMP device health, alert routing, dashboards, API access, and Terraform management into one operational workflow for DevOps teams, MSPs, and solo operators. Visit Fivenines to evaluate whether its signal coverage and automation model fit the gaps left by the current monitoring stack.