Switch Monitoring That Actually Catches Problems Early

A green switch dashboard can still be lying to the operations team. Link state, CPU, memory, temperature, and successful SNMP polls confirm that a device is answering, but they don't prove that traffic is reaching its destination cleanly. Microbursts, packet drops, oversubscribed uplinks, path problems, and queue pressure can damage service while every important tile remains green.
Effective switch monitoring is therefore less about collecting every available metric and more about building a deliberate signal pipeline. Port role, historical baseline, telemetry choice, threshold design, and alert suppression matter more than a crowded dashboard. Cisco's documentation describes RMON History as recurring collection of Ethernet statistics with stored samples for later analysis, while HPE Aruba documents queue sampling every 10 seconds with history views covering the last 8 hours or previous 5 minutes. That progression, from simple counters to time-series visibility, gives operators the context needed to recognize deterioration before an outage becomes obvious. Cisco's RMON History documentation shows why recurring history remains useful in production.
Table of Contents
- Why a Green Switch Dashboard Does Not Mean a Healthy Network
- Choosing the Right Telemetry Protocols for Your Environment
- Enabling SNMPv3 Without Overloading the Switch
- Turning on Flow Data and Setting Port-Aware Thresholds
- Designing Alerts That Page You Only When It Matters
- Troubleshooting Missing Data and Stale Counters
- Wiring Switch Monitoring into Your Existing Stack
Why a Green Switch Dashboard Does Not Mean a Healthy Network
“Device is up” is a reachability test, not a health assessment. A switch can respond to SNMP, report normal CPU usage, and show every interface as operational while a trunk queue drops traffic under a short burst. The same dashboard can miss a path problem caused by asymmetric routing or an ACL that shadows the rule operators expected to handle a flow.
That distinction changes how a network team should investigate incidents. A port-up check answers whether the physical or logical interface is active. It doesn't answer whether the port is forwarding the right traffic, whether queues are draining, or whether packets are being discarded somewhere along the path. A dashboard that treats those questions as equivalent creates false confidence.
A useful mental model starts with role classification:
- Access ports connect endpoints and usually need error, discard, broadcast, and state monitoring.
- Trunk ports carry multiple VLANs, so topology, CRC behavior, input drops, and traffic balance matter more than a generic utilization tile.
- Uplinks deserve close attention to saturation, queue behavior, and short-lived bursts.
- Server and access-point ports need baselines that reflect their workload instead of inheriting thresholds designed for ordinary user links.
Practical rule: Alert on deviation from expected behavior for the port's role, not on a universal threshold copied across the chassis.
SNMP remains valuable because it exposes state and counters. Flow data adds traffic truth by showing conversations and volume, while streaming telemetry can reveal rate changes without waiting for the next polling cycle. None of these signals is sufficient on its own. The design challenge is selecting a small combination that explains what users are experiencing without turning the switch or collector into another source of noise.
Teams that want the broader operational context can use this explanation of what network monitoring covers before designing switch-specific dashboards. The important distinction is simple: a healthy switch isn't necessarily a healthy forwarding path.
Choosing the Right Telemetry Protocols for Your Environment
Protocol selection should begin with the question the operator needs answered. SNMP asks, “What is the device and interface state?” NetFlow asks, “Who is communicating with whom, and how much traffic is involved?” sFlow asks for a scalable sample of packet behavior, while gNMI and streaming telemetry provide a more continuous view of modeled counters and changing conditions.
SNMPv3 remains the practical foundation for inventory, interface counters, hardware health, and configuration-adjacent state. SNMP-based monitoring is still embedded in enterprise networks. A 2026 industry summary reports that over 90% of enterprise switches support SNMP, and identifies SNMP as the primary protocol for 74% of network monitoring implementations. The SNMP statistics summary also describes a security shift toward SNMPv3, including a claim that 75% of network monitoring tools in a 2023 Gartner Magic Quadrant supported SNMPv3 exclusively or primarily. Those figures make SNMPv3 a realistic compatibility choice, not merely a legacy fallback.
NetFlow, IPFIX, and related flow records are appropriate when the incident involves traffic identity. They can expose a noisy application, an unexpected source, or an overloaded destination that interface counters alone can't explain. On edge switches, detailed records can create collector and device overhead, so flow export should be enabled selectively.
sFlow samples packets and can scale well on high-capacity switching platforms where generating a detailed record for every conversation would be excessive. Sampling reduces detail, so it isn't a substitute for exact accounting when the investigation requires complete flow records.
gNMI and streaming telemetry fit modern network operating systems that expose YANG-modeled data. They can provide near-real-time counter changes without relying on repeated manager polling, but they introduce collector, schema, and operational dependencies that mixed hardware environments may not handle consistently.
| Protocol | Primary use | Data granularity | Switch CPU cost | Best paired with |
|---|---|---|---|---|
| SNMPv3 | State, counters, inventory, health | Periodic samples | Usually low when scoped | NetFlow or sFlow |
| NetFlow, IPFIX | Conversation and traffic identity | Flow records | Variable, potentially high | SNMPv3 |
| sFlow | Scalable sampled packet visibility | Packet samples | Designed for scale | SNMPv3 |
| gNMI | Modeled counters and state streams | Near-real-time updates | Depends on implementation | SNMPv3 for legacy coverage |
| Streaming telemetry | Continuous selected metrics | Streamed updates | Depends on subscriptions | SNMPv3 for broad compatibility |
A sound default is two protocols maximum, one for state and one for traffic behavior. A smaller environment may use SNMPv3 alone until a real traffic question appears. A larger mixed-vendor network often benefits from SNMPv3 plus sFlow or flow export. Teams working with current NOS platforms can pair SNMPv3 with gNMI, but shouldn't enable every protocol just because the chassis supports them. For background on how MIBs shape collection, this guide to SNMP and MIBs provides useful grounding.
Enabling SNMPv3 Without Overloading the Switch
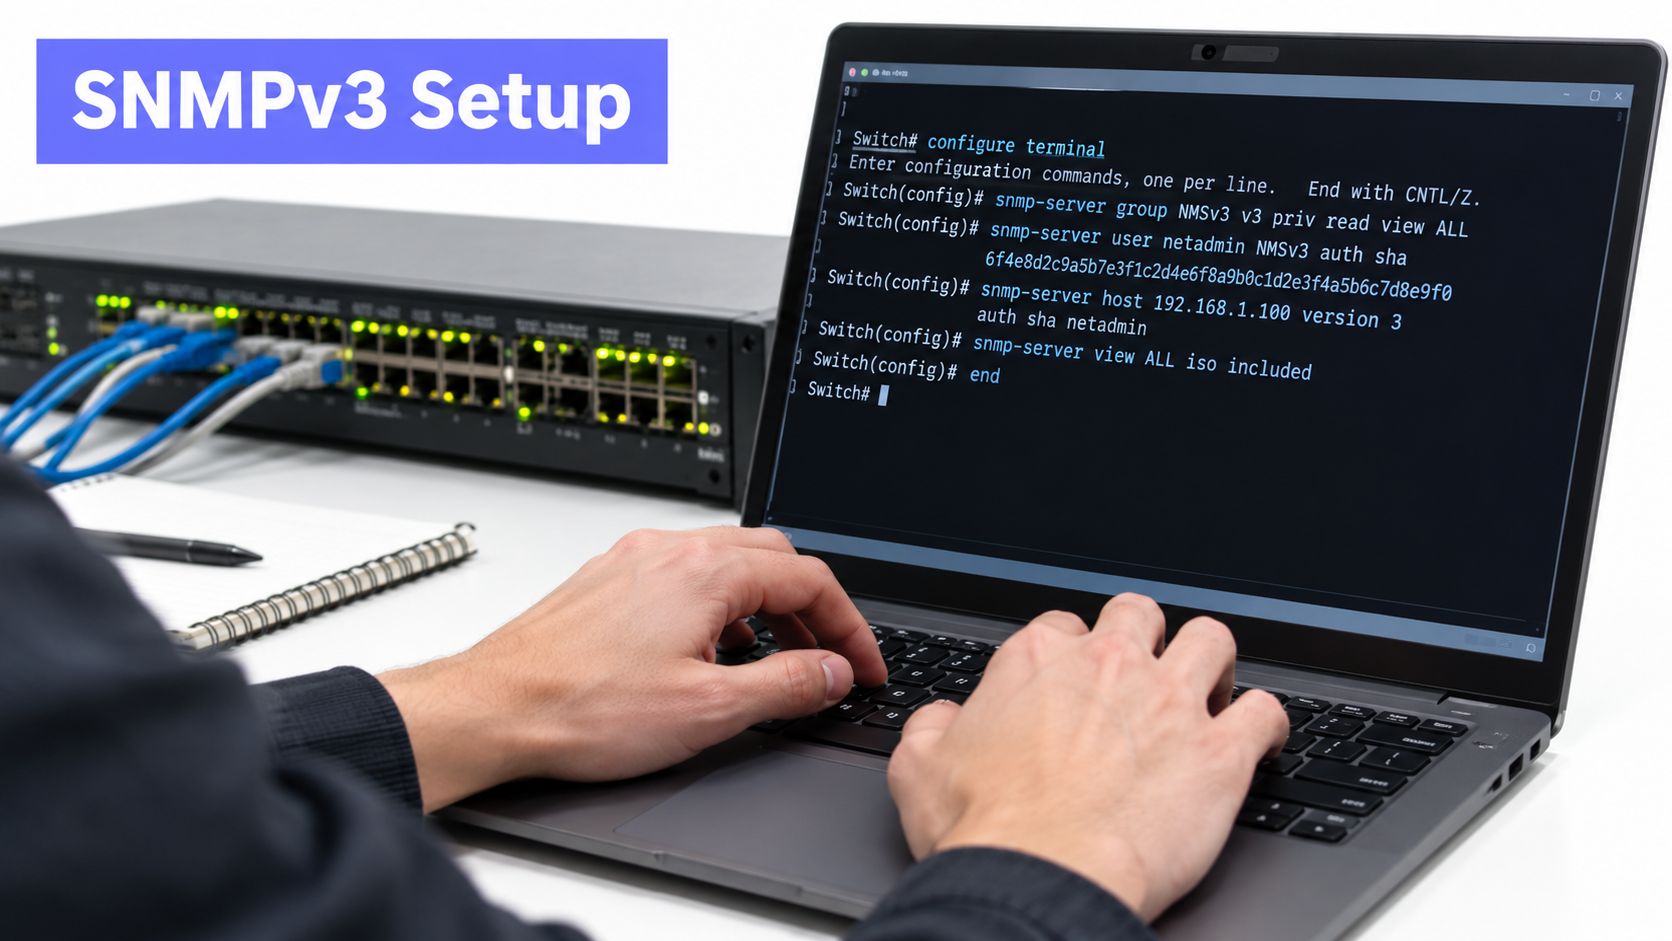
SNMPv3 should be configured as a narrow, read-only service rather than an unrestricted management interface. The exact syntax varies by platform and release, so the examples below are templates that require validation against the device's command reference and existing security policy.
Build the access model first
The intended sequence is consistent across vendors:
- Create a read-only group using authentication and privacy.
- Limit the view to the system and interface trees required by the monitoring platform.
- Restrict permitted source addresses with an access list or firewall policy.
- Bind the service to the management VRF or intended source interface.
- Test one known OID before starting broad discovery.
On IOS-XE, a representative configuration can look like this:
snmp-server view NMS-VIEW iso included
snmp-server group NMS-GROUP v3 priv read NMS-VIEW access NMS-SOURCES
snmp-server user NMS-USER NMS-GROUP v3 auth sha AUTH_PASSWORD priv aes 128 PRIV_PASSWORD
ip access-list standard NMS-SOURCES
 permit <NMS-SOURCE>
snmp-server community UNUSED deny
snmp-server trap-source <MANAGEMENT-INTERFACE>
The placeholder values must be replaced with approved credentials and management objects. The view should be narrowed further where the platform allows separate inclusion of ifXTable and system MIB branches. Junos and ArubaOS-CX use different syntax and privilege models, so operators should apply the same design rather than copy IOS commands directly.
A view that exposes only required interface and system data reduces unnecessary collection and limits what a compromised monitoring credential can read. Source restrictions add another control, but they don't replace authentication, privacy, logging, or credential rotation.
Test collection before widening it
From the NMS host, test a single interface counter and a system object with snmpwalk or the platform's equivalent. An empty response can mean a restricted view, unsupported MIB, incorrect context, or a vendor-specific implementation difference. A timeout points more often to reachability, ACL, firewall, VRF, or credential problems.
Polling frequency should follow operational criticality and device capacity. Current guidance recommends avoiding intervals faster than the device can reliably answer, with examples ranging from 30 to 60 seconds for critical devices and 120 to 300 seconds for less critical devices. ManageEngine's switch monitoring guidance describes that balance between visibility and device safety.
The commonly repeated claim that a fixed polling load costs the same as an unrelated routing process cannot be treated as a verified universal rule. Device CPU impact depends on hardware, software release, OID count, response size, and concurrent management activity. A defensible operating pattern is state polling at 60 to 300 seconds, with shorter collection reserved for critical uplinks after measurement, while scheduled bulk walks handle inventory or discovery outside the live polling engine.
Turning on Flow Data and Setting Port-Aware Thresholds
Interface utilization is a poor universal alarm. An access port that briefly reaches a high rate may be normal for a workstation or wireless access point, while a trunk that reaches the same level may indicate a serious capacity problem. Thresholds need a role, a baseline, and an action attached to them.
On Cisco IOS-XE, the flow configuration usually includes a record, exporter, monitor, and interface attachment. A simplified pattern is:
flow record EDGE-RECORD
 match ipv4 source address
 match ipv4 destination address
 match ipv4 protocol
 collect counter bytes long
 collect counter packets long

flow exporter FLOW-COLLECTOR
 destination <COLLECTOR>
 transport udp <FLOW-PORT>

flow monitor EDGE-MONITOR
 record EDGE-RECORD
 exporter FLOW-COLLECTOR
 cache timeout active 60

interface <EDGE-INTERFACE>
 ip flow monitor EDGE-MONITOR input
Arista EOS uses sFlow concepts such as an agent address, destination, polling interval, and sample rate. A representative pattern is:
sflow enable
sflow sample 4096
sflow polling-interval 30
sflow destination <COLLECTOR> <SFLOW-PORT>
The values need to match the switch model, collector, and traffic profile. A 1-in-4096 sample rate is a configuration example, not a universal recommendation. Sampling density should be tested against link capacity and the level of detail required for investigations. Flow export on edge interfaces can reveal conversations, while sFlow can provide scalable packet samples on high-capacity platforms.
Set alarms around behavior
A practical matrix can begin with qualitative baselines, then add numeric thresholds only after the network has established normal patterns. The table below intentionally avoids invented universal limits.
| Port role | Utilization | Error rate | Broadcast % | CRC delta vs baseline | Microburst |
|---|---|---|---|---|---|
| Access | Alert on sustained deviation from the endpoint baseline | Alert on a new or rising error condition | Alert when materially above the port's normal pattern | Investigate any new CRC increase | Usually dashboard or correlated alert |
| Trunk | Compare sustained load with normal VLAN and traffic behavior | Alert on persistent drops or errors | Watch for abnormal broadcast growth | Alert on a clear upward deviation | Correlate with queue and discard data |
| Uplink | Alert on sustained saturation risk, not a single peak | Page only when errors affect forwarding | Monitor abnormal broadcast amplification | Escalate when the trend is persistent | High priority when queue drops or latency symptoms align |
Operators should pair flow records with network traffic monitoring practices so a utilization alert leads to an answer, not merely another graph. The useful question is whether a port is behaving differently from its own history and role. That approach catches degradation without paging on every legitimate burst.
Designing Alerts That Page You Only When It Matters
At three in the morning, alert quality becomes an engineering test. A fiber flap once generated thousands of interface-down notifications before the actual root cause became visible. The failure wasn't a lack of monitoring. The failure was that the alert system treated every dependent port as an independent incident.
Collapse the incident tree
Dependency grouping should reflect the topology. If a core switch becomes unreachable, access-layer interfaces beneath it shouldn't page the on-call as separate failures. The monitoring platform needs parent-child relationships, maintenance states, and suppression rules that stop downstream symptoms from competing with the primary event.
Maintenance windows must suppress event generation or routing, not merely hide red tiles from a dashboard. A hidden alert still consumes attention later, and delayed notification can make a planned change look like an unexplained outage.
Flapping interfaces need deduplication. A short suppression window, commonly configured between 2 and 5 minutes, can combine repeated state changes into one actionable event. That interval should be tuned to the environment, because a long suppression period can conceal a real fault on a critical link.
A page should identify the likely action, the affected dependency, and the runbook. If it only says “interface down,” it isn't finished.
Severity tiers prevent low-value counters from competing with service-impacting failures:
- Page: A stopped trunk, unreachable core device, sustained uplink loss, or correlated packet-loss condition.
- Ticket or team notification: Persistent errors on a server or access point, abnormal queue drops, or a baseline deviation that needs investigation.
- Dashboard only: An isolated discard with no service symptom, a short-lived utilization peak, or a single minor counter change.
Real-time alerting guidance is useful when designing the delivery path, but the alert policy still needs local judgment. A platform can route events quickly; it can't decide whether a particular access port matters at three in the morning.
Review alerts by their consequences
Every alert should survive a simple review:
- Remove alerts that fired repeatedly without producing an action during the last review period.
- Merge events that describe the same failure through different symptoms.
- Add dependency suppression for infrastructure parents.
- Require a runbook link on every page.
- Test maintenance handling and flap behavior during a controlled change.
The strongest alert set is usually small and uneventful. It wakes the right person for a failure that needs immediate intervention, while the rest of the telemetry remains available for diagnosis.
Troubleshooting Missing Data and Stale Counters
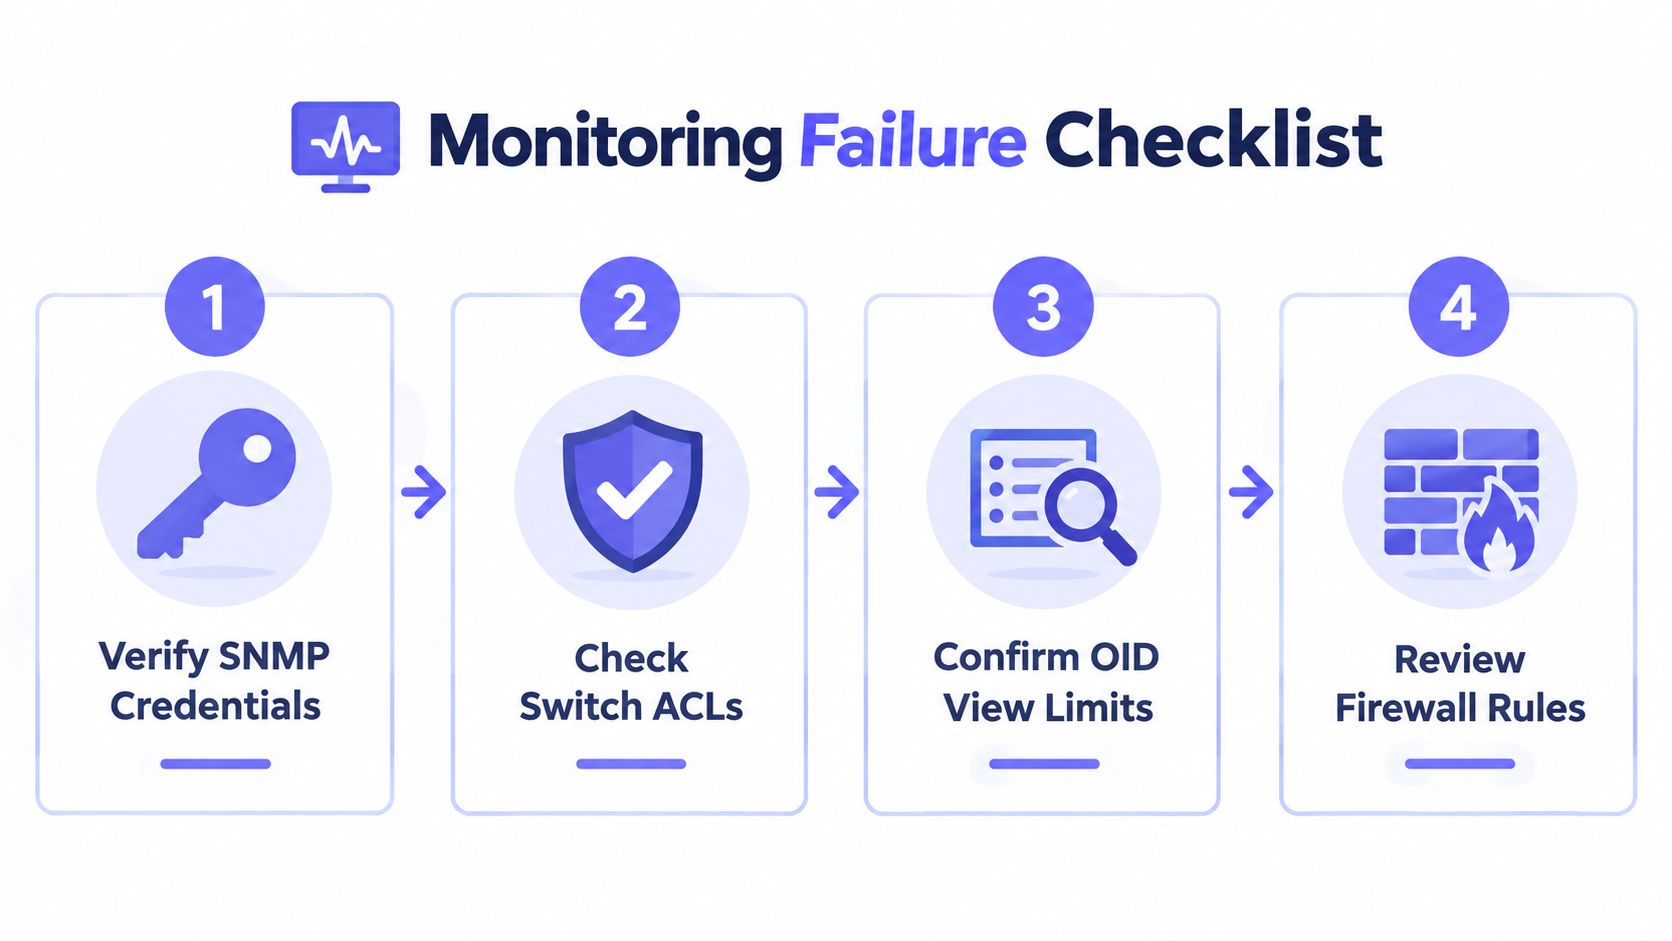
Missing switch data usually has a mundane cause. A fixed sequence prevents operators from jumping straight into MIB debugging when the collector can't reach the device.
Check the collection path in order
Start with the four-way handshake:
- Credentials: Confirm the SNMPv3 username, authentication method, privacy method, and passwords match the switch.
- ACL reachability: Verify that the collector's source is permitted by the switch's management ACL.
- Transport port: Confirm the intended service and firewall path. SNMP commonly uses UDP 161, NetFlow commonly uses UDP 2055, sFlow commonly uses UDP 6343, and gNMI commonly uses TCP 57400. These port assignments are protocol conventions, not proof that a particular deployment uses them.
- MIB and view: Check that the requested OID exists, is supported by the vendor image, and isn't excluded by the SNMP view.
If charts flatten on a busy interface, inspect whether the collector is using the 64-bit ifHCInOctets and ifHCOutOctets objects from ifXTable. Older 32-bit octet counters can wrap on high-rate links, producing a misleading flat or irregular graph. A manual query from the collector host separates a switch-side response problem from a parser, scheduling, or dashboard problem.
Validate identity and time
Topology errors can look like missing telemetry. Check for duplicate device identities, renamed sysName values, stale discovery records, and mismatches between CDP or LLDP neighbors and the monitoring inventory. If a port is mapped to the wrong asset, the data may be present but operationally useless.
Correlate the collector timeline with syslog and check NTP alignment. A clock skew can make fresh counters appear stale or place an event outside the incident window. The final verification should pull one known OID manually, record the response and timestamp, and then trace that value through the collector into the dashboard.
Wiring Switch Monitoring into Your Existing Stack
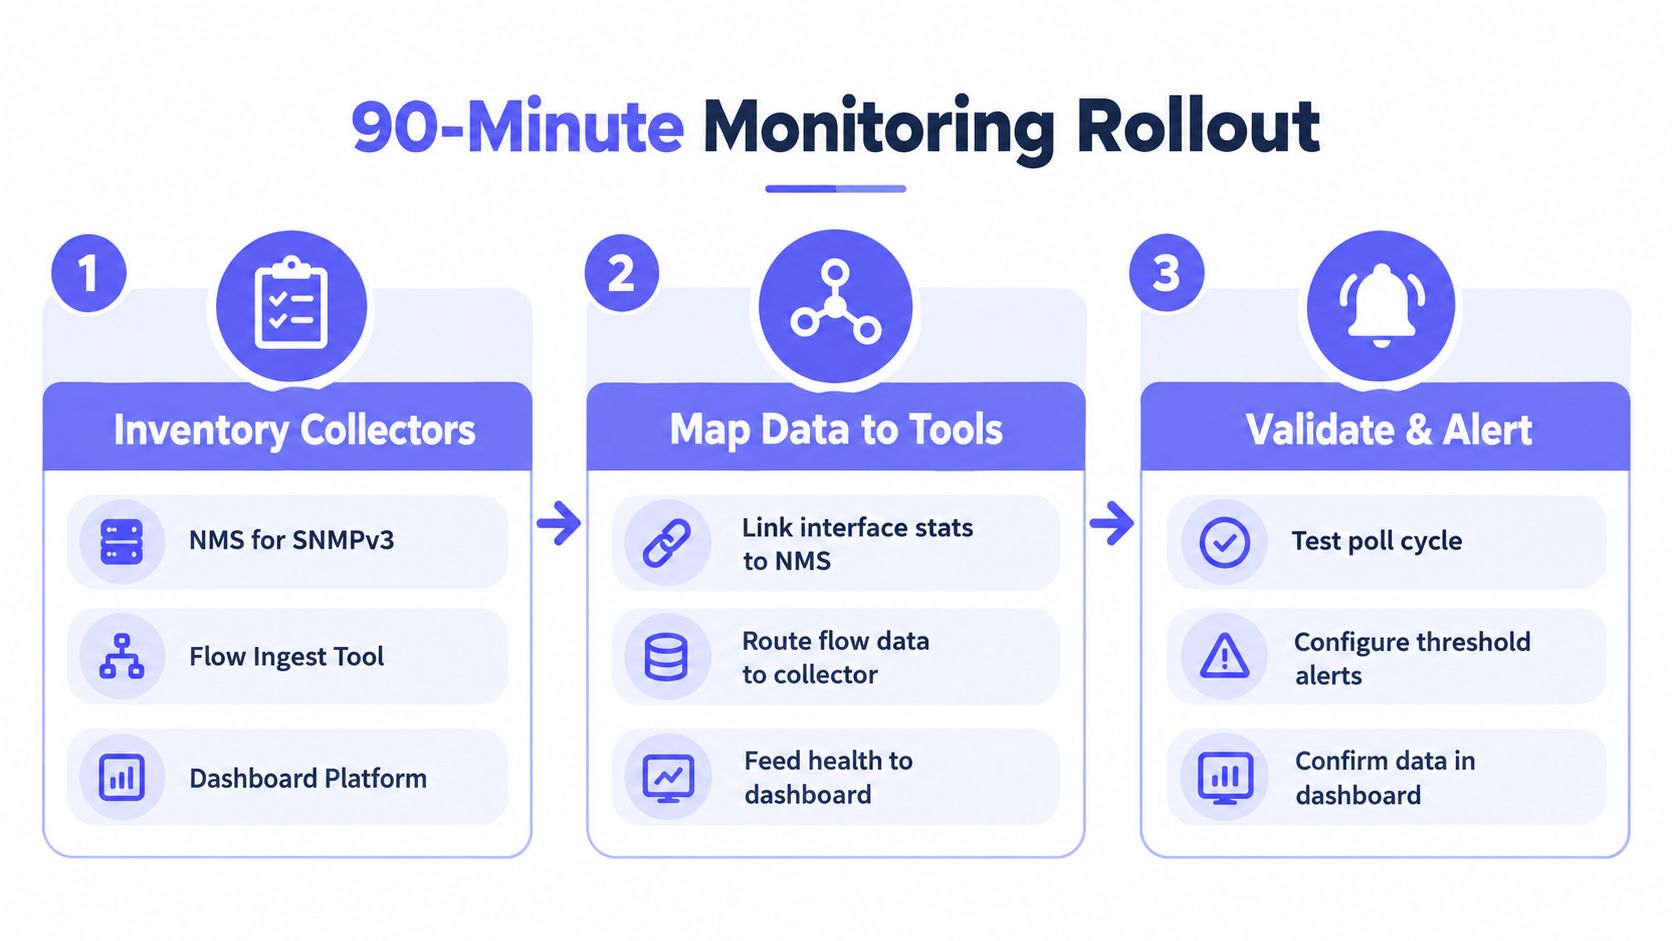
Switch monitoring doesn't require a parallel observability rebuild. A focused rollout can begin by inventorying the collectors already in use, identifying which NMS polls SNMPv3, which system receives flow records, and where operators view incidents.
Use the existing data paths
The first pass should map each signal to one destination:
- SNMPv3 state: Send interface, system, and hardware metrics to the existing NMS.
- Flow data: Route NetFlow, IPFIX, or sFlow to the collector already used for routers where possible.
- Streaming data: Normalize gNMI or other telemetry into the metric format expected by existing dashboards.
- Alert delivery: Reuse established escalation routes instead of creating a switch-only channel.
Tags should carry switch identity, interface identity, and port role. Those labels let dashboards correlate an uplink's traffic with the dependent access layer without forcing the operator to search separate systems.
Spend the rollout on signal quality
The rollout should finish with a test poll, a flow export check, a role-aware dashboard, and one controlled alert. Useful views include port-role heatmaps, baseline deviation panels, uplink utilization trends, queue drops, and dependency-aware incident lists.
Teams comparing platforms can also review how to choose the right monitoring setup when they need to balance protocol coverage, security controls, and operational complexity. The point isn't to replace every existing tool. It's to remove duplicate polling jobs, retire dashboards nobody uses, and give operators one path from symptom to cause.
Fivenines supports SNMP device monitoring with interface traffic, CPU, memory, temperature, health checks, and alerting, so it can fit into a consolidated infrastructure view where those capabilities match the environment. The resulting system should be judged by the quality of its pages and investigations, not by the number of metrics stored.
Fivenines brings switch health and interface telemetry into the same dashboard as infrastructure monitoring, with SNMP collection and alerting for teams that want fewer disconnected views. Visit Fivenines to evaluate whether its switch monitoring workflow fits the port-role, baseline, and suppression model described here.