Memory Usage Monitoring for Linux and Containers

A Linux host can show almost no free RAM while applications continue running normally. A container can look modest at the process level, then hit its cgroup limit and get killed. A GPU worker can have plenty of system memory available while its VRAM is exhausted. These incidents happen because memory usage monitoring is often reduced to one misleading number.
Reliable operations start by separating headroom, ownership, pressure, and enforcement. Host metrics explain whether the kernel can satisfy demand. RSS and PSS help identify the process responsible. Cgroup statistics show what a container is allowed to consume, while GPU telemetry covers a separate memory domain. Alerting then needs to distinguish harmless cache use from sustained contention.
Table of Contents
- Decoding Linux Memory Metrics and Headroom
- Isolating Process and Container Memory Consumption
- Deploying Lightweight Telemetry Agents
- Setting Alerting Thresholds and Escalation Paths
- Troubleshooting Memory Leaks and OOM Events
- Choosing Between DIY Stacks and Unified Platforms
Decoding Linux Memory Metrics and Headroom
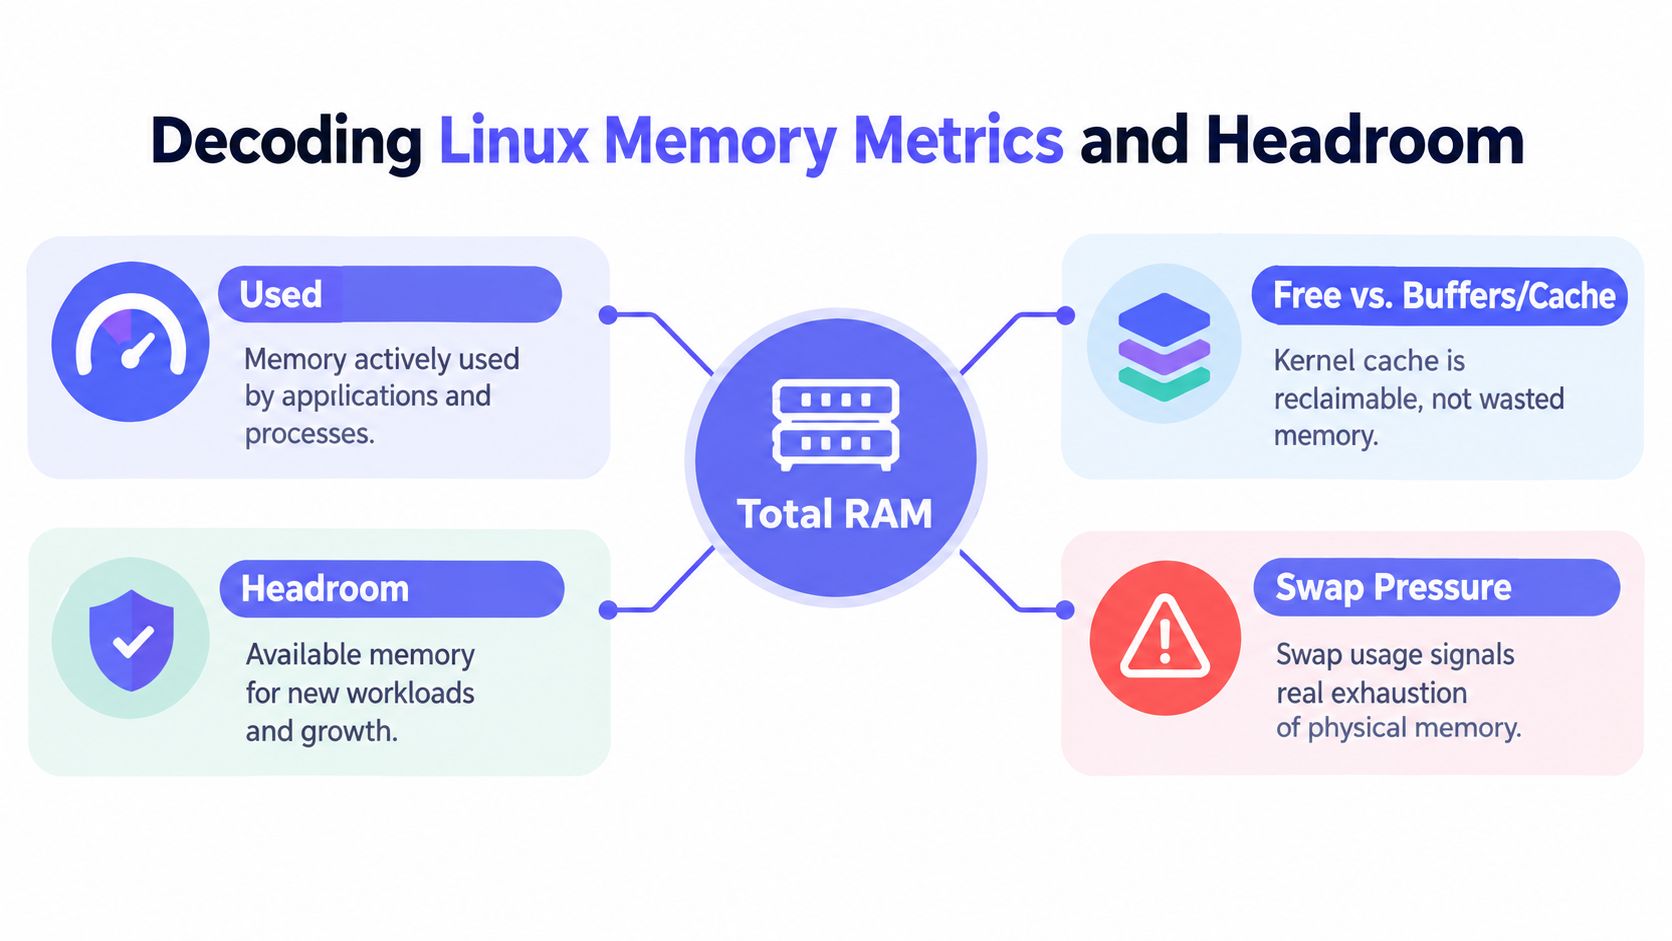
The free column is one of the most commonly misread Linux metrics. A low value doesn't automatically mean the machine is close to failure. Linux uses available RAM for filesystem and block-device caches, so memory that appears “used” may still be reclaimable when an application requests it.
The useful distinction is between free memory, buffers and cache, and available memory. free reports a snapshot that includes total, used, free, shared, buffer/cache, and available RAM, as well as swap. The top command provides a live process view, while vmstat reports system-wide virtual memory and paging activity. These remain foundational tools for Linux memory usage monitoring, as documented in Oracle Linux guidance for reviewing system resource statistics.
Why available memory matters
MemAvailable is the practical headroom signal. It estimates how much memory the kernel can provide to new workloads without forcing the system into swapping. The free figure only tells operators how much RAM isn't currently allocated, which makes it a poor standalone basis for an alert.
A useful validation routine is straightforward:
- Run
free -hfor a readable summary. - Confirm the kernel's value in
/proc/meminfo. - Trend
vmstatrather than interpreting one sample. - Check paging activity before treating cache as a fault.
The distinction matters during incidents. A host with little free RAM but healthy MemAvailable and no continuing paging may be operating normally. A host with falling MemAvailable, persistent paging, and rising pressure is telling a different story.
Practical rule: Treat cache as a reclaimable working set until paging, pressure, or application symptoms show that the kernel can't reclaim enough memory.
From snapshots to history
A single command helps answer “what is happening now?” It can't reliably answer “when did this begin?” or “does this process grow after every deployment?” Time-series collection changes the investigation. sysstat records memory data with sar -r, including kbmemfree, kbavail, kbmemused, and %memused. sar -B adds page-ins, page-outs, page faults, and major faults.
That history exposes gradual leaks, workload changes, and fragmentation that a post-failure snapshot can hide. Operators who need broader context can also compare this workflow with server monitoring practices for Linux infrastructure, while keeping the kernel's own signals as the source of truth.
Isolating Process and Container Memory Consumption
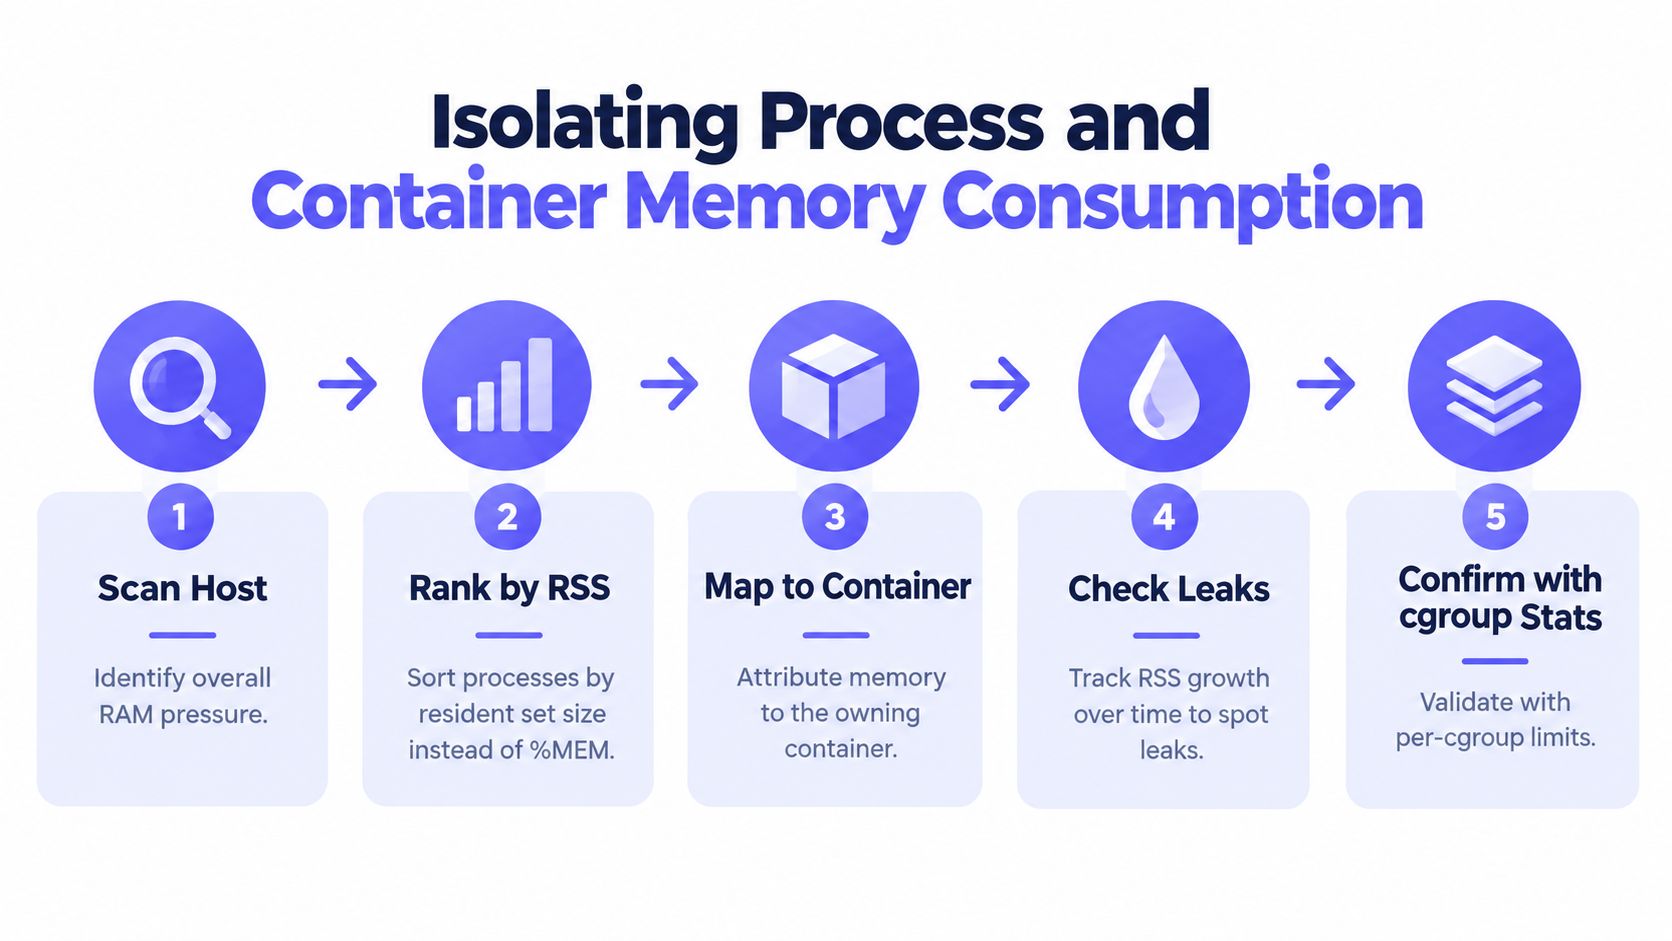
Once a host shows genuine pressure, the next question is ownership. top and ps are useful for finding candidates, but %MEM alone can mislead because several processes may map the same shared libraries.
RSS, PSS, and memory maps answer different questions. RSS shows the physical memory mapped into a process. PSS apportions shared pages across processes, making it more useful when many workers use the same runtime or libraries. A process with a large RSS value isn't necessarily the sole owner of all those pages.
A practical ownership workflow
Start with the trend, not the most dramatic snapshot. Identify the PID whose RSS grows over time, compare it with peer processes, and then inspect how much of that footprint is shared or private.
- Rank candidates by RSS: Use
toporpsto find resident growth, but don't declare a leak from%MEM. - Measure proportional ownership: Use
smemor/proc/<pid>/smapsto separate private pages from shared pages. - Validate the map: Use
pmapor an application profiler before assigning the defect to a heap, allocator, or library. - Compare peers: A worker that grows while equivalent workers remain stable deserves closer inspection.
- Keep a time dimension: Long-running services need instrumentation before symptoms become an outage.
The Linux process memory command reference describes this combined RSS, PSS, and memory-map approach. It also highlights why pre-deployment profiling, CI/CD leak checks for compiled code, and containment limits belong in the operating model.
Containers change the boundary
A host view can hide the operational limit that matters to a container. Cgroups define the memory boundary applied to a workload, so monitoring should include current usage, configured limits, reclaim behavior, and termination events for each cgroup. A process may appear acceptable against host RAM while approaching the limit imposed by its container.
Noisy-neighbor control becomes concrete here. Per-container telemetry lets operators distinguish a host-wide shortage from one service consuming its allocation, and it gives responders a direct path from a killed workload to the owning deployment.
GPU workloads need the same treatment. NVIDIA GPU memory is separate from ordinary system RAM, so machine-learning and rendering hosts should collect VRAM allocation and utilization alongside cgroup and host metrics. Otherwise, an inference worker may be blamed for a Linux RAM problem when the actual failure is GPU memory exhaustion.
Deploying Lightweight Telemetry Agents
A memory monitor shouldn't become another memory consumer that operators need to explain. Complex pull-based systems can provide powerful querying, but they also introduce scrape management, exposed endpoints, storage operations, and another set of components to maintain.
A lightweight push agent offers a different trade-off. The host collects local kernel, process, container, and device data, then sends selected telemetry securely over HTTPS. That design avoids inbound firewall openings and reduces reliance on remote command paths, which is useful across private networks, cloud instances, and customer environments.

Keep collection intentional
The agent should collect signals that support a decision, not every metric the operating system exposes. A practical configuration separates host headroom from workload ownership:
- Host layer:
MemAvailable, swap activity, paging, and PSI memory pressure. - Process layer: RSS, PSS where available, process identity, and restart state.
- Container layer: cgroup usage, limits, throttling or reclaim behavior, and termination events.
- Accelerator layer: GPU memory allocation and device health for NVIDIA workloads.
- Context layer: hostname, environment, service, container, and customer or tenant labels.
Collection intervals should match the failure mode. Fast-moving OOM incidents need enough resolution to preserve the sequence of events, while slow leaks benefit more from consistent history than from noisy high-frequency samples. Filtering unused metrics keeps the agent's footprint and the resulting data volume under control.
A focused implementation can be easier to operate than a sprawling Prometheus stack, especially for teams that don't need arbitrary metrics ingestion or custom query logic. The operational considerations in lightweight Docker monitoring without unnecessary overhead are relevant when container visibility is the main requirement.
The following video provides a visual introduction to telemetry collection and infrastructure monitoring concepts:
Security still matters with push telemetry. Agents need scoped credentials, encrypted transport, controlled update paths, and clear tenant separation. Operators should also test the failure mode where the telemetry endpoint is unavailable. Local buffering, bounded retries, and explicit stale-data indicators are preferable to presenting old memory values as current without notice.
Setting Alerting Thresholds and Escalation Paths
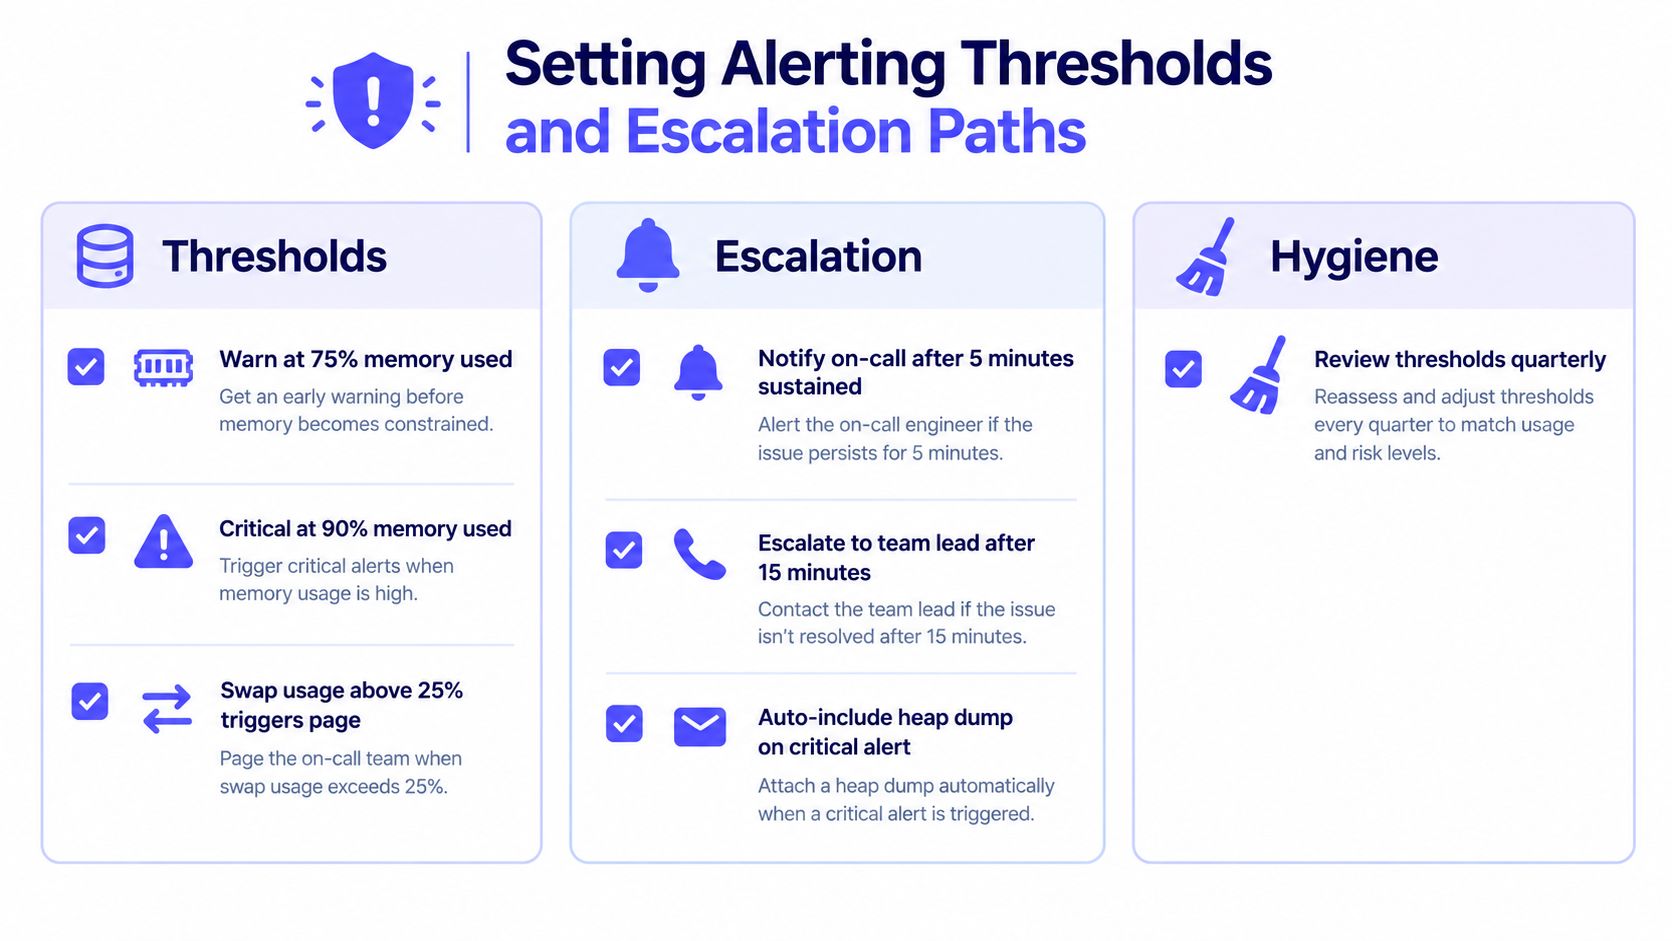
An alert should describe a condition that requires action, not merely report that RAM is busy. The strongest Linux memory alerts combine headroom, paging, and pressure. No single percentage can distinguish healthy cache use from an exhausted system.
A practical policy alerts when MemAvailable remains below 10–15% of total memory, using the Linux memory management guidance on available-memory thresholds. The duration must be sustained rather than instantaneous, because short-lived workload bursts shouldn't wake an on-call engineer.
Pair headroom with contention
Swap-in and swap-out activity, represented by si/so in vmstat, is a stronger contention signal when it remains non-zero across multiple samples. A single paging event may be harmless. Continuing activity alongside falling MemAvailable indicates that applications and the kernel are competing for memory.
Linux PSI adds another view. The memory pressure file at /proc/pressure/memory reports stalled work, and investigation should begin when some avg60 remains high for several minutes. PSI can expose performance degradation before an OOM kill, particularly when aggregate memory still looks acceptable.
A useful alert set might include:
- Warning:
MemAvailablebelow the selected sustained threshold. - Contention: non-zero
si/soacross multiple samples. - Pressure: persistent elevation in
some avg60. - Container risk: cgroup usage approaching its configured limit.
- Failure: an OOM kill, container termination, or repeated restart.
Avoid the cache trap: An alert based only on “used memory” will page on normal kernel behavior and train responders to ignore real incidents.
Route alerts by consequence
A warning belongs in a team channel or ticket queue when the service remains healthy and the trend is actionable. A sustained contention condition may need an on-call notification, while an OOM kill or repeated container termination should page the owner immediately.
Escalation tools should support delays, retries, deduplication, and ownership. The alert setup guide for infrastructure monitoring provides relevant operational context, but the policy still needs service-specific decisions. An alert should identify the host, container, process, current headroom, paging state, pressure signal, recent deployment context, and the next diagnostic command.
Review thresholds after workload changes. A value that was useful before a cache expansion, model rollout, or container-limit change may become either too sensitive or too slow.
Troubleshooting Memory Leaks and OOM Events
At three in the morning, an OOM alert rarely arrives with a complete explanation. The kernel may have killed a process, the container may have restarted, and the dashboard may show only a sharp drop after the event. The response needs to preserve evidence before the system normalizes.
Start by separating a leak from a capacity spike. A leak shows persistent growth under comparable workload, while a spike follows a request burst, batch job, deployment, or scheduled task. Correlating RSS and PSS trends with releases, cron activity, queue depth, and traffic gives the investigation a timeline instead of a guess.
Preserve the incident trail
The first pass should answer four questions:
- Which host or container crossed its boundary?
- Which process had the largest growing footprint?
- Did
MemAvailable, swap activity, or PSI indicate system-wide pressure? - Did the kernel log an OOM event, and which cgroup or process did it select?
A container restart can erase the most useful process state. Logs, termination reasons, cgroup events, and periodic process samples should therefore be retained outside the workload. The dashboard should show both the pre-event slope and the post-restart baseline, not just the current value.
Prove the leak before changing limits
Once a suspected PID is identified, compare RSS with PSS and inspect /proc/<pid>/smaps. A growing private mapping points toward application or allocator behavior. Growing shared mappings require a different investigation, especially when several workers load the same libraries.
Use a profiler or heap dump when the runtime supports it, and validate the result with pmap or equivalent tooling. Increasing a cgroup limit may prevent an immediate restart, but it doesn't fix an unbounded allocation pattern. The memory leak detection workflow offers a useful operational reference for turning trend data into a focused investigation.
Containment should be deliberate. Cgroup limits protect neighboring services, but limits that are too tight can create avoidable kills during legitimate bursts. A temporary limit adjustment, controlled restart, traffic reduction, or worker recycle can stabilize production while developers reproduce the growth in a staging environment.
The permanent fix belongs in code and release processes. Add regression coverage for the allocation path, profile the service before deployment, and keep the memory trend in the release review. A service that only leaks after prolonged uptime won't be cleared by a short smoke test.
Choosing Between DIY Stacks and Unified Platforms
A DIY stack built from Prometheus, Grafana, and Alertmanager gives teams deep control. Engineers can define labels, recording rules, dashboards, retention, and routing behavior around unusual workloads. That flexibility is valuable when an organization already operates the storage and query layer and has people available to maintain exporters, upgrades, cardinality, and alert rules.
The cost appears in the edges. Teams must keep scrape paths reachable, secure exporters, tune collection, manage time-series retention, build container views, add GPU exporters, and keep dashboards aligned with changing cgroup behavior. A system can be technically powerful while still leaving responders to assemble the incident context manually.
A unified platform changes the decision criteria:
| Requirement | DIY stack | Unified platform |
|---|---|---|
| Custom metric and query control | Strong | More constrained |
| Initial deployment | Requires assembly | Usually faster |
| Host and container dashboards | Built and maintained by the team | Commonly provided |
| GPU visibility | Requires suitable exporters and integration | Available when supported by the platform |
| Alert routing | Configured across components | Centralized |
| Operational ownership | Internal | Shared with the vendor |
For a small fleet or a team migrating away from an overcomplicated Prometheus setup, a focused platform can reduce maintenance. For organizations with unusual telemetry, strict data controls, or an established observability engineering function, DIY may remain the right choice.
Fivenines provides Linux server metrics, per-container memory data, NVIDIA GPU insights, dashboards, and alert routing from a single monitoring platform. Its agent pushes telemetry over HTTPS, and the service is one option for teams that want memory usage monitoring without maintaining a complete metrics, dashboard, and alerting stack.
The decision should follow the incident model. If operators need arbitrary instrumentation and deep historical queries, retain the components that provide that control. If the priority is fast visibility into host, cgroup, and GPU pressure with fewer moving parts, a unified service may offer the cleaner operational boundary.
Fivenines provides host, container, and NVIDIA GPU monitoring with memory-focused dashboards and alerts, helping teams connect Linux headroom to the workload that consumes it. Visit Fivenines to evaluate a lighter monitoring path for production servers, container fleets, and distributed infrastructure.