What Does Gateway Timeout Mean: A DevOps Guide

A gateway timeout means an intermediary server, such as a reverse proxy or load balancer, failed to receive a timely response from its upstream origin, so the client receives HTTP 504. The code has a formal specification milestone in RFC 7231, published on 2014-06-06, and the same definition remains in RFC 9110.
The incident usually starts without much drama. A critical API endpoint begins returning 504 responses during a traffic spike. The browser is reachable, the load balancer is running, and the application team reports no incoming requests in the backend logs. The apparent contradiction disappears once the request path is treated as a chain of servers, each with its own deadline.
A 504 Gateway Timeout is primarily a server-to-server communication failure. The client sent a request that reached an intermediary, but that intermediary waited beyond its configured window for an upstream response. The fix therefore starts with origin latency, upstream health, and intermediary configuration, not with the user's Wi-Fi or browser.
Table of Contents
- Understanding the 504 Gateway Timeout Error
- How Timeouts Occur in Modern Infrastructure Chains
- Comparing 504 with Related HTTP Status Codes
- Root Causes of Upstream Latency and Network Friction
- Diagnostic Steps and Proxy Configuration Checks
- Mitigation Strategies and Architectural Resilience
- Monitoring Gateway Health with Fivenines
Understanding the 504 Gateway Timeout Error
A gateway timeout means an intermediary server such as a reverse proxy, load balancer, or CDN failed to receive a timely response from its upstream origin, so the client receives HTTP 504 instead of the origin's payload, as described in the HTTP 504 reference.
That distinction changes the first five minutes of incident response. A user may report that the website is down, but the gateway itself may be healthy enough to accept the connection, route the request, and wait for the backend. The failure occurs after forwarding, while the intermediary is waiting for a response that doesn't arrive within its deadline.
The boundary that matters
Consider a request moving through a CDN, a load balancer, and a reverse proxy before reaching an application server. The proxy can establish a connection to the application, send the request successfully, and still return 504 because the application doesn't produce a response in time. The origin might be overloaded, blocked by a network control, waiting on a database, or stalled behind another service.
This is why an empty application access log doesn't prove that the application wasn't involved. The request may have stopped at a proxy-to-origin connection attempt, a DNS lookup, a firewall boundary, or another auxiliary service referenced by the request path. The formal HTTP definition covers an upstream server or auxiliary server needed to complete the request, not only the application process.
Practical rule: Treat 504 as a location signal. Start at the boundary where one service waits for another, then work hop by hop toward the origin.
The client usually can't repair this class of failure. Retrying may succeed if the delay was transient, but repeated retries can add pressure to an already slow backend. During an incident, teams should capture the affected route, request correlation ID, gateway name, upstream target, response time, and exact timeout boundary before changing configuration.
A 504 also doesn't automatically mean the origin crashed. A slow origin, a blocked path, and a proxy deadline can produce the same visible status. The operational question isn't just, “Is the website running?” It is, “Which intermediary waited, for which upstream, and what prevented a timely response?”
How Timeouts Occur in Modern Infrastructure Chains
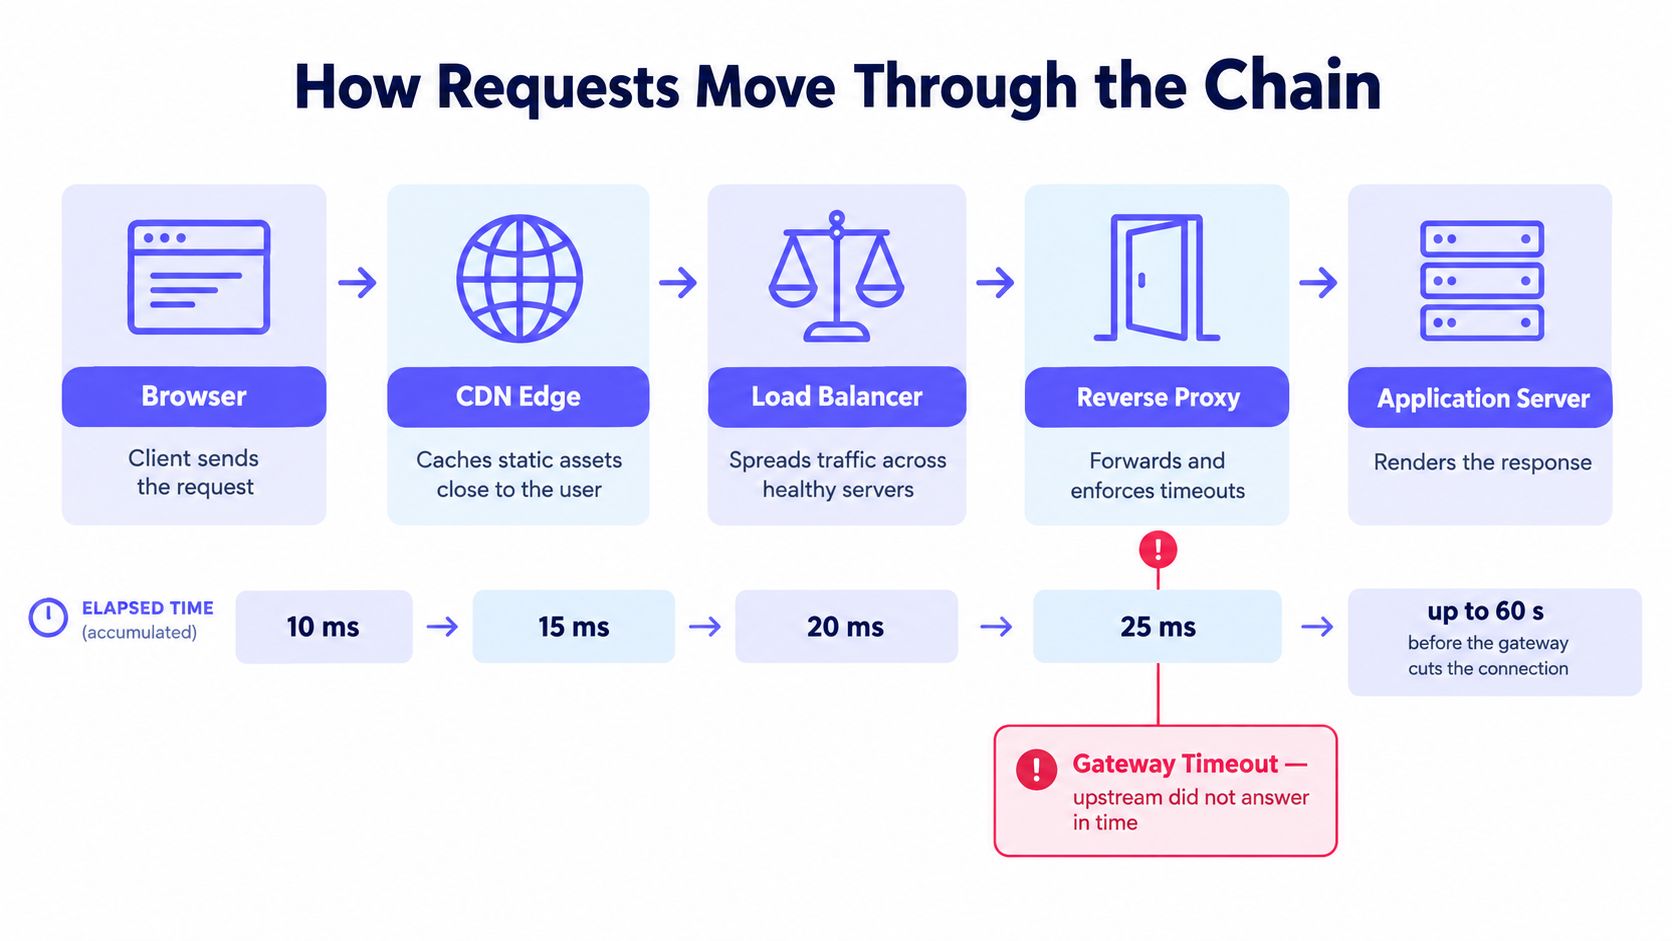
Modern HTTP requests rarely travel directly from a browser to one application process. A typical path may include a CDN edge, a load balancer, a reverse proxy, an API gateway, an application server, a database, and downstream services. Each intermediary can maintain a separate timeout clock, and each clock measures a different part of the journey.
One request, several deadlines
The browser waits for the edge. The CDN waits for the origin fetch. The load balancer waits for a target. The reverse proxy waits for response headers or body data. The application may wait for a database connection or an external API. A request can therefore be acceptable to one layer and already expired at another.
The HTTP specification discussion of gateway errors makes the infrastructure scope broader than a single web server. Reverse proxies, load balancers, CDNs, gateways, DNS services, and other auxiliary servers can all participate in the path. A failure at any waiting boundary can surface as a timeout to the next layer.
A fast backend doesn't guarantee a successful request if the wrong hop is being measured. For example, an edge may have an aggressive origin-fetch deadline while the origin completes just after that deadline. Conversely, a proxy may wait patiently while a client-facing gateway terminates the connection earlier.
Trace the chain instead of guessing
Engineers should map the actual route, including redirects, TLS termination points, service discovery, and downstream calls. A useful latency trace separates:
- Client to edge, including connection setup and request transfer.
- Edge to gateway, including cache lookup and forwarding.
- Gateway to origin, including connection establishment and response wait.
- Origin to dependencies, including database, DNS, and service calls.
Teams investigating this boundary can use a practical guide to checking network latency while correlating measurements with gateway logs. The goal isn't to collect one total duration. It is to identify which hop consumed the waiting budget.
A gateway can also return 504 when the origin itself returns 504, rather than generating the status locally. CloudFront documents both patterns, an origin-generated 504 and an origin that fails to respond before the request expires. That distinction matters because the visible response may identify the outer gateway while the actual timeout occurred deeper in the chain.
The most reliable incident artifact is a request timeline. Record when each layer accepted the request, forwarded it, opened an upstream connection, received response headers, and closed the connection. Without those timestamps, teams tend to change the most visible timeout instead of fixing the slowest dependency.
Comparing 504 with Related HTTP Status Codes
HTTP status codes narrow the search area, but they don't replace telemetry. A 504 says an intermediary didn't receive a timely upstream response. A 502 generally points to an invalid or unusable upstream response. A 408 concerns the client taking too long to send the request, while a 524 is a provider-specific timeout variant that should be interpreted through that provider's documentation.
| Status Code | Failure Layer | Root Cause | Immediate Action |
|---|---|---|---|
| 504 Gateway Timeout | Proxy or gateway waiting on upstream | Upstream response missed the configured deadline | Check upstream latency, reachability, and intermediary timers |
| 502 Bad Gateway | Proxy processing an upstream result | Upstream returned an invalid response or failed during handoff | Inspect upstream process health, connection handling, and response validity |
| 408 Request Timeout | Server waiting for client input | Client didn't complete the request within the server's input window | Check client upload behavior, request size, and connection stability |
| 524 provider-specific timeout | Provider edge waiting on an accepted origin connection | Origin connection exists, but the origin doesn't deliver the expected response in time | Check provider-specific timeout rules and origin response behavior |
The distinction between 502 and 504 is especially useful during triage. A 502 should lead engineers toward process crashes, refused connections, malformed headers, or protocol negotiation. A 504 should lead toward slow work, blocked connections, saturated pools, DNS resolution, and a mismatch between expected response time and proxy policy.
The 408 path is different because the server is waiting for the client, not an upstream origin. A client-side upload problem or slow request body can trigger it, but it shouldn't send the team hunting through database traces first.
Cloud providers may also expose their own timeout statuses. CloudFront documents a 504 when an origin returns that status or fails to answer before expiry. Other providers use codes such as 524 for a related but distinct edge-to-origin condition. Teams should preserve the original status, response headers, and producing layer before translating errors into a generic dashboard category.
A status code is a routing instruction for the investigation, not a root-cause diagnosis.
Root Causes of Upstream Latency and Network Friction
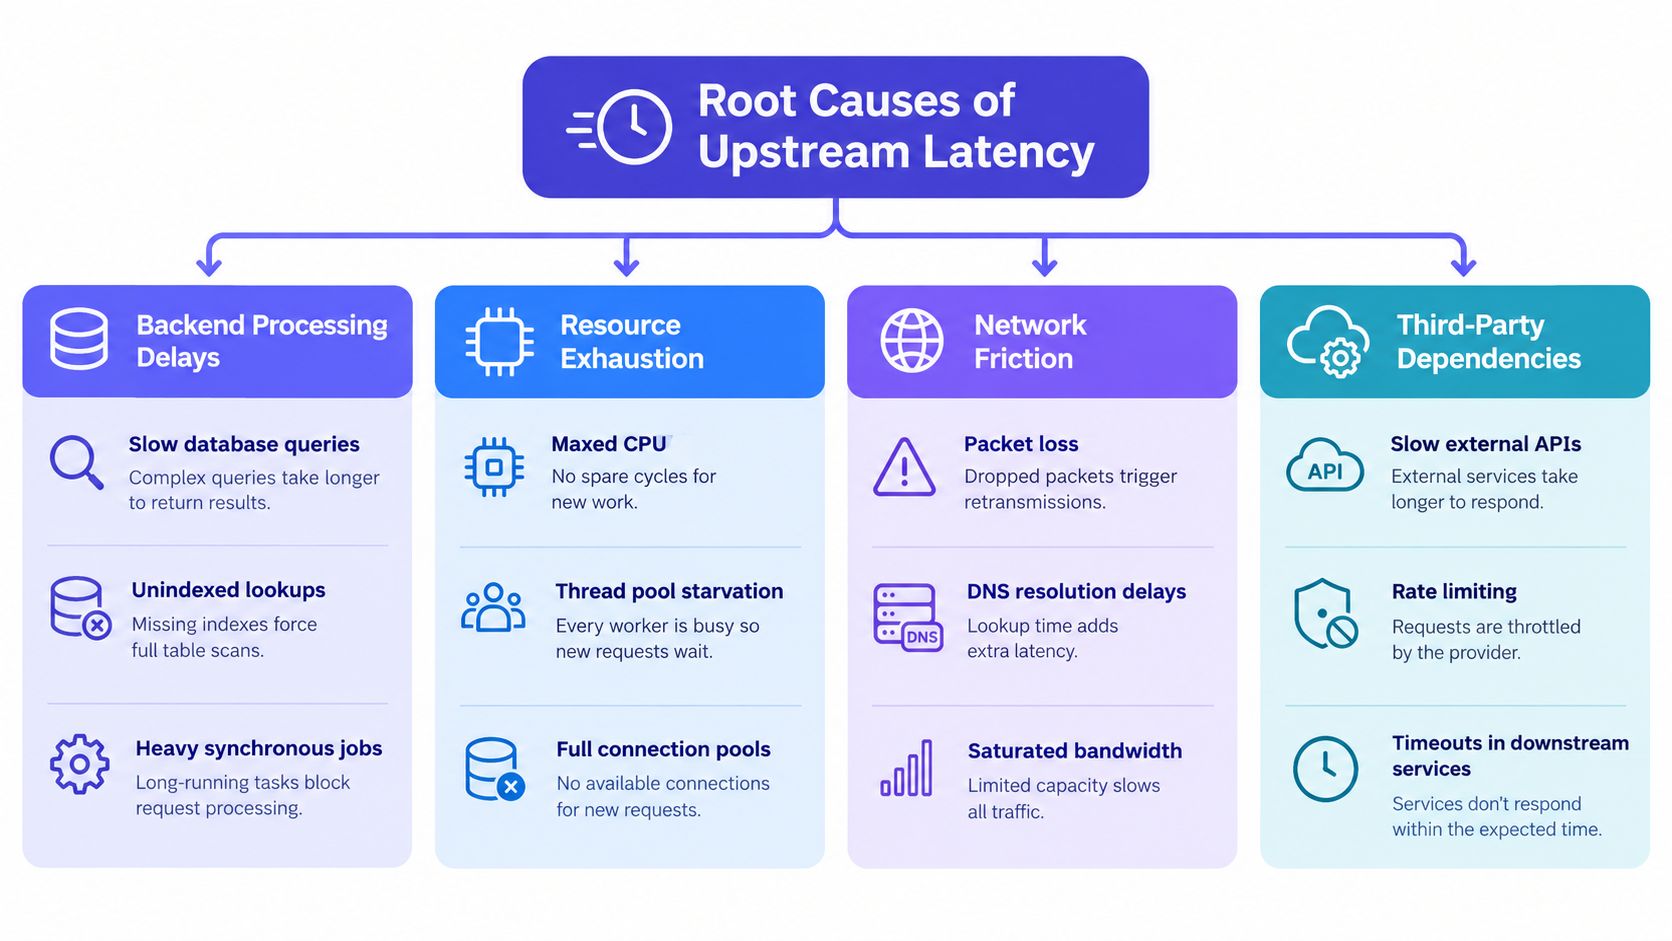
Upstream latency usually falls into three connected categories: backend processing, resource exhaustion, and network friction. Microsoft documents common HTTP 504 causes for Azure Application Gateway, including backend processing that exceeds the configured timeout, exhausted backend resources, and delays between the gateway and backend.
Backend processing delays
The application may accept the request but spend too long before producing response headers. Slow database queries, inefficient lookups, synchronous report generation, serialization of large payloads, and calls to degraded downstream services all extend the wait. Application logs should show request start and completion, database spans, queue wait time, and external call duration.
A request that performs several sequential dependency calls can exceed a gateway deadline even when each individual call looks tolerable. Distributed tracing should expose the critical path, while endpoint-level latency histograms reveal whether the problem affects one route or the service broadly.
Resource exhaustion
High CPU reduces available execution time. Memory pressure can introduce reclaim or swap activity. Disk IOPS saturation slows persistence and reads. Full database connection pools and exhausted worker pools create queues before useful work even begins.
These conditions often produce a misleading symptom: the process remains alive, health checks still pass, and application logs continue to emit routine messages, but user requests wait behind internal queues. Infrastructure telemetry should therefore be correlated with request latency, not inspected in isolation.
Network and dependency friction
A gateway may fail to reach the origin because a firewall or security group blocks the path. Packet loss, route changes, saturated links, TLS negotiation problems, and DNS resolution delays can all consume the response window. CloudFront specifically notes origin firewall or security-group blockage as a possible reason the origin doesn't respond before expiry.
The investigation should compare connection time with time to first byte. A long connection phase points toward routing, DNS, firewall, or TLS issues. A fast connection followed by a long wait points more strongly toward application processing or a downstream dependency.
- Backend signal: request spans show long handler or database duration.
- Capacity signal: CPU, memory, disk, worker, or connection-pool pressure rises with latency.
- Network signal: connection establishment or name resolution consumes the available window.
- Dependency signal: one downstream service dominates the trace and delays the origin response.
These causes can combine. A blocked dependency may leave workers occupied, which exhausts the pool and makes unrelated requests wait. A saturated origin can then appear unreachable to the gateway. The 504 is the final symptom at the boundary, not a complete description of the failure.
Diagnostic Steps and Proxy Configuration Checks
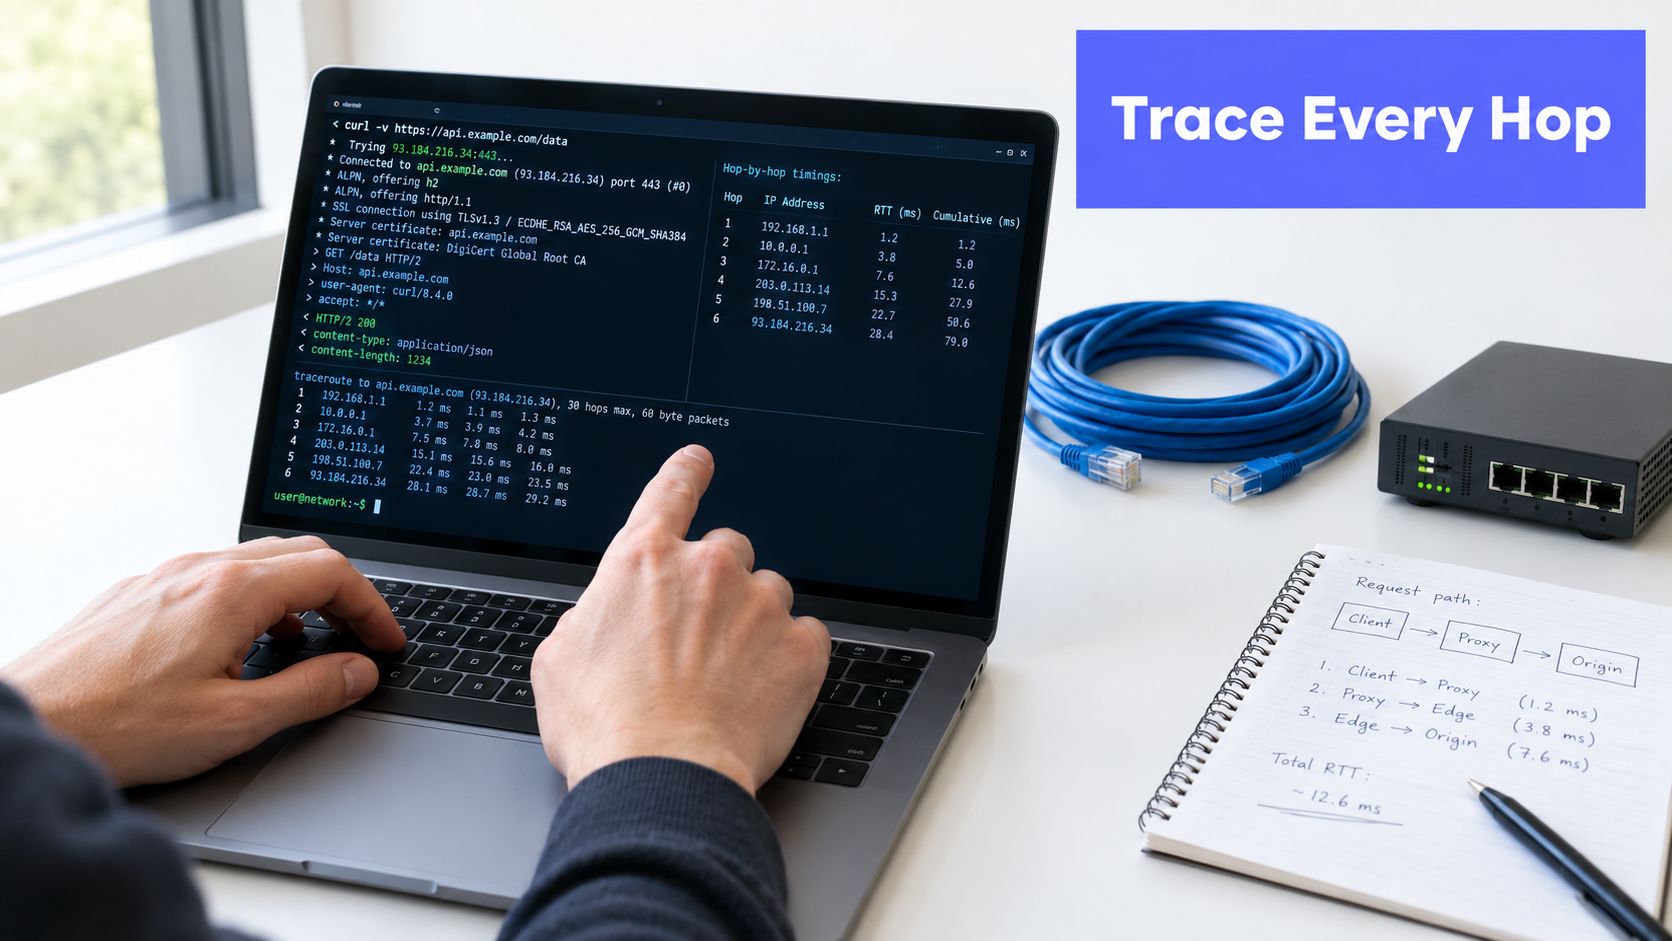
Diagnosis should proceed from the outside inward, while preserving a separate measurement for every hop. Start with the failing URL through the public path, then test the origin directly from the gateway's network position, and finally compare proxy logs with application traces.
Measure response phases
A verbose curl request separates name lookup, connection setup, and response timing:
curl -sS -o /dev/null -w "\nDNS: %{time_namelookup}s | Connect: %{time_connect}s | TTFB: %{time_starttransfer}s | Total: %{time_total}s\n" \
The command doesn't prove which internal hop failed, but it establishes whether the public request stalls before response headers. Run an equivalent request from a host that can reach the origin directly, using the same method and authentication conditions where appropriate. A fast direct response with a slow public response points toward an intermediary, routing, cache, or policy difference.
Capture proxy access logs with request ID, upstream address, upstream connect time, upstream header time, upstream response time, status, and bytes sent. Nginx's error log may explicitly report that an upstream timed out while reading response headers. HAProxy provides timing fields that help distinguish queue time, connect time, and server response time.
Audit timeout alignment
Timeouts must be explicit and ordered deliberately. Relevant settings include:
- Nginx:
proxy_connect_timeout,proxy_send_timeout, andproxy_read_timeout. - HAProxy:
timeout connect,timeout client,timeout server, and, where relevant,timeout http-request. - AWS load balancers: target response and connection idle timeout attributes.
- CDNs and API gateways: origin response, fetch, idle, and integration deadlines.
The outer layer shouldn't terminate a request before an inner layer has a reasonable chance to respond, but making every timeout longer creates capacity risk. Each value should reflect the endpoint's service objective and the amount of work that can safely remain synchronous.
Teams selecting or reviewing a load-balancing platform can also consult software for load balancing as part of the infrastructure inventory. The important outcome is a documented timeout budget, not a collection of undocumented defaults.
Inspect the packet path when logs are silent
When the proxy logs a connection attempt but the origin reports nothing, inspect firewall decisions, security groups, route tables, DNS answers, and TCP retransmissions. A targeted packet capture from the gateway or origin can show whether SYN packets, acknowledgements, request bytes, and response bytes traverse the path.
sudo tcpdump -ni any 'tcp and host <origin-host>'
The placeholder should be replaced with the approved hostname or interface target in the operating environment, without exposing sensitive network details in incident notes. Packet capture is most useful after request IDs and timestamps have narrowed the window. It shouldn't become a substitute for tracing.
Mitigation Strategies and Architectural Resilience
Raising a timeout can stop visible errors temporarily, but it doesn't reduce backend work. It may instead keep proxy connections, application workers, database sessions, and client sockets occupied for longer. During load, that extra waiting can turn a localized slowdown into queue growth and cascading failure.
Operational stance: Increase a timeout only when the longer operation is intentional, bounded, and supported by capacity. Otherwise, fix the upstream or remove the work from the synchronous path.
Make slow work stop blocking requests
Circuit breakers prevent a service from repeatedly calling a dependency that is already failing. After a controlled threshold of failures or slow responses, the breaker rejects or short-circuits new calls and allows recovery probes later. A fallback response, cached result, or explicit degraded mode is usually safer than holding every request open.
Retries require equal discipline. A retry policy should classify failures, cap attempts, use exponential backoff with jitter, and respect request idempotency. Retrying a timed-out write without an idempotency key can duplicate work. Retrying a saturated service can increase the very load that caused the timeout.
Move the boundary when the work is long
Asynchronous processing is the cleanest option for report generation, media processing, bulk notifications, and other operations that don't need to finish before the user receives an acknowledgement. The API accepts the job, returns a job identifier, and exposes status through polling, a webhook, or a push channel.
That pattern changes the failure mode. The gateway handles a short acknowledgement, while a worker processes the long task under a queue policy with its own visibility timeout, retry behavior, and dead-letter handling. Users receive progress or a final result instead of holding an HTTP connection hostage.
Reduce demand before adding capacity
Edge caching can remove repeat reads from the origin, provided cacheability, invalidation, authorization, and privacy rules are correct. Autoscaling can add capacity when demand rises, but it won't solve a slow query, a blocked firewall, or a dependency that has its own limit. Scaling the wrong layer only increases cost while leaving the critical path unchanged.
Teams should set a latency budget per endpoint and verify it against database, dependency, queue, and proxy measurements. The design should specify what happens when that budget is unavailable, such as a stale response, partial result, queued job, or controlled error. Resilience comes from making that behavior deliberate.
Monitoring Gateway Health with Fivenines
Backend logs alone can't show what users experience at the gateway boundary. An application may record no request because the failure occurred before the origin received traffic, or it may record a request that remains open while an intermediary waits. External checks provide an independent view of reachability, response status, and delay.
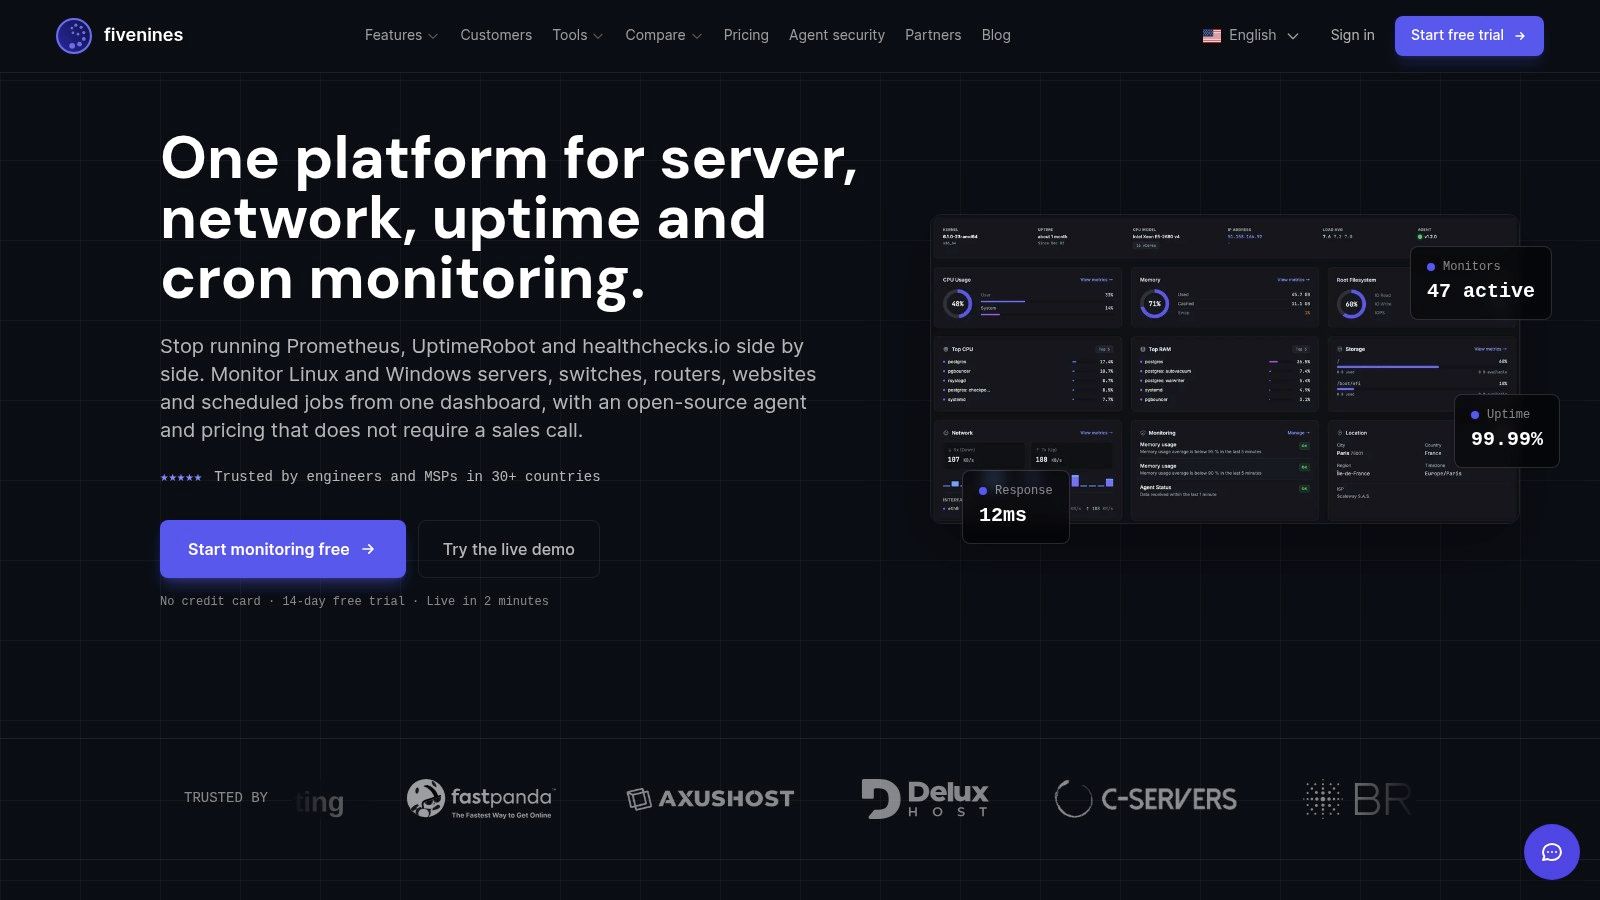
A practical monitoring design starts with the user-facing HTTPS endpoint and a small set of critical API paths. Add TCP checks for service availability, DNS checks for resolution behavior, and ICMP checks where network reachability matters. Run checks from multiple regions so a local routing problem doesn't look like a global outage.
Set alerts around both status and slowness. A 504 alert identifies a hard failure, while rising response time can reveal the upstream approaching its deadline before the gateway begins returning errors. Failure confirmation and recovery confirmation reduce paging noise, especially for short network interruptions.
Route alerts to the right responder
A website timeout may belong to the platform team, the application owner, or the network team. Include the monitored URL, region, status code, observed latency, timestamp, and recent history in the notification. Route urgent incidents to PagerDuty or Slack, while lower-severity degradation can enter a ticket or operations channel.
Teams evaluating monitoring roles and observability responsibilities may find the Datadog employer page on LatoJobs useful for understanding how monitoring organizations structure technical work. The tool matters less than assigning ownership for each hop and documenting the escalation path.
Fivenines combines website and API uptime checks with HTTPS, TCP, ICMP, and DNS monitoring, response-time tracking, alert routing, cron monitoring, status pages, and workflow automation. Its website uptime monitoring software can sit alongside application tracing and infrastructure metrics, giving teams a separate signal for the public gateway boundary.
The dashboard should not replace distributed tracing or proxy logs. It answers a different question: can an external observer complete the expected request, from a chosen region, within the service's operational budget?
The following overview shows how a monitoring workflow can fit into an incident process:
A strong alerting policy connects the synthetic result to gateway access logs, origin traces, resource metrics, and recent deployments. That correlation lets responders distinguish a global origin slowdown from a regional network path, a bad release, an exhausted pool, or an intermediary timeout mismatch. The result is a shorter path from “users see 504” to the exact upstream boundary that needs attention.
Fivenines provides multi-region HTTPS, TCP, ICMP, and DNS monitoring, response-time tracking, failure-confirmed alerts, cron checks, status pages, and workflow automation for gateway and origin visibility. Visit Fivenines to monitor the user-facing path before a 504 becomes the first signal of an incident.