Event Correlation Strategies for Modern DevOps Teams

At 3 a.m., a brief network interruption can turn a quiet on-call shift into a wall of noise. The switch reports packet loss, several Linux hosts become unreachable, database connections time out, application health checks fail, and the pager starts treating every downstream symptom as a separate emergency. The engineer receiving those alerts has to determine whether the infrastructure is suffering from many unrelated failures or one initiating fault.
That distinction is the purpose of event correlation. In modern IT operations, event correlation automatically analyzes and links related events from multiple sources to reduce noise, identify patterns, and accelerate root-cause analysis. It isn't a new buzzword. The concept has been used since the 1970s in telecommunications and industrial process control, then expanded through network management, IT service management, publish-subscribe systems, complex event processing, SIEM, distributed event-based systems, and business activity monitoring, as documented in the history and development of event correlation.
Table of Contents
- Understanding Event Correlation in Modern Infrastructure
- Distinguishing Correlation from Deduplication and Aggregation
- Core Algorithms and Techniques for Event Analysis
- Building a Multi-Step Correlation Pipeline
- Practical Implementation and Troubleshooting Workflows
- Streamlining Observability with Fivenines
- Moving Forward with Smarter Incident Management
Understanding Event Correlation in Modern Infrastructure
The practical problem is straightforward. Distributed systems generate many signals for one failure. A network device may report an interface problem, hosts may report unreachable dependencies, a database may report connection failures, and an uptime monitor may report an unavailable endpoint. Each signal is valid, but treating each as an independent incident forces responders to reconstruct the causal chain manually.
A correlation engine tries to establish that chain automatically. It evaluates event timing, source, attributes, service relationships, historical patterns, and operational context, then groups related signals into a smaller set of actionable incidents. The useful output isn't just “fewer alerts.” It's a more credible explanation of what happened and which component deserves attention first.
A mature discipline, not a shortcut
The technology evolved because operations teams faced the same structural problem at increasing scale. Telecommunications networks needed to interpret cascades of alarms. Network and systems management platforms needed to distinguish a failed device from the many systems that depended on it. Later, IT service management and security operations applied similar logic to larger collections of infrastructure and application events.
That history explains why a capable correlation workflow usually includes filtering, deduplication, normalization, aggregation, and root-cause analysis. Correlation works best as a sequence of increasingly informed decisions, not as a single machine-learning feature switched on above an existing alert stream.
Practical rule: A correlated incident should preserve enough evidence for an engineer to challenge the proposed root cause.
A unified observability design can make that evidence easier to inspect. Teams evaluating how metrics, uptime checks, and operational workflows fit together can use this overview of a unified observability platform as architectural context, but the central principle applies to any stack: related telemetry needs consistent identity and dependency context before an engine can infer causality.
Why distributed systems make correlation essential
A single failing component can produce a large number of low-level events. If the platform doesn't understand which services depend on that component, it may page on every symptom. That increases interruption without increasing knowledge.
Effective event correlation improves the responder's starting point. Instead of opening separate dashboards for network health, host metrics, application errors, and synthetic checks, the engineer receives a connected incident view. The result is not guaranteed truth. It is a ranked hypothesis supported by related evidence, which is valuable only when the underlying topology and ownership data remain trustworthy.
Distinguishing Correlation from Deduplication and Aggregation
Monitoring teams often use deduplication, aggregation, and correlation as if they describe the same operation. They don't. Confusing them creates alert policies that look quiet while leaving responders with little understanding of the actual failure.
Consider a database server experiencing rising disk I/O latency. The database begins exhausting its connection pool, application requests time out, and dependent services report errors. Three techniques will handle those signals differently.
| Technique | Mechanism | Database Failure Example |
|---|---|---|
| Deduplication | Suppresses repeated events with the same or equivalent identity. | Collapses repeated high-CPU or connection-pool alerts into one recurring notification, but doesn't determine why they occurred. |
| Aggregation | Groups events by shared attributes such as host, service, environment, or time window. | Places disk latency, database errors, and connection failures under the same database server or service grouping. |
| Correlation | Infers relationships between events using timing, dependencies, attributes, rules, and causal context. | Connects disk I/O latency to connection-pool exhaustion and downstream timeouts, then identifies the storage path as a root-cause candidate. |
Deduplication is necessary, but it answers only one question: which notifications repeat the same signal? Aggregation answers a broader organizational question: which events belong together by identity or scope? Neither necessarily answers the operational question: which event explains the others?
What each technique hides
Deduplication can remove valuable repetition when a repeated signal contains changing context. A disk alert that includes a new device identifier, ownership assignment, or recovery state shouldn't always be treated as identical to the previous event. Suppression rules need to preserve state transitions and meaningful changes.
Aggregation can also mislead. Grouping every event from a database host creates a convenient container, but the host may run unrelated workloads, and multiple failures may occur at once. A common host label doesn't prove a causal relationship.
True correlation adds reasoning. It can compare the event sequence, inspect service dependencies, and evaluate whether the database's disk latency plausibly preceded connection exhaustion. That conclusion should remain explainable, especially when multiple root-cause candidates exist.
Teams auditing their current stack can start with their alert management software and inspect whether incident records show causal links or only grouped labels. A quiet notification channel isn't evidence of successful correlation if the investigation still requires manual timestamp matching across dashboards.
A simple audit test
Select a recent incident and ask three questions:
- What was removed? Identify alerts suppressed as duplicates.
- What was grouped? Check whether aggregation relied only on host, service, or time.
- What was inferred? Look for an explicit dependency, rule, sequence, or explanation connecting symptoms to a root cause.
If the third answer is absent, the system may be reducing volume without performing meaningful event correlation. That isn't useless, but it should be measured and described accurately.
Core Algorithms and Techniques for Event Analysis
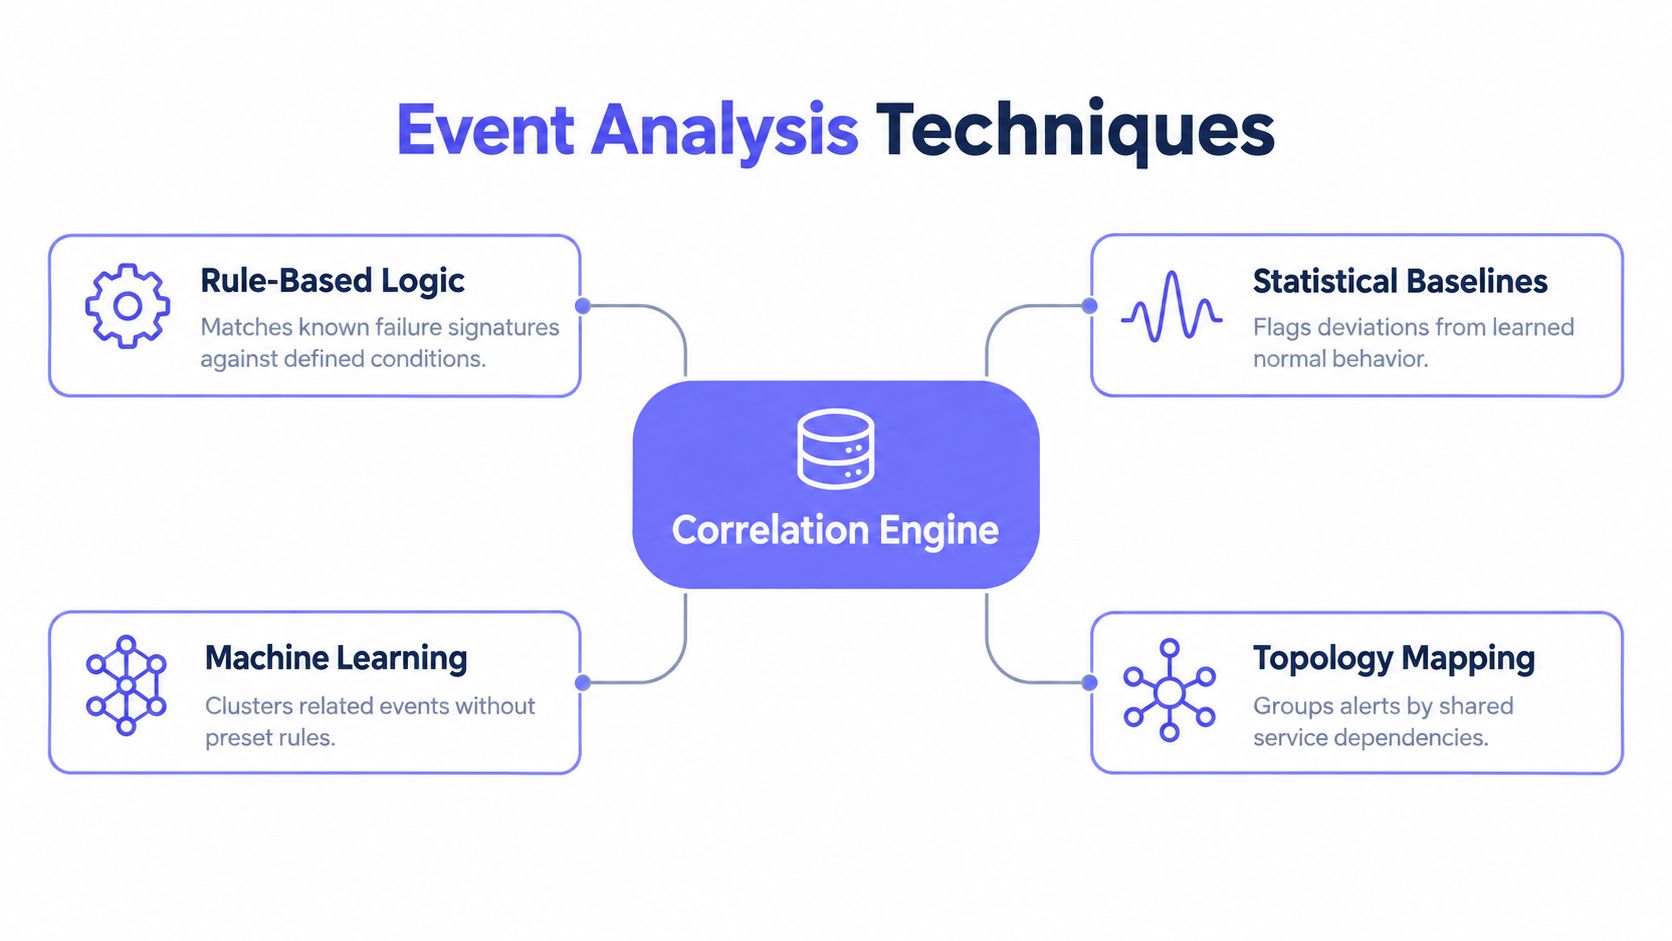
Correlation engines combine several methods because no single algorithm handles every failure mode. A static rule can explain a known dependency failure precisely, while statistical analysis can detect unfamiliar degradation. Topology supplies structural context, and machine learning can identify recurring combinations that operators haven't encoded manually.
Rule-based logic
Rules work well when failure signatures are stable and understood. A rule might connect a storage warning, a filesystem threshold breach, and database write errors when they affect the same host. This approach is transparent, easy to test, and useful for high-confidence operational patterns.
Its weakness is maintenance. Every architectural change, naming variation, and new dependency can require rule updates. Rules also tend to fail without warning when telemetry fields change or when an event arrives without the attribute the condition expects.
Statistical baselines
Statistical methods compare current behavior with learned or configured normal behavior. A correlation engine might associate an unusual latency deviation with changes in error rate and resource pressure, even when none of those signals crosses a fixed threshold.
Baselines can reduce dependence on hand-written thresholds, but they need clean history and stable labels. A planned migration, seasonal workload shift, or new traffic pattern can make yesterday's normal behavior a poor reference. Baselines should therefore be reviewed when services, workloads, or collection methods change.
Temporal windows
Temporal correlation groups events that occur within a defined interval or sequence. A deployment failure followed by a rise in application errors is a useful candidate relationship, especially when the affected service and environment match.
Time is a filter, not proof. Busy systems generate many unrelated events in the same interval, and delayed symptoms may fall outside a narrow window. A broad window catches more potential relationships but increases false grouping, while a narrow window can miss slow-moving causal chains.
Topology-aware mapping
Topology-based correlation uses service and infrastructure dependencies to determine which events are likely upstream and which are downstream. If a network device fails and connected hosts become unreachable, topology can identify the device as a root-cause candidate while treating host alarms as symptoms.
This technique is powerful only when the map is accurate. Missing dependencies, stale service ownership, and undocumented paths create false confidence. The engine may produce a neat causal graph that reflects the data model rather than the actual system.
Machine learning and pattern recognition
Machine learning can cluster related events without requiring every relationship to be defined in advance. It can also compare current combinations with historical incidents and surface recurring signatures.
The trade-off is explainability. Operators need to know which attributes, relationships, or historical patterns caused a cluster to form. A model that reduces pages but can't show its reasoning can move confusion from the notification channel into the incident review. Teams looking for practical alert timing and delivery controls can also consult this guide to real-time alerting, since correlation quality depends on how quickly and accurately events reach the analysis pipeline.
Building a Multi-Step Correlation Pipeline
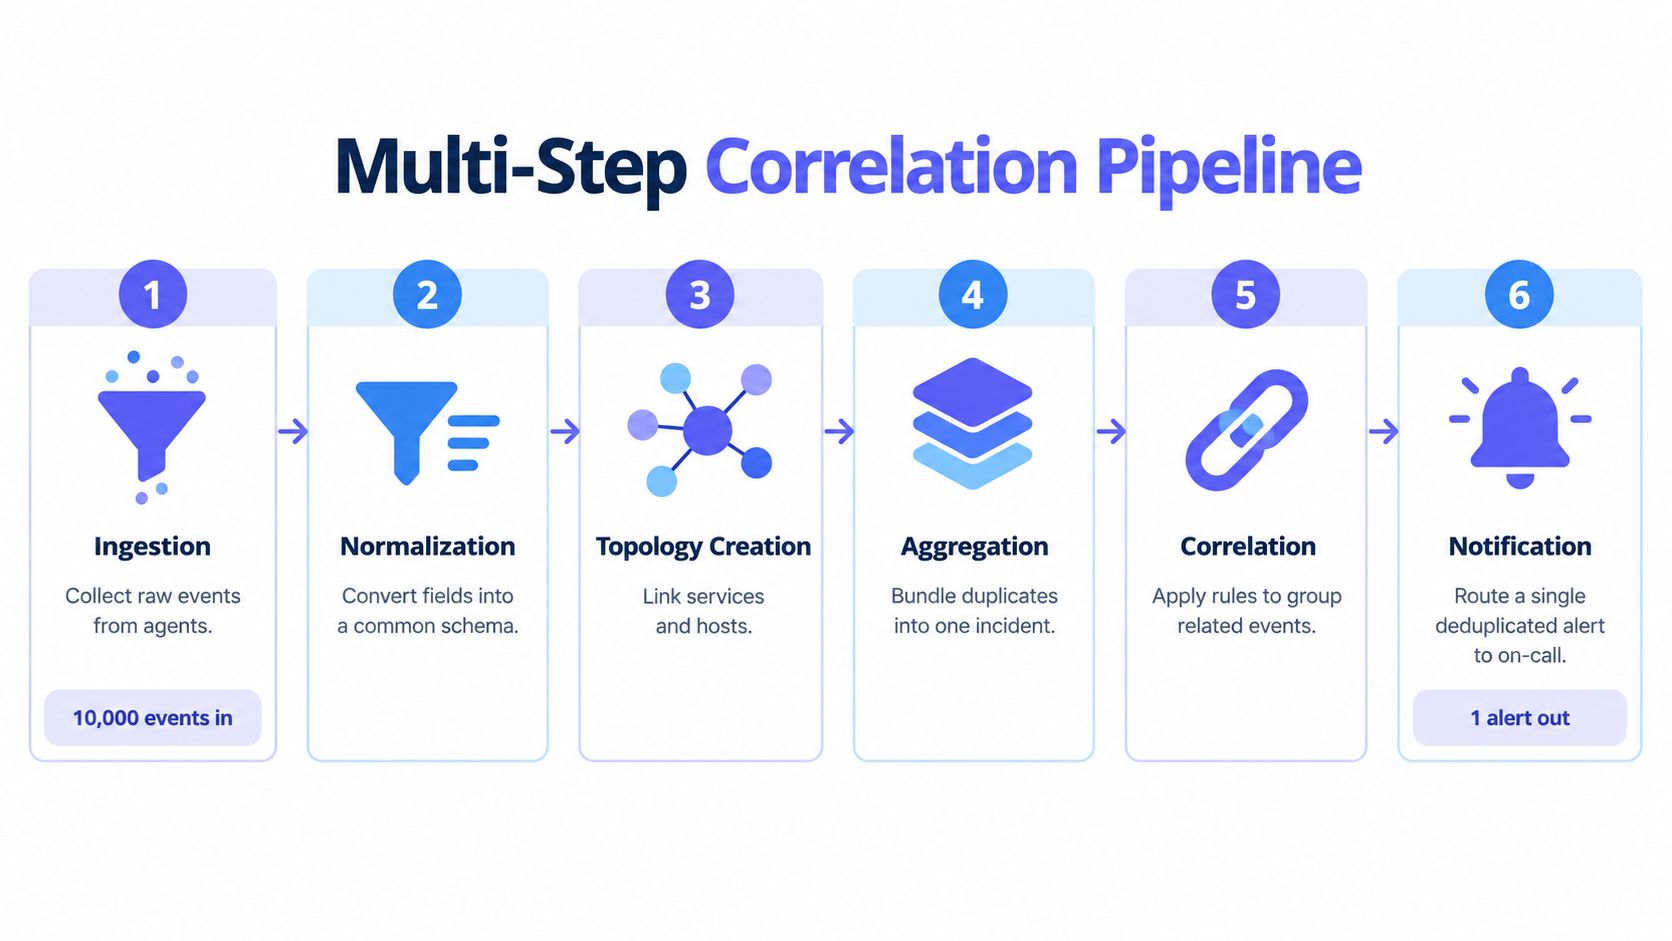
Event correlation doesn't happen in one magical operation. A dependable implementation processes telemetry through a sequence in which each stage improves the quality of the next decision.
1. Ingestion
The pipeline begins by collecting events from the sources that matter to the service. These may include Linux agents, network devices, application monitors, cloud services, synthetic uptime checks, deployment systems, and security tooling.
Collection gaps create correlation gaps. If the database emits detailed state changes but the network layer provides only coarse availability events, the engine can't evaluate the full path between a dependency failure and an application symptom.
2. Normalization
Different tools describe similar objects differently. One source may call an object a host, another a server, and a third an affected device. Normalization maps those variations into a common schema for fields such as entity, service, environment, severity, timestamp, state, owner, and event type.
This step deserves operational ownership. A technically valid event with an inconsistent service name may be impossible to connect to the rest of the incident. Normalization should also retain the original payload, so responders can inspect source-specific details when the normalized representation loses nuance.
3. Topology creation
Topology creation builds the relationship map between hosts, networks, databases, applications, containers, and external dependencies. It can use service catalogs, configuration data, infrastructure definitions, traces, discovery integrations, or carefully maintained ownership records.
This is usually the critical bottleneck. Without dependency context, the engine can group events by time and labels, but it can't reliably distinguish a failing upstream component from an affected downstream service.
4. Aggregation and deduplication
After events are normalized and contextualized, the pipeline can combine repeated signals and related records. Aggregation reduces the number of objects the analysis stage must evaluate, while deduplication prevents identical notifications from dominating the incident.
The order matters less than the outcome and traceability. Operators should be able to see which raw events were merged, which were suppressed, and which remained separate because they contained conflicting evidence.
5. Correlation and root-cause analysis
The engine applies rules, temporal relationships, topology, statistical evidence, and pattern analysis. It ranks likely causes, identifies symptoms, and builds an incident record that preserves the causal explanation.
Dependency-aware systems can suppress inaccessible downstream events as symptoms while retaining the initiating fault as the root cause, a behavior described in IBM's event correlation and root-cause analysis documentation. The ranking should remain a hypothesis when topology or event quality is uncertain.
6. Notification
Only after analysis should the system route a page, ticket, chat message, or escalation. The notification needs the incident summary, suspected root cause, affected services, supporting events, confidence or uncertainty, and a link to the investigation view.
A separate workflow layer can then manage delays, retries, routing, and escalation without changing the evidence used for correlation. Guidance on monitoring automation is useful here because automation should control response mechanics, not conceal analysis mistakes.
The pipeline is easier to understand when viewed as an operational contract. Each stage must provide the next stage with reliable identity, context, and state. If ingestion is incomplete or topology is stale, notification speed won't compensate for weak diagnosis.
Practical Implementation and Troubleshooting Workflows
Aggressive correlation feels successful when the pager becomes quiet. That metric can be deceptive. A system may reduce alerts by merging unrelated failures, suppressing secondary evidence, or assigning a root cause based on an incomplete dependency map.
The most dangerous failure mode is false confidence. An incident record can look coherent while omitting the service that initiated the outage. If the topology doesn't include a critical queue, shared storage path, identity provider, or security control, the engine may blame the first visible symptom.
When separate alerts are safer
Correlation should be conservative when the evidence is ambiguous. Keeping alerts separate is often the right choice when:
- Dependencies are unknown: The platform can't verify whether two services share a failure path.
- Ownership conflicts: Different teams own the affected components, and a merged incident could obscure accountability.
- Signals disagree: One source reports recovery while another reports continued impact.
- Security and availability overlap: A suspicious authentication pattern may require independent handling from an application outage.
- The event is diagnostic: A low-volume signal may provide key evidence even if it doesn't trigger a page.
A good engine doesn't force every event into a cluster. It can link related records while preserving independent alert states, allowing responders to inspect the evidence that informed the grouping.
The safest correlation rule is one that can explain both why events were grouped and why other events were left alone.
Validating rules in production
Correlation rules need tests that resemble real incidents, not only clean synthetic examples. Replay historical event streams, inject missing topology edges, rename entities, delay downstream signals, and introduce simultaneous unrelated failures. Then compare the proposed incident with the incident record an experienced responder would have created.
Reviewers should inspect:
- Grouping accuracy, whether related symptoms joined the right incident.
- Root-cause accuracy, whether the initiating component was ranked correctly.
- Evidence preservation, whether suppressed events remain searchable.
- Explanation quality, whether responders can understand the grouping logic.
- Recovery handling, whether the incident closes only after relevant dependencies recover.
Governing cross-domain correlation
Hybrid environments create a second challenge. Infrastructure, application, and security events may describe the same operational change from different perspectives, but they don't necessarily share the same ownership, retention, or escalation policy.
A NOC may prioritize service availability, an SRE team may prioritize dependency health, and a SOC may need to preserve an investigation trail. A single black-box incident can satisfy none of those needs. Cross-domain correlation should define who can alter rules, which evidence must remain immutable, how confidence is displayed, and when domain-specific alerts must remain independent.
A practical rollout starts with high-confidence relationships, explicit ownership, and visible explanations. Compression can increase later, but restoring a missed root cause after responders lose trust is much harder.
Streamlining Observability with Fivenines
A correlation design becomes useful only when the platform can execute it without forcing operators to assemble every stage manually. The architecture described above requires consistent telemetry, a shared operational view, dependable alert delivery, and workflow controls that don't hide the underlying evidence.
Fivenines is positioned as an all-in-one infrastructure monitoring platform for teams that need that operational foundation. It unifies Linux server metrics, network device health, website uptime, and cron job tracking in one dashboard, reducing the need to stitch together separate monitoring, visualization, and notification systems.

A collection model suited to operations
The open-source Linux agent pushes telemetry over HTTPS, avoiding inbound ports and remote command paths. That model can simplify collection across server fleets while providing visibility into CPU, memory, disk, network activity, per-container workloads, Proxmox environments, and NVIDIA GPU metrics.
The platform also supports uptime checks across HTTPS, TCP, ICMP, and DNS from multiple regions, with failure confirmation before paging. That confirmation is operationally important because external checks and host-level telemetry answer different questions. A service can be healthy from inside its network while unavailable to users, or an application can remain reachable while its underlying host is degrading.
Automation without a sprawling stack
Fivenines includes workflow automation for routing, delays, retries, and escalations. Notifications can connect to Slack, Microsoft Teams, Telegram, Discord, email, SMS, Pushover, and webhooks. Custom dashboards, a public REST API, and a Terraform provider support teams that manage monitoring as code.
This doesn't eliminate the need for disciplined correlation. It gives teams a more direct place to apply the principles: normalize signals, keep service ownership visible, separate delivery from diagnosis, and preserve evidence when alerts are grouped. The platform can replace combinations such as Prometheus, Grafana, and Alertmanager, as well as standalone uptime and cron-monitoring services, for teams that prefer a consolidated operating model.
Fivenines is hosted in the EU with GDPR-aware handling and offers transparent pricing starting at €9 per month, according to the publisher's product information. Those characteristics may suit DevOps teams, MSPs, hosting providers, and solo operators that want practical incident visibility without an enterprise rollout, but any current feature or pricing decision should be verified directly with the vendor.
Moving Forward with Smarter Incident Management
Event correlation should move an on-call team from reactive paging toward evidence-led incident management. It isn't a set-and-forget feature. Services change, ownership moves, deployments alter dependencies, and statistical baselines drift.
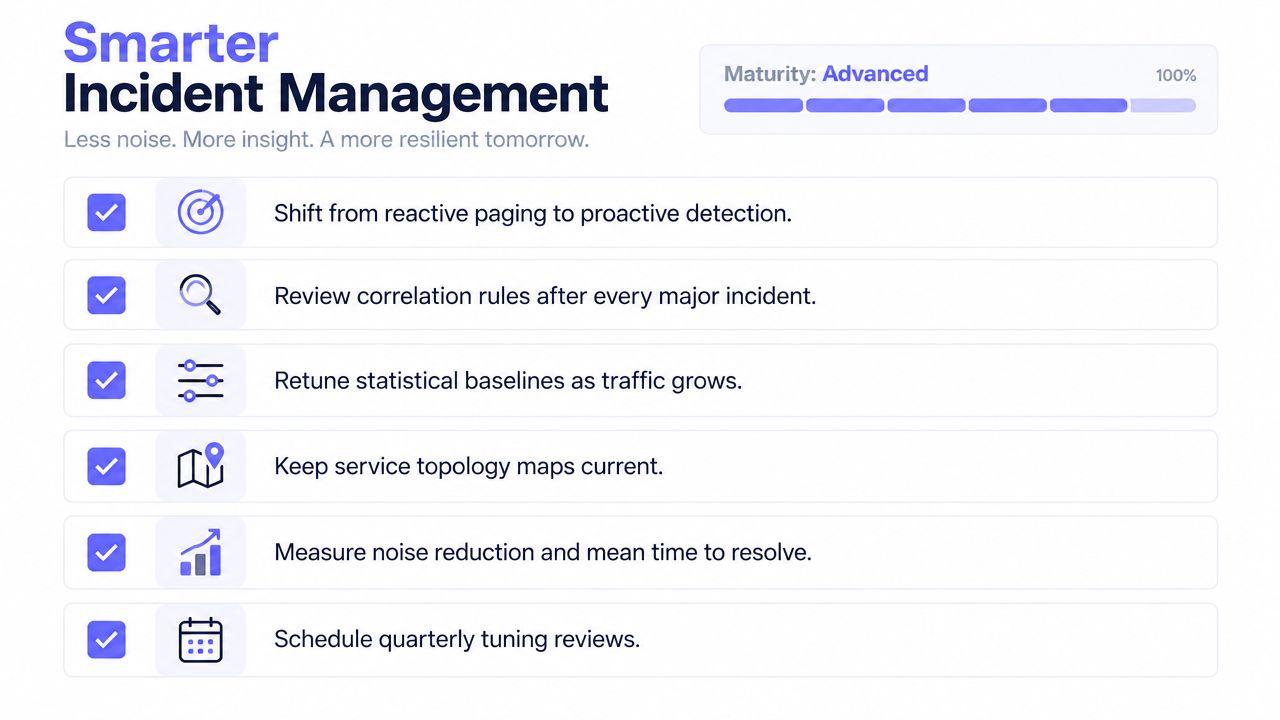
A practical audit should check whether the stack is performing correlation or only suppressing duplicates:
- Inspect incident explanations: Confirm that every grouping has a visible reason.
- Review topology freshness: Verify service, dependency, and ownership records against production reality.
- Replay difficult incidents: Test missing data, delayed symptoms, and simultaneous failures.
- Preserve diagnostic signals: Keep ambiguous or security-sensitive alerts separate until evidence improves.
- Track operational quality: Monitor signal-to-noise ratio, false-positive rates, event enrichment, and mean time to identify and resolve incidents.
- Review after change: Revisit rules and baselines after major deployments, migrations, and architecture changes.
Teams also need clearly assigned responsibilities. A resource describing incident management roles for engineering teams can help connect correlation ownership with incident command, communications, service ownership, and follow-up work.
The strongest implementation isn't the one that produces the fewest alerts. It's the one that gives responders fewer distractions while retaining enough independent evidence to find the actual failure.
Visit Fivenines to evaluate a unified monitoring platform for Linux metrics, network health, uptime checks, and automated incident workflows. Start by mapping the signals that currently overwhelm the on-call team, then use the platform to build a more explainable path from raw event to actionable incident.