Linux How to Monitor Network Traffic Hands-On Guide


A production link is saturated, latency is climbing, and the bandwidth graph only says that something is busy. The first response is usually a quick interface check. The harder question arrives seconds later: which connection, process, container, or workload caused the traffic, and is the current symptom a capacity problem, packet loss, retransmission storm, or something else?
Linux offers tools for each layer, but no single command provides the whole answer. ip -s link and nload show interface pressure, iftop exposes active conversations, nethogs connects traffic to processes, tcpdump supplies packet-level evidence, and persistent collectors turn short-lived spikes into trends. Modern fleets also need to account for namespaces, overlays, encryption, and the overhead of observing busy links.
Table of Contents
- Why Linux Network Traffic Monitoring Still Matters
- Core Toolkit for Live Throughput and Connection Views
- Capturing Packets the Right Way With tcpdump and BPF
- Finding Which Process Caused the Traffic
- From Counters to Dashboards Sampling Aggregation and Alerting
- Choosing the Right Approach and Making It Stick
Why Linux Network Traffic Monitoring Still Matters
At 3am, a saturated interface can make unrelated systems look broken. Requests time out, backup jobs slow down, and health checks fail while CPU and memory remain normal. A live rate confirms pressure, but it does not identify whether a batch job, noisy neighbor, retry loop, or damaged network path created the load.
That makes network monitoring an operational control, not a decorative dashboard. The practical approach described in this network monitoring overview connects traffic measurements with the context needed to act. A rate shows how much traffic is moving. A connection view shows between whom. Correlation with processes, containers, and workloads shows who caused it.
Live evidence versus durable telemetry
Linux network monitoring grew from Unix-era tools. By the early 1990s, basic monitoring commands were established on Unix and Linux, while MRTG and Big Brother helped make graphing and logging traffic over time common practice. Operators still need both forms of evidence: immediate visibility during an incident and retained history for patterns that disappear after the terminal closes. (Monitoring tools history)
Live tools support incident response. They expose current ingress and egress, active conversations, and whether a spike affects one interface or the whole host. Their evidence is transient, though. Once the event ends, they cannot show whether the same burst returns during backups, releases, or scheduled data transfers.
Historical telemetry answers that longer question. vnStat runs as a background daemon, records transfer continuously, and keeps summarized measurements across several retention horizons, including five-minute, hourly, daily, and yearly views. The exact retention behavior depends on its configuration and version, so operators should verify it in the official vnStat documentation. This design preserves useful counters without an interactive session and supports trend analysis, billing, and capacity planning on modest servers.
Operational rule: Use live views to determine what is happening now. Use retained counters to determine whether the event is normal, recurring, or nearing a capacity limit.
The required depth follows the incident. A brief slowdown may need interface counters and ss. Recurring saturation calls for historical collection. A suspected data leak or retransmission storm may justify a narrowly filtered packet capture, while sampling, aggregation, or eBPF can associate traffic with processes at lower overhead than storing every packet. Treating every problem as either a dashboard issue or a full capture wastes time and can add avoidable load to an already busy host.
Core Toolkit for Live Throughput and Connection Views
Start with counters before starting a sniffer. The command below gives interface totals, including errors and drops, so it provides more useful first evidence than a bandwidth graph alone:
ip -s link
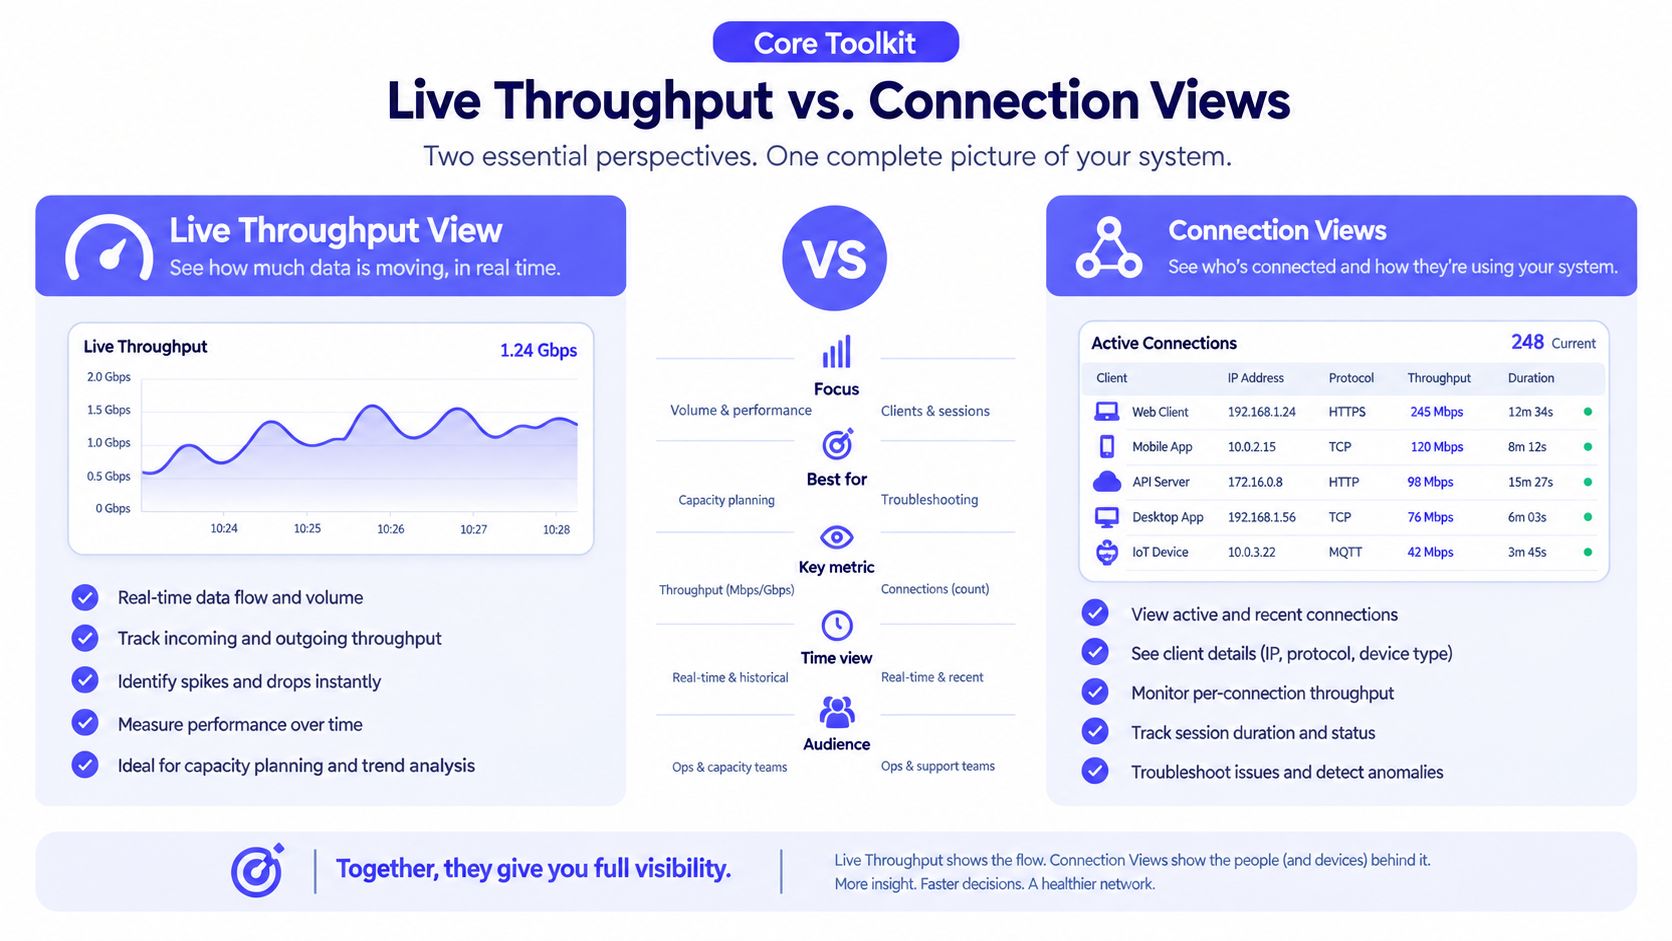
For a single interface, operators can inspect /proc/net/dev twice, with a one-second interval, and calculate the byte delta. nload presents a live ingress and egress rate for one interface, while bmon is more useful when several interfaces need simultaneous comparison. These tools answer whether the link is busy and in which direction, not which workload owns the traffic.
The next layer is connection visibility. iftop groups traffic by active connection, tcptrack focuses on TCP sessions, and nethogs attributes bandwidth to processes. ifstat provides a compact interface-rate view that works well in terminals and scripts. For historical interface sampling, sar -n DEV retains readings that can help separate a transient burst from sustained pressure. A broader Linux network monitor guide describes this layered ecosystem, including vnStat, iftop, nethogs, bmon, ifstat, and tcptrack.
Escalation by question
A useful operator doesn't run every tool at once. The following mapping keeps the investigation focused:
| Question to Answer | Best Tool | What It Shows |
|---|---|---|
| Is an interface saturated? | ip -s link |
Byte totals, errors, and drops |
| What rate is moving now? | nload |
Live ingress and egress for an interface |
| Which interface is busiest? | bmon |
Comparative real-time interface activity |
| Which hosts or connections dominate? | iftop |
Active conversations and their bandwidth |
| Which process owns the traffic? | nethogs |
Process-level bandwidth usage |
| Are TCP sessions retransmitting? | ss -ti |
Socket details and TCP diagnostics |
| Is there retained interface history? | sar -n DEV or vnStat |
Sampled or aggregated traffic over time |
iftop is particularly effective when the immediate question is which remote host is consuming bandwidth. Operators who want a separate overview of open-source network monitoring tools can also consult NeoTeo's OpenNetMeter overview, but the same limitation applies: a host-level conversation view still doesn't identify the originating process by itself.
Don't stop when the rate looks high. Check link counters for errors and drops, then inspect TCP state with:
ss -ti
A busy interface can be healthy, while a moderately busy interface with retransmissions can be the source of application failures. The throughput measurement guide provides useful context for treating rate, direction, and sustained behavior as separate measurements rather than collapsing them into one graph.
Capturing Packets the Right Way With tcpdump and BPF
At 3 a.m., a saturated link leaves little room for guesswork. tcpdump preserves packet-level evidence, exposing headers, flags, handshakes, retransmissions, and, where permitted, payload data. It can also save that evidence for later analysis. Raw capture is costly, though, so it is a poor default for indefinite collection on a busy production interface.
Start by finding the available interfaces:
sudo tcpdump -D
Choose the relevant interface, then narrow the capture with a Berkeley Packet Filter:
sudo tcpdump -i eth0 'host example.internal and port 443'
Filter on the dimensions that answer the investigation: host, port, protocol, or a combination. Early filtering reduces inspection and storage work, keeps the capture readable, and limits exposure of unrelated traffic. The tcpdump command-line introduction documents this interface-first, filter-driven workflow.

Capture narrowly and preserve evidence
Give every capture a defined question and bounded scope:
sudo tcpdump -i eth0 -nn -s 0 -w /tmp/service-capture.pcap \
  'tcp and port 443'
-nn prevents name and service lookups. -s 0 keeps the full packet snapshot where the environment supports it, and -w writes packets for offline analysis. These options do not replace a selective filter. On a busy link, an unrestricted full capture can become part of the incident by consuming CPU, memory, storage, or I/O capacity.
Receive livelock is a documented failure mode under high packet arrival rates. Per-packet interrupt work and kernel-to-user-space transitions can leave too little processor time for useful application work, particularly when collection is broad and sustained.
Practical rule: Make the capture answer one defined question. Select one interface, filter early, use a short collection window, and stop once the evidence is sufficient.
Packet capture also has blind spots. Overlay networks may hide the context needed for attribution, encrypted east-west traffic limits payload interpretation, and container movement can complicate host-level analysis. For a broader view of monitoring Ethernet traffic on Linux, pair packet evidence with sampled and aggregated telemetry. Neither approach alone identifies the responsible process reliably. eBPF-based observability can add process and kernel context with lower data volume, while classic capture remains the better choice when exact packet contents and protocol behavior matter.
The following media provides a visual reference for the command-line workflow and packet inspection context.
Finding Which Process Caused the Traffic
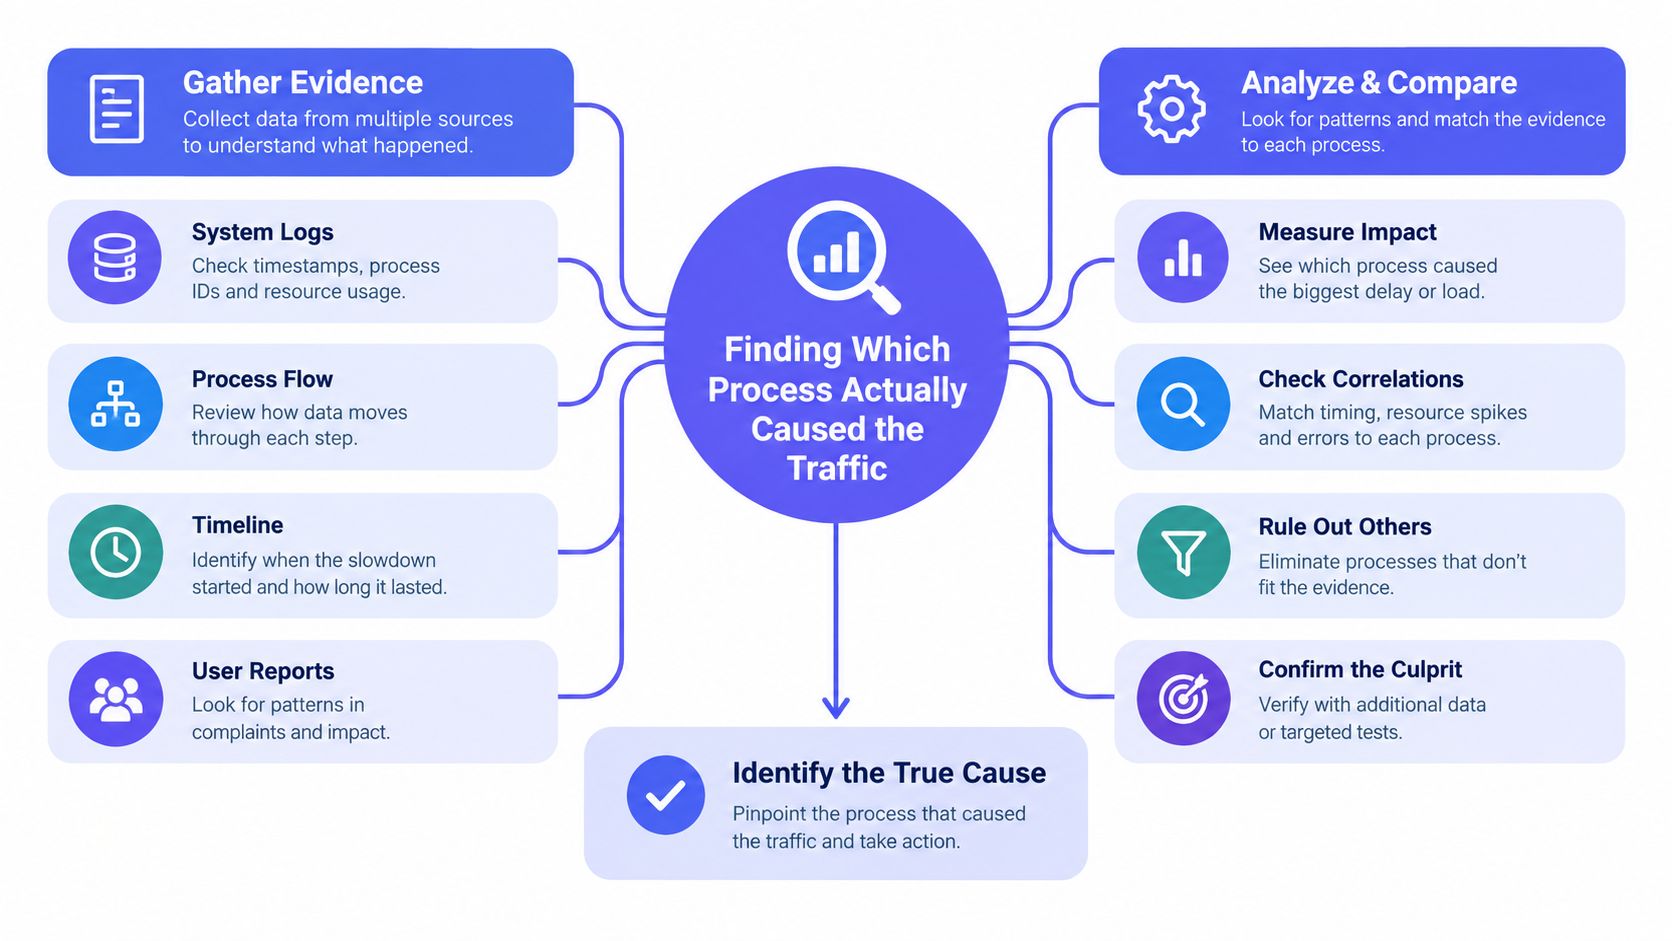
At 3 a.m., a saturated interface tells you the symptom, not the offender. eth0 may be transmitting heavily and a remote peer may dominate a connection, but an IP address is not a process identity. On a shared host, that address can represent several services, containers, or users. Interface counters alone cannot show which workload initiated the transfer.
Pair the socket table with a process-level view:
sudo ss -ti
sudo nethogs -d 2
ss -ti exposes TCP details such as retransmission indicators and socket state. nethogs associates observed bandwidth with processes, often providing the quickest path from “the link is full” to “this executable owns the traffic.” Attribution still has limits. Permissions, short-lived connections, namespace boundaries, and traffic generated outside the host's ordinary process view can produce incomplete results, as discussed in Linux network security monitoring gaps. Treat the result as a lead to verify, not final proof.
Correlate sockets, namespaces, and workloads
After identifying a suspicious socket, trace it to the owning process through its file descriptors:
sudo ls -l /proc/<PID>/fd | grep socket
sudo tr '\0' ' ' < /proc/<PID>/cmdline
The command line supplies operational context, while the socket relationship verifies ownership. For systemd services, the unit and cgroup are more stable identifiers than a transient PID. Containerized workloads need another check because the process may sit in a network namespace or cgroup whose name differs from the host's view.
Use these checks:
- Inspect the cgroup: Identify the service, container, or workload group associated with the PID.
- Inspect the namespace: Compare the process network namespace with the host and neighboring workloads.
- Confirm the endpoint: Match local ports, remote peers, and TCP state with
ss. - Check the workload owner: Connect the cgroup or namespace to the deployment, job, or tenant responsible for it.
Security-focused Linux coverage frames attribution as correlation across network flow, host telemetry, and detection context. A top-talker report without process, namespace, or workload context leaves remediation unresolved.
The right response depends on ownership. A backup worker may need scheduling or rate control. An application producing retransmissions needs service or network diagnosis, while bandwidth limits would only hide the symptom. Sampling process activity, aggregating it by executable and workload, and using eBPF can preserve attribution with less data than full packet capture. Capture remains preferable when exact packet contents or protocol behavior must be examined.
From Counters to Dashboards Sampling Aggregation and Alerting
CLI commands are excellent during an incident, but they can't establish a durable baseline. Continuous monitoring needs a collection path that preserves enough detail to diagnose a problem without turning every packet into a long-term storage obligation.
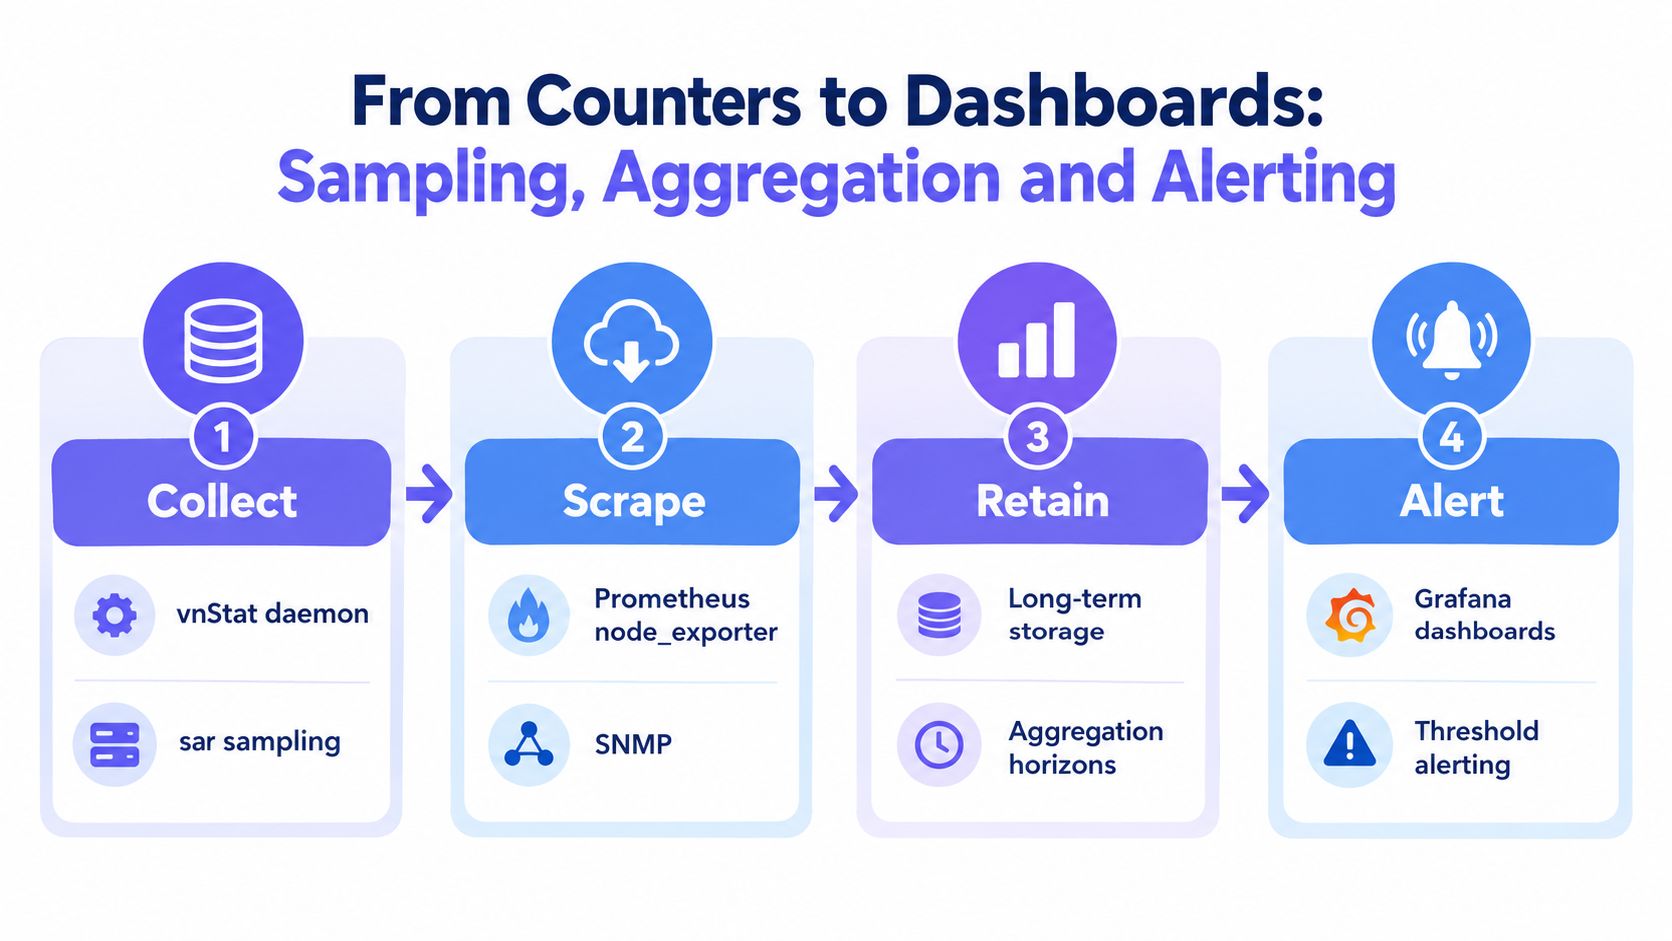
vnStat is a practical low-overhead collector for summarized interface usage. It runs as a daemon and retains five-minute, hourly, daily, and yearly views across its documented horizons. sar -n DEV adds sampled interface history, while exporters and SNMP collectors can expose counters to a central monitoring system. The metrics and dashboards guide gives additional context for turning host measurements into operational views.
Choose the resolution before choosing the dashboard
Sampling is a design decision, not a cleanup task. High-resolution measurements help explain short bursts, but they create more data and more alert noise. Aggregated counters preserve capacity trends and recurring patterns, but they can hide a brief event that caused an outage.
A workable pipeline separates those purposes:
- Collect the raw counters. Read interface bytes, errors, drops, and TCP indicators. Add process or workload labels where the collector can obtain them safely.
- Scrape or push selected measurements. Export host and interface metrics to the existing monitoring system. Use SNMP for network devices when interface health must be viewed alongside Linux hosts.
- Retain multiple views. Keep short-window detail for incident investigation and aggregated history for planning, billing, and recurring-pattern analysis.
- Alert on symptoms with context. Combine sustained utilization with errors, drops, retransmissions, or service impact instead of paging on one instantaneous rate.
The retention model should match the decision being supported. Capacity planning needs comparable history across interfaces and workloads. Incident response needs enough temporal detail to align traffic with deployments, jobs, and application failures. Billing or tenant accountability needs consistent aggregation and an identity that survives process restarts.
Make alerts actionable
A useful alert should tell the responder what changed and where to look next. An interface-utilization alert without direction, errors, or workload labels creates a ticket that still requires manual reconstruction. A better event includes the interface, traffic direction, related drops or retransmissions, the responsible service when available, and a link to the relevant dashboard.
Fivenines is one option for collecting Linux server and network-device telemetry, including inbound and outbound interface bytes at five-minute intervals, with historical traffic views for spotting bandwidth hogs and capacity trends. Its agent sends telemetry over HTTPS, while SNMP monitoring covers switches, routers, and firewalls. The platform also provides per-container context, dashboards, alert routing, a REST API, and a Terraform provider, so teams can manage monitoring alongside infrastructure code.
Keep packet captures out of the default retention path unless there is a clear security or troubleshooting requirement. Counters and sampled flow data usually provide a lower-overhead foundation, while narrowly filtered captures remain an escalation tool. That separation keeps the monitoring system useful during an incident instead of making the observability pipeline another source of pressure.
Choosing the Right Approach and Making It Stick
The right Linux traffic-monitoring method depends on three constraints: what must be explained, how long the evidence must survive, and how much overhead the host can tolerate.
For a quick saturation check, use ip -s link, nload, or bmon. For a top-talker investigation, move to iftop. For process ownership, use nethogs and socket inspection. For packet behavior, apply a narrow tcpdump filter. For recurring trends, retain summarized counters with vnStat, sampled history with sar, or centralized metrics from exporters and SNMP.
A practical decision checklist
- Need a fast answer: Start with interface counters and connection views.
- Need root-cause ownership: Correlate sockets with PIDs, cgroups, namespaces, and containers.
- Need packet evidence: Identify the interface first, then capture only the relevant host, port, or protocol.
- Need historical planning: Store aggregated counters and preserve enough detail to compare recurring windows.
- Need fleet-wide context: Centralize host, interface, and network-device metrics with consistent labels.
- Need modern workload coverage: Evaluate kernel-native observability where overlays, churn, or encrypted east-west traffic limit packet-capture value.
Traditional packet capture remains precise for a defined exchange, but it can be expensive at high rates and incomplete in modern distributed environments. Recent technical coverage claims that conventional monitoring captures less than 40% of relevant network traffic in multi-node deployments, while eBPF-based tools observe about 98% of flows in Kubernetes environments. (2025 eBPF network observability paper) Those figures are specific to the paper's stated context, not a universal guarantee, but they support a useful direction: kernel-level flow, socket, and stack telemetry can complement or replace broad packet capture when workload context matters.
Decision principle: Stay with counters and targeted tools when the environment is small and the question is narrow. Invest in process-aware, kernel-native observability when the fleet is containerized, multi-tenant, or difficult to inspect through interfaces alone.
Automation makes the choice durable. Define collectors, dashboards, alert policies, and labels through APIs or Terraform, then test alerts against real traffic conditions. A runbook should state which command to run first, which evidence justifies escalation, and how to identify the workload before anyone throttles or restarts a service.
Fivenines combines Linux host metrics, interface traffic, SNMP device monitoring, per-container context, dashboards, and alert routing in one platform, with HTTPS-based agent telemetry and API or Terraform management. Visit Fivenines to connect network traffic visibility with the rest of the infrastructure signals needed during the next saturation incident.