Disk Space Monitoring: Metrics, Alerts, and Best Practices


A routine deployment can turn a healthy server into an outage before anyone notices. A debug flag increases log volume, rotation misses one mount, and the dashboard still shows a reassuring green panel because it watches / while the application writes to /var/log. By the time the database stops checkpointing, the first system affected may be the monitoring system itself.
That's why disk space monitoring has to answer more than “how full is this filesystem right now?” It needs to show where capacity is being consumed, how quickly usage is changing, which filesystem resource is near exhaustion, and how long the remaining headroom will last. Percentage alerts still have a place, but they're only one signal in a time series that should guide both incident response and capacity planning.
Table of Contents
- Why Disk Space Monitoring Still Breaks Production
- The Core Metrics You Actually Need to Track
- Filesystem Differences That Change Your Alerts
- Setting Thresholds and Forecasting Exhaustion
- Collectors, Exporters, and an All-in-One Pipeline
- Retention, Aggregation, and Long-Term Storage
- Runbooks and Failure Simulation for Low-Disk States
- Putting It Together With Fivenines
Why Disk Space Monitoring Still Breaks Production
At 3 AM, a routine deploy triggered verbose debug logging on an application host. The /var/log mount crossed 95% used over six hours, but no page arrived. The partition had been excluded from logrotate.conf, so the expected cleanup never happened. By morning, the database couldn't checkpoint, the application crashed, and the only surviving breadcrumb was a stale systemd journal.
The failure wasn't caused by a lack of monitoring software. It came from incomplete coverage and the wrong mental model. A point-in-time check can report a volume's current state, but it can't explain whether usage is stable, accelerating, or rising on a mount that nobody included in the scrape configuration.
Operational rule: A filesystem that isn't collected is not healthy. It's unknown.
Percentage-used alerts also miss inode exhaustion. On a filesystem holding enormous numbers of small files, blocks can remain available while the inode table is depleted. The result looks confusing during an incident, because df -h appears acceptable even though new files can't be created.
Fast growth creates another gap. A volume may sit below a warning threshold during one scrape and cross a critical boundary before the next useful review. Fixed thresholds also treat a small root partition and a large data volume as if the same percentage represented the same recovery runway. Guidance commonly recommends warning around 75–80% used and escalating at 90%, while also adjusting alerts for absolute free space and partition size, as described in disk space monitoring guidance before storage runs out.
The practical lesson is straightforward. Monitoring must cover every relevant mount point, store repeated samples, track filesystem-specific resources, and calculate a growth trend. Microsoft SQL Server's Disk Usage Summary report illustrates the same evolution, combining current usage with database and log growth trends in historical reporting documented by Microsoft's system data collection reports. Storage administration became a data-series problem because the question is no longer only whether a disk is full. It's when the disk will become unusable, and what workload will fail first.
For a broader treatment of invisible failure modes, silent failures and how to monitor what you can't see coming is a useful companion.
The Core Metrics You Actually Need to Track
A disk is easier to understand as a water tank. Block usage tells the operator how much water is already in the tank. Available bytes show the remaining volume. Growth rate reveals how quickly the level is rising, while mount-point scope identifies which tank is serving the workload. A single percentage hides those different trajectories.
Block usage shows immediate capacity pressure
For a quick Linux check, use:
df -h --output=source,size,used,avail,pcent
Telemetry systems generally derive used bytes from total size minus available bytes. In Prometheus with Node Exporter, that means:
node_filesystem_size_bytes - node_filesystem_avail_bytes
The absolute value matters alongside the percentage. A high percentage on a small system volume leaves less room for cleanup, package operations, temporary files, and recovery artifacts than the same percentage on a large data volume.
Inodes expose the small-file failure mode
Run:
df -i
Prometheus can compare node_filesystem_files with node_filesystem_files_free. This catches a filesystem that has plenty of blocks but no file entries left. The risk is particularly important for logs, container layers, session tokens, mail spools, and build workspaces that create many small files.
Growth rate turns a snapshot into a forecast
A capacity sample becomes operationally useful when it is compared with an earlier sample. The basic calculation is the change in used bytes divided by elapsed time. A moving average can smooth backup bursts, batch jobs, and cleanup events before the forecast is evaluated.
Historical storage tooling follows this pattern by retaining repeated measurements, with one example using a minimum historical granularity of one hour for disk-space entries and another generating charts from periodic reports. The WinDirStat project represents the older inspection model, while historical monitoring extends that view into ongoing capacity analysis.
Scope prevents mount-point blind spots
Every mount point needs its own labels and alert context. /, /var, /tmp, database volumes, container storage, and backup mounts can fail independently. A dashboard that aggregates them into one host-level percentage can hide the exact partition that will stop accepting writes.
| Metric | What it tells you | Linux command | Prometheus exporter metric |
|---|---|---|---|
| Block usage | Used, available, and total filesystem capacity | df -h --output=source,size,used,avail,pcent |
node_filesystem_size_bytes, node_filesystem_avail_bytes |
| Inode usage | Whether file entries, rather than blocks, are running out | df -i |
node_filesystem_files, node_filesystem_files_free |
| Growth rate | How quickly used capacity is changing | Compare repeated df samples |
Rate or regression over filesystem usage series |
| Mount-point scope | Which filesystem is approaching failure | df -hT |
mountpoint, fstype, and instance labels |
A useful dashboard should make these signals easy to correlate. Teams refining their telemetry layout can also consult metrics and dashboards for practical observability design.
Filesystem Differences That Change Your Alerts
Filesystem choice changes what “full” means. An alert policy built around block percentage alone can work acceptably for one workload and fail badly for another.
ext4 requires inode visibility
ext4 allocates its inode structure when the filesystem is created. A volume containing many small log files or session objects can therefore consume its inodes before it consumes most of its blocks. df -h may look comfortable while df -i shows that file creation is close to failure.
For ext4, the primary policy should include both block utilization and inode utilization. The filesystem comparison in Linux filesystem guidance covering ext4, XFS, and btrfs explains why df -i belongs in routine monitoring, not only in post-incident investigation.
XFS puts the emphasis on blocks and I/O
XFS allocates inodes dynamically, so inode exhaustion is less likely while block capacity remains. That shifts attention toward available blocks, write behavior, and I/O health. XFS still deserves filesystem-aware dashboards because metadata behavior, allocation pressure, and fragmentation can affect write performance before a simple capacity gauge reaches its final boundary.
btrfs needs allocation and ENOSPC context
btrfs uses copy-on-write behavior and reserves space for metadata and snapshots. Reported free space can therefore give an incomplete picture of what new writes can safely allocate. Monitoring should include data usage, allocated pools, snapshot growth, and filesystem warnings such as ENOSPC.
| Filesystem | What exhausts first | Primary alert metric | Common blind spot |
|---|---|---|---|
| ext4 | Blocks or fixed inode capacity | Block and inode utilization | df -h can hide inode exhaustion |
| XFS | Usually block capacity or allocation pressure | Available blocks plus I/O health | Assuming inode checks explain every write failure |
| btrfs | Metadata, snapshot, or allocation pools | Data and allocated usage plus ENOSPC events |
Treating reported free space as fully allocatable |
The alerting system should attach the filesystem type to every time series. That label lets operators route ext4 inode alerts differently from XFS block alerts and prevents a universal rule from creating misleading confidence.
Setting Thresholds and Forecasting Exhaustion
A single 80% rule is easy to deploy and easy to misunderstand. It says where the volume is, but not whether the remaining space will last through the next maintenance window or disappear during the next batch job.
A practical policy uses tiered thresholds and a forecast. The exact values should reflect workload behavior, recovery procedures, and partition size, but a common operational model warns around 75–80% used and escalates at 90%, as documented in disk usage monitoring best practices for DevOps teams. Teams can then add action thresholds below the point where writes become unreliable.
Use thresholds as gates, not predictions
A warning should create ownership before an incident exists. A page should identify a volume that needs immediate review. A critical alert should protect the service from entering a state where cleanup, logging, or database writes can no longer proceed.
| Tier | Percent used | Forecast window | Action |
|---|---|---|---|
| Warning | Around 70–80% | Review the trend and ownership | Confirm growth source, rotation, retention, and planned capacity |
| Page | Around 85% | Treat as an active operational risk | Investigate and begin cleanup or expansion |
| Critical | Around 90% and above | Protect the workload immediately | Execute the runbook, preserve evidence, and escalate service decisions |
These values are not substitutes for forecasting. A slowly growing volume can remain under a threshold for a long time and still deserve a ticket today, while a fast-growing log volume may need a page well before the percentage looks dramatic.
Calculate time to exhaustion
A simple forecast uses the recent slope of used bytes. For a seven-day window, calculate a linear regression over the available hourly samples, then divide the remaining capacity by the estimated growth per hour. A 24-hour moving average can reduce noise from short-lived bursts before the slope is calculated.
For example, a 100 GB volume growing at 1.2 GB per day would reach a critical boundary in roughly nine days, while the same percentage context on a 2 TB log volume could represent about 47 days, based on the planning example in the brief. The figures are useful because they show why percentage alone cannot express urgency. The underlying calculation should still account for retention changes, scheduled backups, deployments, and known bursts.
Forecasts need guardrails. A negative or near-zero slope shouldn't trigger a false “safe forever” conclusion, and a short burst shouldn't automatically force an expansion. Alert annotations should include the mount point, current available bytes, recent growth rate, forecast horizon, filesystem type, and the likely owning service.
Practical rule: Page on both state and trajectory. A volume can be below the percentage threshold and still be on track to exhaust before the next planned intervention.
Teams designing notification routing can use how to set up alerts as a reference, but the final policy should live with the service runbook. An alert without an owner, action, and escalation path only creates noise.
Collectors, Exporters, and an All-in-One Pipeline
The collector stack should match the estate. Linux hosts commonly expose filesystem data through Node Exporter, Windows hosts through WMI-based performance collection, and legacy storage arrays through SNMP. Each source provides useful visibility, but each adds configuration, labels, upgrades, and failure modes.
Node Exporter's filesystem collector supplies mount-point and filesystem metadata, while its textfile collector can publish custom measurements from local scripts. WMI exposes Windows performance counters, including volume-related information from the PhysicalDisk area. SNMP polling can retrieve storage data from enterprise NAS and arrays through standard host-resource interfaces.
A Prometheus deployment should filter irrelevant filesystems before storing them. A minimal scrape configuration can use relabeling to drop read-only filesystems and loop mounts, while retaining writable application and system volumes:
scrape_configs:
  - job_name: node
    static_configs:
      - targets: ["server:9100"]
    metric_relabel_configs:
      - source_labels: [fstype]
        regex: "squashfs|iso9660|tmpfs"
        action: drop
      - source_labels: [device]
        regex: "/dev/loop.*"
        action: drop
The exact filters depend on the environment. Over-filtering creates blind spots, while collecting every pseudo-filesystem increases cardinality and dashboard clutter. Basic Linux inspection remains valuable during incidents, and Linux storage usage commands explained provides a useful command reference for operators.
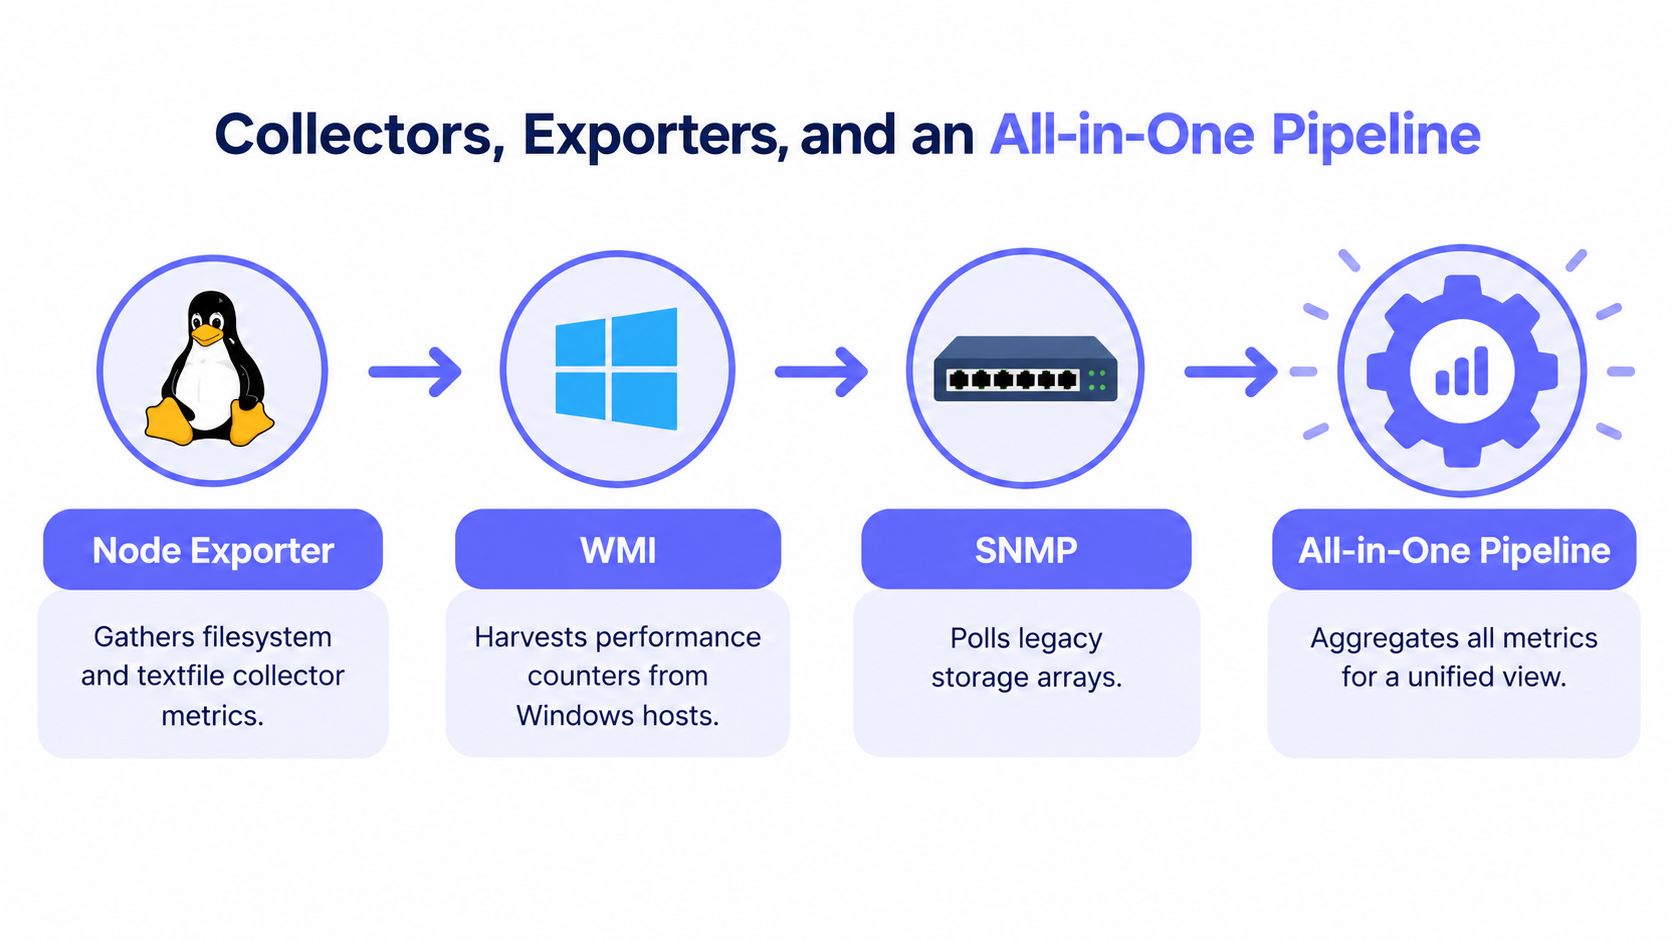
An all-in-one pipeline such as Fivenines can consolidate agent-based Linux and Windows collection with broader infrastructure monitoring, reducing the number of separate exporters and alert paths that an operator must maintain. The trade-off is real. A consolidated platform can simplify mount-to-server mapping and grouped alerting, while a hand-built Prometheus stack offers deeper custom metric control and PromQL flexibility.
A video walkthrough can help teams compare those operational models:
Retention, Aggregation, and Long-Term Storage
High-resolution disk metrics are valuable during an incident, but retaining every raw sample forever creates a second storage problem. On a large fleet, one-minute collection across 200 servers can produce roughly 8 million data points per filesystem metric per day, according to the planning data supplied for this article. The operational question is therefore not whether to retain history, but which resolution is worth keeping for each decision.
Match resolution to the question
Incident forensics need enough detail to correlate a fill event with a deploy, backup, or log burst. Capacity planning needs a smoother series that makes sustained growth visible. Procurement and architecture reviews need a longer horizon, but not necessarily every raw point.
A practical retention layout is:
- Forensics: Keep full resolution for seven days.
- Planning: Keep five-minute aggregates for 30 days.
- Trend review: Keep one-hour aggregates for 13 months.
Those retention periods come from the supplied planning model and should be treated as a starting policy rather than a universal mandate. Workloads with sharp bursts may need more detailed short-term data, while stable systems can downsample earlier.
Store long history outside the primary system
Prometheus remote_write can send samples to long-term systems such as Thanos or Mimir, where object storage supports broader retention without forcing the primary Prometheus instance to carry every historical sample. Recording rules can calculate smoothed usage, growth rate, and forecast signals before remote storage receives them.
The retention policy should preserve at least one complete quarterly comparison cycle, so capacity reviews can compare one quarter against the next before procurement decisions are made. Teams evaluating operational documentation can also review data retention policies and examine case studies from Faberwork LLC for broader data-center management context.
Downsampling isn't free of risk. If raw data disappears too soon, a team may know that a volume filled but not which short-lived job caused the slope to change. Retention design should therefore preserve raw data through the period when incidents are most likely to be investigated, then keep derived series for longer planning horizons.
Runbooks and Failure Simulation for Low-Disk States
A full disk rarely announces itself through a clean, durable alert. The syslog daemon may stop writing, syslog-ng may fall back to a limited buffer, and systemd-journald may reject new entries. The first thing lost can be the evidence needed to explain why the disk filled.
The runbook should assume that the monitoring path is degraded. It should give the on-call engineer short commands and explicit decisions:
- Confirm filesystem state: Run
df -hTto see type, capacity, and mount points. - Check inodes: Run
df -ibefore assuming the problem is block usage. - Find large paths: Use
du -shwith--thresholdto focus the search on meaningful consumers. - Find deleted files still held open: Run
lsof +L1, then restart or signal the owning process according to the service procedure. - Reduce journal retention: Use
journalctl --vacuum-sizeonly after capturing the evidence required for the incident.
The response must distinguish safe cleanup from destructive cleanup. Operators should know who can approve deleting logs, who can extend a volume, what evidence must be copied before truncation, and when the service should fail over instead of continuing to write to a damaged filesystem.
A runbook that has never been exercised is folklore.
Failure simulation turns those instructions into an operational skill. A scheduled test can fill a deliberately isolated tmpfs or a 200 MB scratch volume, then verify that the alert routes correctly, logs degrade in the expected way, and the cleanup procedure restores normal operation. The test should also confirm that inode exhaustion and block exhaustion produce distinguishable signals.
The simulation belongs on the calendar, not in a postmortem wish list. Recent guidance emphasizes multi-level alerts, separate monitoring for log ingestion and queue depth, and explicit low-storage testing to catch silent gaps in audit and operational logs, as discussed in guidance on preventing silent gaps in file audit logs. Testing the runbook quarterly keeps ownership, commands, escalation, and recovery steps aligned with the actual estate.
Putting It Together With Fivenines
Many teams already have a partial stack. Prometheus and Grafana may cover Linux hosts, an SNMP poller may cover an aging storage array, and an old Nagios check may still watch one critical volume. The danger isn't only duplication. It's inconsistent mount labels, different thresholds, and a partition monitored by one system while responders trust another.
A coherent adoption checklist looks like this:
- Inventory every mount point, volume, filesystem type, and service owner.
- Collect blocks, available bytes, inodes, growth rate, and filesystem labels.
- Add tiered state alerts and a separate exhaustion forecast.
- Retain high-resolution data for incident work and aggregates for planning.
- Attach a tested cleanup, expansion, and failover runbook to every page.
- Reconcile legacy exporters before removing any existing check.
Fivenines can collect Linux and Windows filesystem telemetry into a unified monitoring workflow, with partition and mount-point context, alert thresholds, and platform-managed history. It can sit alongside an existing exporter stack or reduce the need to maintain separate collection and alerting paths. The trade-off remains the same as with any consolidated platform, simpler operations in exchange for less direct control than a fully custom Prometheus and Grafana design.
Fivenines provides unified server and infrastructure monitoring for filesystem usage, mount points, alerts, and operational visibility, helping teams turn disk space monitoring into a maintained time series rather than a forgotten check. Visit Fivenines to evaluate the platform and connect disk alerts to a practical incident workflow.