Cost of Monitoring Explained: Pricing Models and Savings


Observability averages 17% of total compute infrastructure spend, while actual monitoring invoices can run 37% to 97% above initial list-price estimates. The vendor's quoted number is almost never the number a team will pay.
That gap comes from the parts sales proposals tend to compress into footnotes: ingestion, retention, high-cardinality metrics, log indexing, alert routing, integrations, and the engineer-hours required to investigate noisy pages. Monitoring has become a meaningful operating expense, not a small fee attached to infrastructure. Gartner-based reporting from 2026 found that 36% of enterprise clients spend more than $1 million annually on observability, 4% spend more than $10 million, and spending is rising about 20% year over year (Gartner-based observability spending analysis).
The practical question isn't which monitoring vendor has the lowest list price. It's which pricing model gives a team control over its total cost of ownership, including telemetry volume and human triage. The sections below treat the bill as an engineering system. Each cost driver has an input, a unit price, and a multiplier that can be audited before procurement signs anything.
Table of Contents
- What Drives the Real Cost of Monitoring
- The Building Blocks That Make Up Your Monitoring Bill
- Three Pricing Models and When Each One Punishes You
- Sample Cost Calculations for Teams of Different Sizes
- A Real-World Story of a Surprise Monitoring Invoice
- Proven Strategies to Cut Monitoring Spend Without Losing Visibility
- Choosing the Right Pricing Model for Your Team
What Drives the Real Cost of Monitoring
The cost of monitoring starts with a budget reality: observability now absorbs a substantial share of infrastructure spending. A widely cited 2025 survey put average observability spend at 17% of total compute infrastructure spend, with 10% as the most common response (Grafana's 2025 Observability Survey). That figure includes far more than an agent. It reflects metrics, logs, traces, dashboards, storage, alerting, incident workflows, and the staff time needed to keep the system useful.
Actual invoices commonly exceed the first estimate by 37% to 97%, according to coverage of hidden monitoring costs (monitoring invoice analysis). The causes are predictable: custom metric cardinality, indexed logs, retention defaults, APM span indexing, container counting, high-water-mark billing, migration work, and overlapping tools. The surprise isn't mysterious. The buyer modeled the license, while the platform billed the workload.
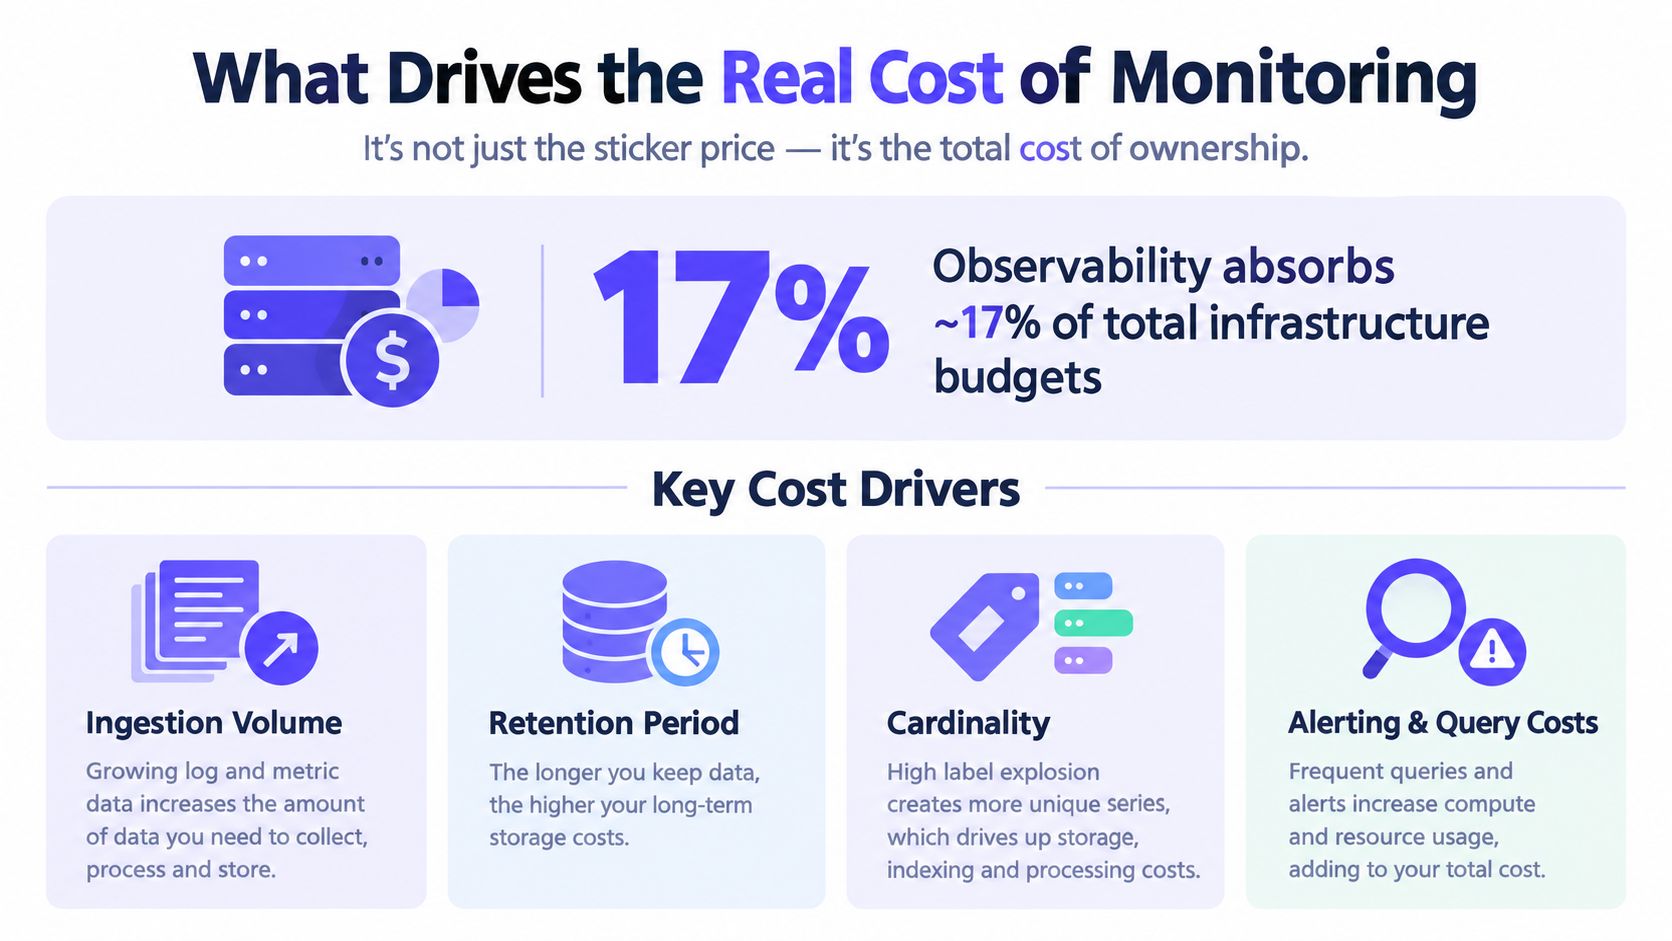
The four cost forces
Data volume grows with service sprawl. More services create more endpoints, jobs, containers, logs, and telemetry streams. A platform team can add visibility without adding servers, yet still increase ingestion charges because every new workload emits data.
Cardinality multiplies metric series. A metric with a small, stable label set behaves very differently from one tagged with user_id, request_id, pod identifiers, or dynamically generated route values. Each distinct label combination can become another time series, another sample stream, and another storage obligation.
Retention converts activity into a long-term charge. Ingestion is only the first billable event. Keeping data for investigations, compliance, or reporting creates continuing storage costs. Usage-based observability services commonly bill samples ingested separately from metric storage, often measured per million samples and per gigabyte over a 30-day period (data observability pricing mechanics).
Alert noise consumes paid engineering time. A cheap monitoring platform can become expensive when on-call engineers repeatedly validate low-value alerts, suppress duplicates, repair integrations, and reconcile conflicting dashboards. Adjacent monitoring-market analysis estimates alert handling can consume 10 to 20 hours per week, while a separate 2025 signal says enterprises use only 13% of telemetry data on average, evidence that collection and operational use often diverge (alert-handling and monitoring labor analysis).
Practical rule: Price monitoring in units the platform team can control, not in the bundled annual figure presented by sales.
A useful baseline should identify cost per host per month, cost per million data points ingested, storage cost by retention tier, and cost per on-call investigation. Teams that already maintain a performance baseline have a stronger starting point because they can distinguish necessary signal from collection that merely creates dashboards.
The Building Blocks That Make Up Your Monitoring Bill
A monitoring invoice is usually a stack of separate meters. The agent may look like the obvious expense, but ingestion and retention often determine the final amount.
| Cost Component | Typical Pricing Unit | Common Range | Primary Cost Multiplier |
|---|---|---|---|
| Agents and collectors | Per host or node per month | $8 to $35 monthly | Host count, container accounting, operational maintenance |
| Metrics and data points | Per million samples ingested | $0.10 to $0.30 per million samples | Scrape frequency, service count, cardinality |
| Metric retention | Per GB per 30-day period | Usage-based | Retention window, hot storage, historical volume |
| Uptime checks | Per check per region per month | $1 to $5 monthly | Check frequency, regions, endpoints |
| Alerting and routing | Per rule, recipient, or page | Vendor-specific | Rule count, recipients, paging volume |
| Integrations and shippers | API calls, events, or connector volume | Vendor-specific | Log forwarding, third-party systems, data egress |
| Team overhead | Engineer time per investigation | $50 to $120 per incident investigated | False positives, escalation paths, remediation complexity |
The ranges in this table come from the assigned pricing framework and should be treated as planning inputs, not universal market rates. Published pricing analysis also shows a wide spread, from free or open-source systems and tools priced around $99 per month at the low end, through self-serve plans around $750 per month, to enterprise examples around $45,000 to $75,000 per year for monitored-table tiers (independent data-observability pricing analysis).
Agents are only the entry fee
Per-host agents are easy to count, which makes them attractive in procurement discussions. They still create operational work across upgrades, permissions, configuration drift, resource consumption, and troubleshooting. A per-container model can behave very differently from a per-node model, especially in environments with frequent workload churn.
The lever is fleet design. Before signing, teams should define whether a “host” means a VM, node, container, tenant, or high-water-mark resource, then test that definition against production behavior.
Ingestion responds to telemetry design
Samples accumulate through scrape frequency, metric count, log volume, trace volume, and label combinations. A service that doubles its scrape frequency doesn't merely become more observable. It produces more billable samples, and the same infrastructure can cost more without any increase in host count.
The lever is metric governance. Every custom metric needs an owner, a purpose, a label policy, and a retention requirement.
Retention keeps charging after collection stops
Retention tiers can separate recent operational data from older investigative or compliance data. Without that separation, teams often pay premium storage rates for information that nobody queries regularly.
The lever is a written retention map. It should state which data stays hot, which moves to warm or cold storage, and which is deleted after its operational purpose ends.
Synthetic checks and incident routing create their own multipliers. Global uptime coverage can multiply a single endpoint across regions, while broad recipient lists and duplicate rules can turn one failure into many pages. Integrations add another layer when log shippers, APIs, ticketing systems, and chat workflows move events between platforms.
The lever is consolidation. Monitoring teams should count active checks, alert rules, recipients, connectors, and forwarded events as carefully as they count hosts.
Finally, labor belongs on the bill. If an engineer spends an hour validating a false positive, that time is part of monitoring's ownership cost even when the vendor charges nothing for the alert. The infrastructure monitoring overview gives teams a useful vocabulary for separating server, network, uptime, and workflow coverage before those categories overlap across multiple products.
Three Pricing Models and When Each One Punishes You
Pricing models reward different operating patterns. The right choice depends less on company size than on whether the team's monitored footprint, telemetry volume, or budget needs are more predictable.
| Pricing Model | How It Bills | Best Fit Team | Common Penalty | Predictability |
|---|---|---|---|---|
| Per-host | Fixed charge for each server, node, or container | Stable VM fleets with predictable counts | Container churn, node expansion, high-water-mark billing | High when host definitions stay stable |
| Usage-based | Charges for ingested samples, metrics, logs, or traces | Teams needing cost to track workload activity | Traffic spikes, custom labels, verbose logs, retention growth | Moderate, requires usage controls |
| Flat subscription | Fixed fee for bundled capacity and features | Enterprises needing budget certainty | Paying for unused headroom or negotiated capacity | High at the contract level, lower if overages apply |
Per-host pricing favors stable fleets
Per-host billing works well when machines remain present and telemetry volume is consistent. It becomes painful when the vendor counts containers, applies high-water marks, or treats short-lived workloads as persistent billable entities. Kubernetes teams need the contract definition, not the product brochure.
Per-host pricing suits conventional VM estates and some MSP models, provided the agreement states how client environments are counted and whether the operator can apply a clear per-client markup.
Usage-based pricing tracks activity, then amplifies it
Ingestion pricing can be efficient for predictable workloads because teams pay for the signal they send. It punishes organic growth when developers add labels, increase scrape frequency, enable verbose logs, or retain more traces without a cost review.
This model requires hard guardrails. Cardinality ceilings, log sampling, ingestion alerts, and explicit overage rates should be contract requirements. The DevOps monitoring tools guide can help teams compare functional coverage, but procurement still needs to inspect every billable dimension.
Flat subscriptions trade flexibility for certainty
A flat plan is often sensible for regulated enterprises with firm retention requirements and a need for predictable budgeting. It can be wasteful for smaller teams that buy capacity for a future state that may not arrive.
Hybrid pricing is increasingly common. A contract may combine host fees, indexed log volume, retained metrics, trace ingestion, and overages. The data addendum matters more than the headline subscription.
Sample Cost Calculations for Teams of Different Sizes
The following scenarios use the assigned planning assumptions to show how teams can model the cost of monitoring before procurement. They aren't verified customer bills. They are structured examples, and each team should replace the inputs with contract rates and measured usage.
A solo operator with minimal tooling
A solo operator has 5 servers, a free-tier agent, 120 metrics per host, and 30-day retention. The tooling line is approximately $0 per month under the stated assumption. The cost appears in triage time, modeled here as $400 per month.
The calculation is simple:
- Agent and platform fees: $0 per month under the free-tier assumption.
- Metric and storage charges: $0 in this scenario, because the example assumes the free tier covers the stated footprint.
- Triage overhead: $400 per month.
- Total monitoring cost: $400 per month.
The lesson is uncomfortable but useful. Open-source or free monitoring doesn't eliminate cost. It shifts cost into setup, rule maintenance, upgrades, alert investigation, and recovery work.
A 20-person DevOps team
The second team operates 80 hosts, collects 800 metrics per host, retains data for 90 days, and uses synthetic uptime checks. The modeled SaaS invoice is $4,200 per month.
A usable worksheet looks like this:
- Host coverage: 80 hosts multiplied by the contracted per-host rate.
- Metric footprint: 80 hosts multiplied by 800 metrics, before custom labels and derived series.
- Retention: 90 days, which creates a longer storage obligation than a short operational window.
- Synthetic checks: Endpoint and region count multiplied by the check rate.
- Triage overhead: Included in the $4,200 scenario total, rather than treated as free labor.
- Total monthly cost: $4,200.
The team shouldn't accept that total without separating software from labor. If the invoice is $4,200 but the platform group spends substantial time investigating low-value pages, the ownership cost is higher than the SaaS line.
A 200-host MSP environment
The MSP example operates 200 hosts, collects 1,500 metrics per host, retains data for 13 months, and uses ingestion-based pricing. Its modeled bill is $38,000 per month, with increases during client onboarding windows.
The worksheet exposes why multi-tenant operations are difficult:
- Host and tenant footprint: 200 hosts distributed across clients, with onboarding adding temporary or duplicated telemetry.
- Metric footprint: 200 multiplied by 1,500 metrics, before label combinations and tenant dimensions.
- Retention: 13 months, which keeps historical data in the billing model long after an incident closes.
- Ingestion overage: Driven by tenant labels, exporter behavior, onboarding spikes, and log volume.
- Triage overhead: Included in the scenario total, because client-facing escalation work is part of ownership.
- Total monthly cost: $38,000, with a variable peak during onboarding periods.
| Team Profile | Hosts | Metrics/Host | Retention | Pricing Model | Tool Cost | Triage Overhead | Total Monthly |
|---|---|---|---|---|---|---|---|
| Solo operator | 5 | 120 | 30 days | Free-tier agent | $0 | $400 | $400 |
| 20-person DevOps team | 80 | 800 | 90 days | Per-host SaaS | Included in scenario | Included in scenario | $4,200 |
| 200-host MSP | 200 | 1,500 | 13 months | Ingestion-based | Included in scenario | Included in scenario | $38,000 |
The worksheet matters more than the totals. A buyer can replace host count, metric volume, retention, ingestion rate, check count, and labor assumptions with internal measurements. That produces a forecast rather than a sales estimate.
A Real-World Story of a Surprise Monitoring Invoice
A specific company story with the exact monthly invoices, migration timeline, exporter behavior, label combinations, and corrective actions described in the brief isn't included in the verified data. Those details can't be presented as a factual case study without a source. The underlying failure pattern is still clear from the pricing mechanics.
A SaaS team can retire legacy hosts and expect a per-host bill to fall. After moving to usage-based ingestion, the team may discover that host count was never the dominant variable. Kubernetes labels, verbose application logs, traces, exporters, and synthetic checks can create a larger bill even when fewer machines are running.
The failure sequence usually looks like this:
- The migration team compares host counts. Retired servers make the new plan appear cheaper.
- Application teams add telemetry dimensions. Labels that help debugging also create more unique series.
- Logs become more verbose. Errors, request context, and stack traces increase indexed volume.
- Synthetic coverage expands. New services add endpoints and regions to the check matrix.
- The invoice follows usage, not expectations. The platform bills the resulting ingestion and retention footprint.
A cost explorer then reveals the issue. Cardinality, indexed logs, span volume, or check coverage has become the silent multiplier. The corrective response is operational, not cosmetic: establish label allowlists, drop unneeded dimensions, sample routine logs, retain errors more deliberately, review synthetic coverage, and negotiate committed ingestion tiers only after usage has been measured.
The invoice is usually the symptom. The missing telemetry budget policy is the cause.
Teams should also treat migration as a billing change, not only a tooling change. A side-by-side period, daily usage alerts, and a rollback clause give finance and platform engineering time to catch a runaway dimension before it becomes a renewal problem.
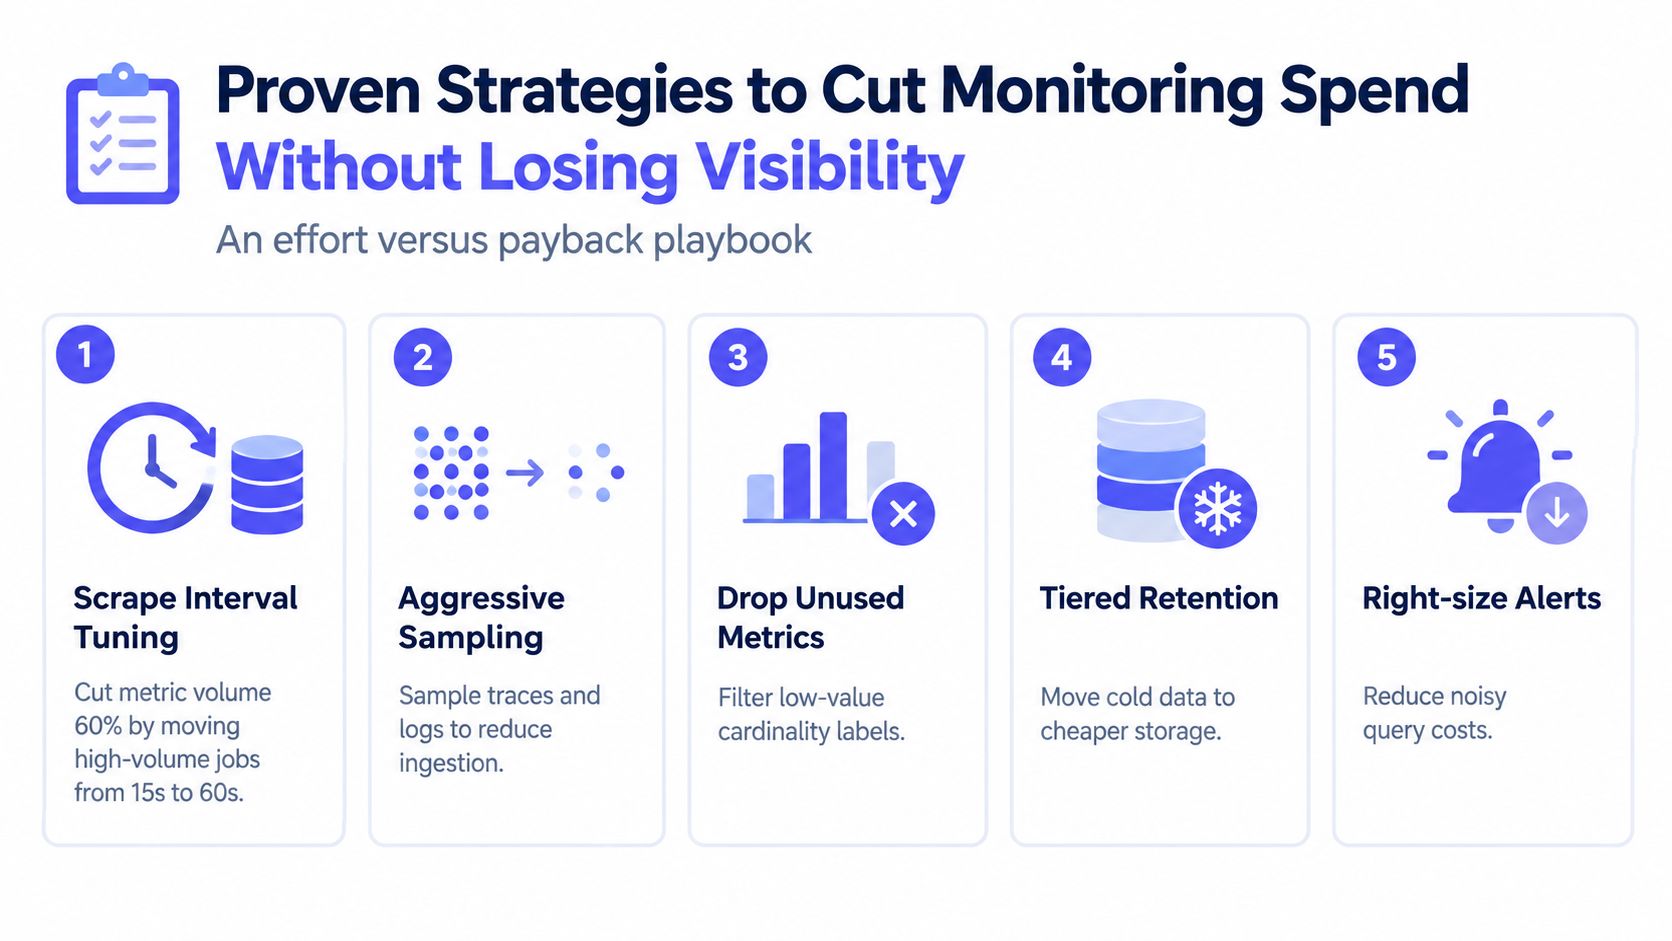
Proven Strategies to Cut Monitoring Spend Without Losing Visibility
The best savings come from deleting low-value telemetry before negotiating a discount. Reserved capacity cannot rescue a stack that collects everything, retains everything, and pages everyone.
Start with telemetry volume
Tune scrape intervals first. The assigned optimization plan identifies a potential 60% reduction in metric volume when high-volume jobs move from 15-second to 60-second polling (monitoring cost controls). That change shouldn't apply to every metric. Fast polling belongs on signals where rapid detection changes the response. Capacity gauges, slow-moving inventory, and many infrastructure metrics can tolerate a longer interval.
Reduce cardinality with allowlists. Drop labels such as pod UIDs, request IDs, and other dimensions that create near-unique series unless an incident workflow uses them. The assigned guidance cites a potential 70% reduction in unique time series from cardinality reduction, but teams should validate the result against their own metric inventory before forecasting savings.
Sample routine logs. The prescribed playbook uses 10% to 20% sampling for routine logs while retaining errors fully. That approach protects diagnostic value without indexing every repetitive event. Sampling rules must preserve security, compliance, and incident evidence requirements.
Make storage and alerting deliberate
Retention tiering moves older data from hot storage to warm or cold tiers. The policy should distinguish live troubleshooting from compliance retention, and it should name the owner responsible for exceptions. Keeping two-year-old data in premium storage by default is a convenience decision with a recurring charge.
Alert grouping and deduplication reduce both paging volume and labor. One incident should produce one actionable page, not a cascade from every dependent service. Teams should measure alerts by acknowledged, actionable, suppressed, duplicate, and escalated categories.
Synthetic checks also need a service-level purpose. Check frequency and regional coverage should reflect customer impact, not a desire to fill a map with green indicators. Removing duplicate checks across overlapping tools can deliver more value than shaving a small amount from an agent fee.
Consolidate before committing
Tool consolidation removes overlapping APM, infrastructure, uptime, and cron monitoring agents. It also reduces dashboard duplication, integration maintenance, access reviews, and training. A tool consolidation approach helps teams compare capability overlap before replacing one product with another.
Annual prepayment and reserved-capacity commitments can reduce list pricing by 20% to 40%, according to the assigned planning guidance, but only when the baseline is stable. Buying a commitment before cardinality and retention are controlled locks the team into waste.
The optimization order is clear:
- Low effort, fast payback: Remove unused dashboards, alert rules, checks, and labels.
- Moderate effort, strong payback: Tune scrape intervals, sample logs, and group alerts.
- Higher effort, durable payback: Redesign retention tiers and consolidate overlapping tools.
- Commercial optimization: Negotiate reserved capacity after usage has stabilized.
The team should forecast savings from measured units, not vendor promises. Every proposed change needs a before-and-after count for samples, series, indexed gigabytes, retained data, pages, and engineer investigations.
Choosing the Right Pricing Model for Your Team
A practical decision starts with workload behavior.
- Solo operators and small startups with predictable workloads should favor per-host or flat pricing, especially when the contract includes the required monitor types without separate ingestion surprises.
- Mid-sized engineering organizations with steady feature velocity can use usage-based pricing, but only with cardinality caps, ingestion alerts, and explicit overage limits.
- Large enterprises with strict compliance retention requirements should favor a negotiated flat subscription with defined retention tiers and overage protections.
- MSPs and multi-tenant operators need per-host or per-client accounting with explicit markup rules, tenant-level usage visibility, and a contract that explains onboarding spikes.
The pre-renewal checklist should be short and unforgiving:
- Contract terms: Confirm every billable unit, high-water mark, minimum commitment, and overage rate.
- Metric audit: Measure samples, active series, custom labels, logs, traces, checks, and retained volume.
- Cardinality ceiling: Require a documented limit and an alert before the ceiling becomes a charge.
- Retention map: Match hot, warm, cold, and deletion policies to actual operational needs.
- Egress review: Check whether exporting logs, metrics, or archives creates additional fees.
- Support terms: Match response commitments to the incidents the monitoring system must support.
- Exit clause: Confirm data export, migration assistance, cancellation windows, and deletion obligations.
The correct comparison is a 12-month total-cost forecast, not the first invoice. It should include software, ingestion, storage, overages, integrations, migration work, and triage labor. A vendor that cannot explain those units clearly isn't offering predictable monitoring.
Fivenines provides unified server metrics, network device health, website uptime, and cron monitoring with an open-source Linux agent, workflow automation, regional checks, integrations, and transparent pricing designed for predictable operations. Teams evaluating the cost of monitoring can visit Fivenines to compare a consolidated platform against overlapping observability tools and model the fit before renewal.