Service Level Objective Guide for Modern SRE Teams

A checkout API starts returning 500 errors at 2 a.m. Half the team is online, the incident channel is active, and someone asks whether the problem is serious enough to wake the rest of the organization. Without a pre-agreed service level objective, the answer depends on whoever happens to be on call.
That uncertainty is expensive. A service level objective gives engineers and product teams a shared reliability target, a measurable error budget, and a policy for deciding when to page, pause releases, or schedule reliability work. It turns service quality from an argument into an operating decision.
Table of Contents
- Why Service Level Objectives Matter When Things Break
- SLI, SLO, and SLA Explained as a Stack
- The Math Behind Availability and Latency SLOs
- Choosing the Right SLI for Your Service
- Setting Targets, Error Budgets, and Alert Policy
- Operationalizing SLOs With Monitoring Tooling
- Common SLO Mistakes and How to Avoid Them
- A Practical SLO Rollout Checklist
Why Service Level Objectives Matter When Things Break
An SLO is an internal reliability contract. It doesn't promise perfection. Instead, it defines the lowest acceptable level of service and gives the team a consistent way to respond when performance moves toward that boundary. Google's service level objective guidance describes SLOs as precise targets built from service level indicators, commonly expressed as the ratio of good events to total events.
At 2 a.m., the value of that contract becomes obvious. The on-call engineer doesn't need to decide whether a small stream of failed checkout requests “feels” severe enough. The team can check the affected user journey, compare the current burn against the available budget, and follow the written policy.
A useful SLO policy answers three operational questions:
- When should the team alert? A fast loss of good events may require an immediate page, while a gradual decline may create a ticket for daytime investigation.
- When should deployments stop? If a release is consuming the budget too quickly, the team can pause feature delivery and protect the service.
- When should reliability work be scheduled? Repeated budget consumption creates evidence for capacity work, testing improvements, architectural changes, or better recovery procedures.
Without those rules, every incident becomes a negotiation. Leadership may override engineering judgment, engineers may disagree about severity, and feature pressure may repeatedly displace reliability work. Teams looking to strengthen that response can also use these incident response best practices as a practical complement to the SLO policy.
Practical rule: An SLO should change what the team does, not merely what appears on a dashboard.
The target must connect to a user-visible outcome. A green CPU graph cannot prove that customers can complete checkout, authenticate, search, or receive a fresh result. The rest of the design follows from that principle: identify the journey, measure its outcome, set a defensible target, and attach decisions to the remaining error budget.
SLI, SLO, and SLA Explained as a Stack
The three terms form a stack. Each layer depends on the layer beneath it.
The measurement layer
A Service Level Indicator, or SLI, is the measurement itself. For request reliability, it is commonly calculated as good events divided by total valid events. For latency, the measurement can describe a percentile of request duration rather than an average, because a small group of very slow requests can create severe user pain while leaving the average looking acceptable.
The SLI needs an explicit definition of a good event. A successful request might return an accepted response and satisfy the service's correctness rules. A valid event should represent real service use, not an excluded health check or irrelevant synthetic request.
The internal target
A Service Level Objective, or SLO, sets the target for that SLI over a defined measurement period. For example, an engineering team might target 99.9% successful requests for a critical journey, with an additional latency condition chosen from observed user needs.
The target belongs to the team's operational practice. Engineers use it to decide whether reliability is within tolerance, whether a release is safe, and whether the team is spending its error budget too quickly.
The external promise
A Service Level Agreement, or SLA, is the customer-facing commitment. It can define service expectations and consequences such as credits, refunds, or escalation rights. The SLA usually involves commercial, legal, and customer-facing stakeholders, while the SLO remains an internal engineering control.
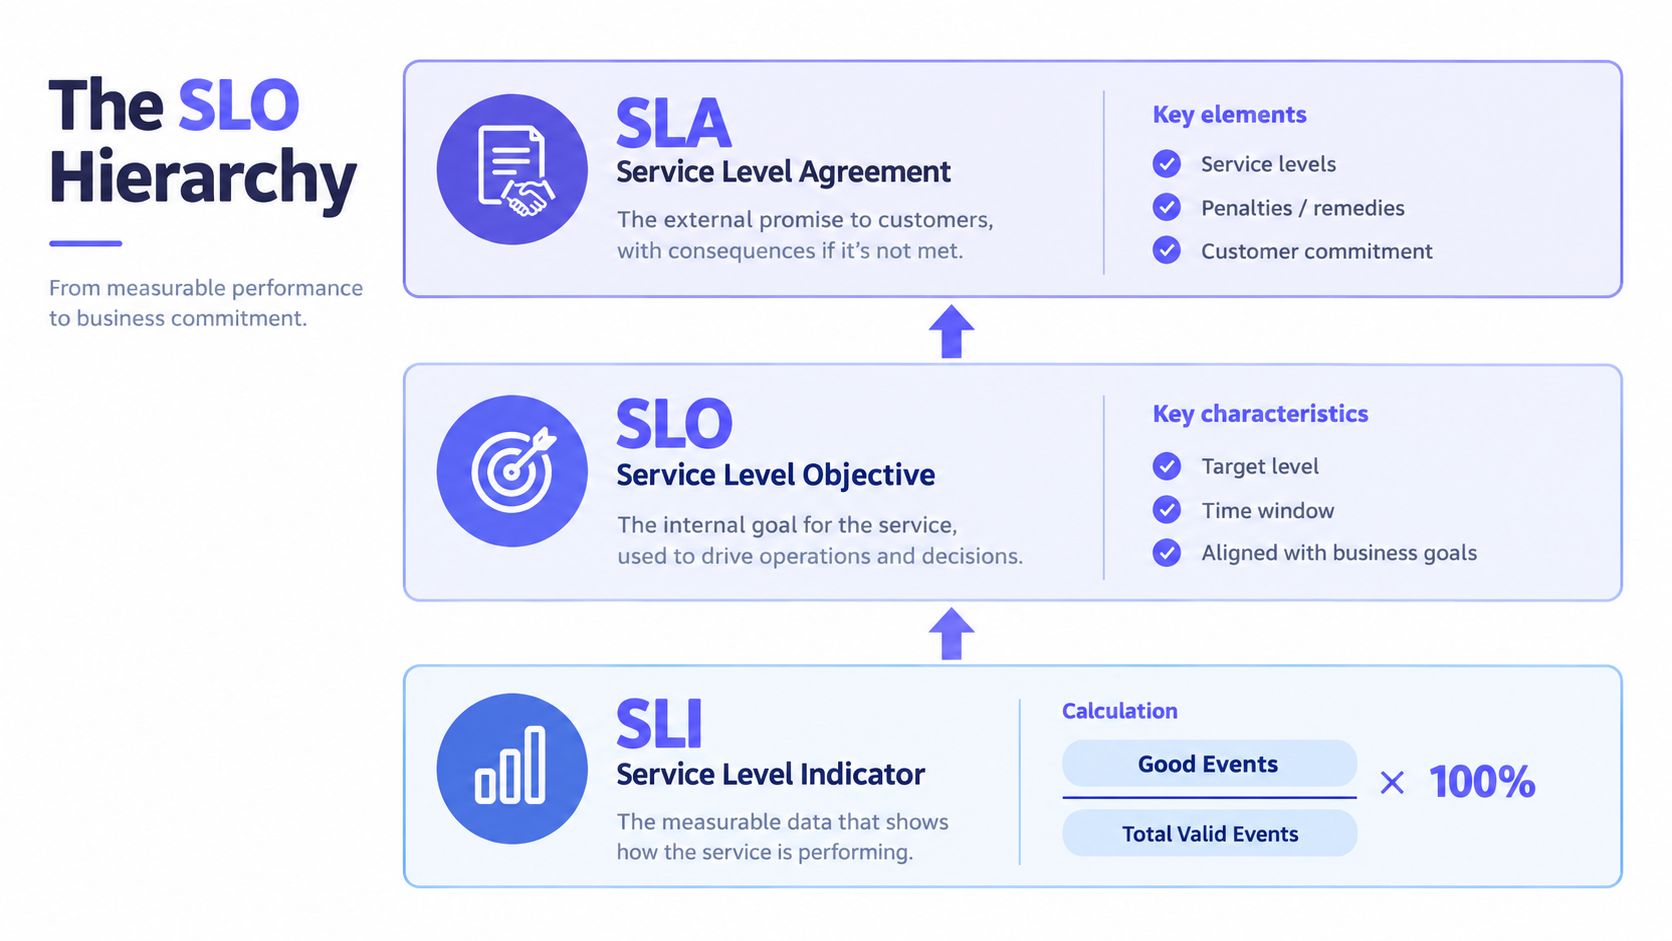
The internal SLO should normally be tighter than the external SLA. Google's enterprise roadmap gives the concrete relationship of 99.95% SLO versus 99.9% SLA, leaving internal room to detect, investigate, and repair a reliability problem before it becomes a customer-facing breach. The difference is 0.05% unavailability for the SLO compared with 0.1% unavailability allowed by the SLA, as described in the enterprise roadmap to SRE.
That buffer doesn't mean the team can ignore the SLA. It gives engineering an earlier control point. Teams that need to connect contractual commitments with operational measurement can also consult this guide to service level agreement monitoring.
The Math Behind Availability and Latency SLOs
Most service level objectives start with two user-facing dimensions: availability and latency. They answer different questions. Availability asks whether the service produced an acceptable result. Latency asks whether the result arrived quickly enough to remain useful.
For availability, the basic SLI is:
good events / total valid events
The definition of “good” must match the service. A read operation may treat an acceptable redirect as successful, while a mutating operation may require a successful response that confirms the requested state change. Health checks, crawlers, test traffic, and other excluded sources should remain outside the denominator when they don't represent the user journey being protected.
Latency needs different math. An average can hide a slow tail, so teams generally choose a percentile and compare it with a threshold that matters to the user. A search service, payment flow, and background worker won't necessarily need the same latency definition. The correct threshold comes from the interaction and its business consequence, not from a convenient dashboard default.
| Dimension | SLI Formula | Example Target | Sample Calculation |
|---|---|---|---|
| Availability | Good valid events divided by total valid events | 99.9% acceptable events | 999 good events among 1,000 valid events produces 99.9% |
| Latency | Selected latency percentile compared with a defined threshold | The chosen percentile remains below the journey threshold | Count requests inside the threshold, then divide by valid requests |
A 99.9% availability SLO allows 0.1% unavailability over its measurement window. The same relationship applies to request events: the allowed bad-event portion is the complement of the target. The team should calculate both forms when useful, because downtime is easier for an operations review to understand while request counts may better represent a high-volume API.
A rolling window gives the team a continuously current view. A calendar window can reset at a boundary and make a service appear healthy only because a new period has started. The important design choice is consistency: the SLI query, target, dashboard, and alert policy must all use the same window definition.
For a single endpoint, suppose the monitoring query counts every valid request and separately counts requests that satisfy the correctness rule. The resulting ratio becomes the availability SLI. A second query can classify requests by duration and evaluate the selected latency percentile. The SLO then compares those measurements with the targets and calculates how much budget remains.
Teams working on dependency-heavy systems may also benefit from an engineer's introduction to reliability block diagrams, particularly when the availability of several components contributes to one user journey. Application-level availability should remain distinct from infrastructure health, and teams can use availability metrics to keep those measurements clearly separated.
Choosing the Right SLI for Your Service
The right SLI starts with the user journey, not with the metric already available in the monitoring system. A platform team can begin by writing the action in plain language, tracing the request path that supports it, and then selecting the measurement primitive that captures the user's result.
A server's CPU utilization may explain why a request failed, but it doesn't establish whether the customer received a usable response. Likewise, a backend success counter can remain healthy while a client-side timeout, rendering error, or broken dependency prevents the journey from completing.
| SLI Type | Best For | Example Query | Common Risk |
|---|---|---|---|
| Availability | APIs, transaction endpoints, authentication flows | Are valid requests producing acceptable results? | A backend success response may hide client-side or downstream failure |
| Latency | Read-heavy APIs, search, interactive pages | Are requests completing within the journey's acceptable threshold? | An average can hide the slow tail |
| Throughput | Queues, ingestion services, event processors | Is the service processing the expected work successfully? | High volume can look healthy while work accumulates or misses its deadline |
| Freshness | Caches, analytics, reports, feeds | Is the returned data recent enough for the user's decision? | A technically successful response may contain stale information |
A funnel for SLI selection
Start with the journey. “A customer completes checkout” is more useful than “the payment service is available.” The journey establishes what success means.
Trace the path. Identify the requests, jobs, data reads, and external dependencies needed to complete that action. This prevents the SLI from stopping at an internal boundary while the user still experiences failure.
Choose the smallest useful measurement. One strong availability or latency SLI can create clearer decisions than a collection of loosely related metrics. Additional indicators belong in supporting diagnosis when they don't define the user outcome.
Test failure visibility. Ask whether the SLI would turn bad when the browser, mobile client, queue, cache, or dependency prevents completion. If it stays green during a user-visible failure, the measurement needs revision.
A service can have several supporting indicators, but the primary SLO should remain understandable to both engineers and product stakeholders. The strongest definition says what the user attempted, what counts as success, and which measurable event proves that success occurred.
Setting Targets, Error Budgets, and Alert Policy
A target shouldn't be selected because the number sounds impressive. It should reflect the user journey's importance, the service's current capability, the cost of failure, and the engineering effort required to maintain the target.
Google's SRE guidance treats the SLO as the lowest reliability level a team can tolerate, encoded as a measurable control. That framing helps avoid two opposite mistakes. A weak target may fail to protect customers, while an unrealistic target may consume so much engineering attention that the team stops treating the policy as credible.
Turn the target into a budget
The error budget is the allowed portion of bad events implied by the SLO. With a 99.9% target, the corresponding budget is 0.1%, and the same complement can be expressed as downtime or as failed requests, depending on the SLI.
The budget should appear in the release process. When the budget is healthy, the team can accept more delivery risk. When a release or incident consumes it rapidly, the policy can require a rollback, a deployment pause, an incident review, or focused reliability work.
A practical policy might distinguish fast consumption from slow consumption:
- Fast burn: A sudden loss of good events consumes a meaningful portion of the budget in a short period. The policy pages the on-call engineer and prioritizes mitigation.
- Slow burn: A gradual regression consumes the budget over a longer period. The policy opens an investigation, assigns an owner, and brings the issue to the next reliability review.
- Sustained risk: The budget remains low even after the immediate incident ends. The policy limits risky changes until the team restores confidence.
The specific thresholds belong to the service. They should be calibrated against incident history and reviewed when the SLO changes. Alerting on raw error counts is less useful because the same count can represent very different levels of risk for services with different traffic patterns and budgets.
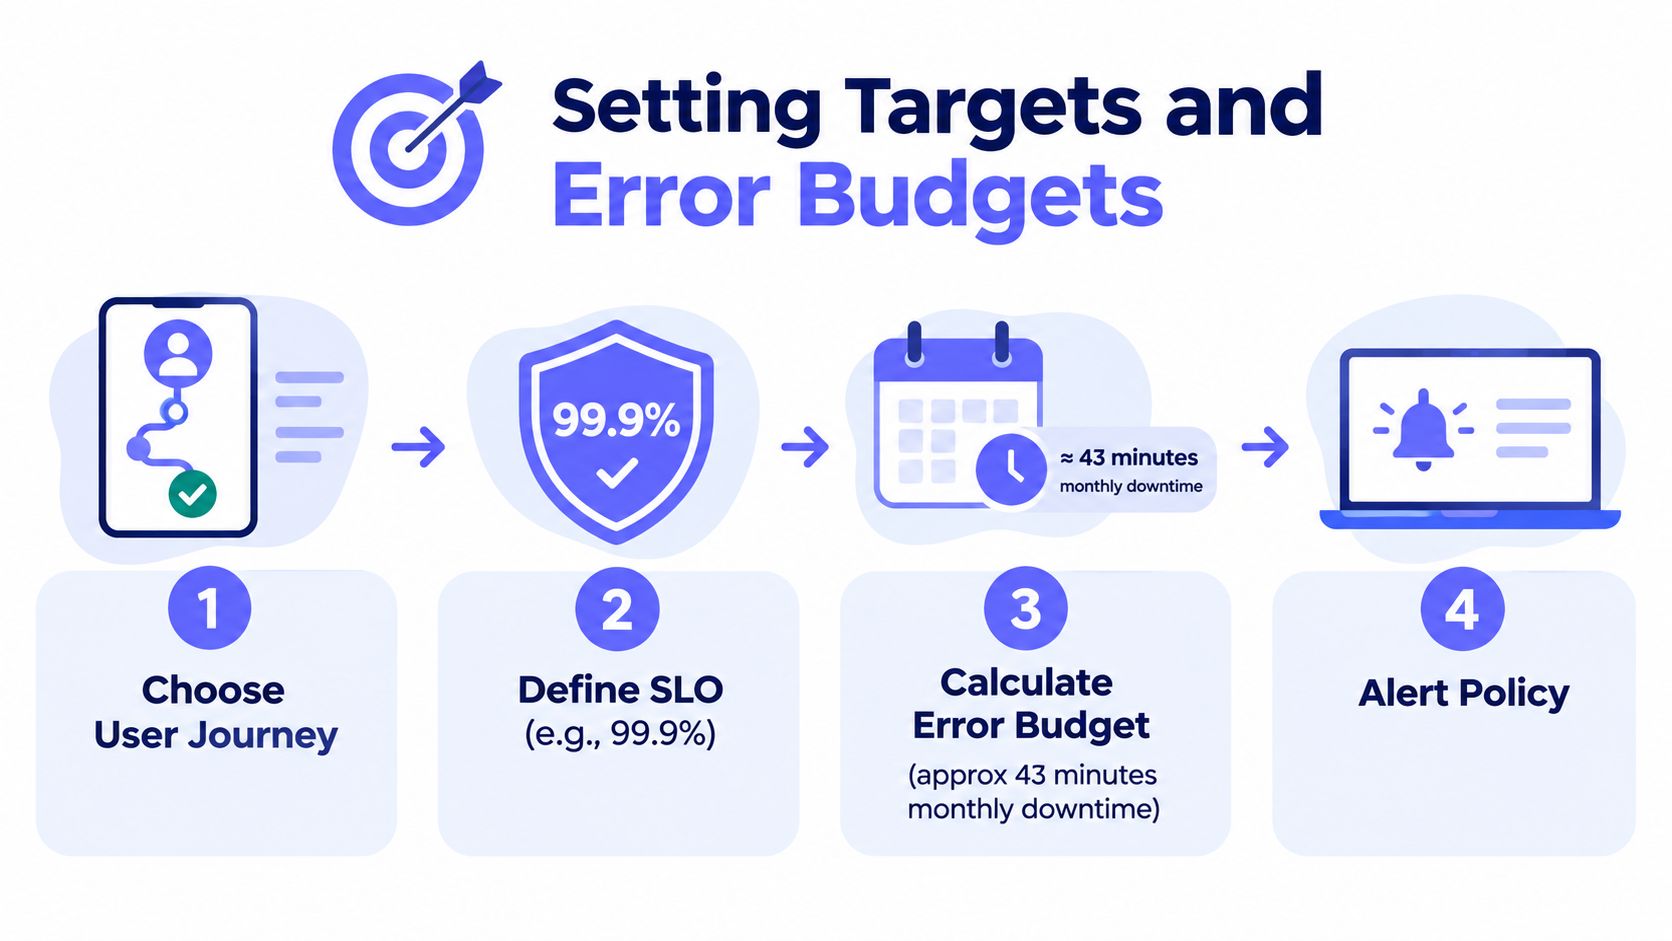
Policy test: Every alert should tell the recipient what decision the remaining budget requires.
A team should document who can pause deployments, who owns remediation, how emergency changes are handled, and when product leadership joins the decision. This makes the SLO a governance mechanism rather than a passive compliance figure.
Operationalizing SLOs With Monitoring Tooling
An SLO becomes operational when telemetry can move through a repeatable pipeline:
- The service emits structured events. Each event includes the fields needed to identify the journey, classify success, measure duration, and exclude invalid traffic.
- The monitoring platform aggregates events. It counts good events and total valid events over the selected window.
- The SLO engine evaluates compliance. It compares the resulting SLI with the target and calculates the remaining budget.
- The alerting layer evaluates burn. It pages or opens a lower-urgency workflow when budget consumption reaches the policy threshold.
- The dashboard supports decisions. Engineers can see the target, current SLI, remaining budget, affected journey, and relevant incident context together.
This pipeline exposes a common implementation problem: inconsistent event labels. If one service calls an event successful while another records the same outcome as a partial failure, the ratio becomes difficult to trust. Teams should define event semantics, keep the query under version control, and record changes to the SLO definition so historical comparisons remain explainable.
Synthetic checks catch black holes
Application metrics can look healthy when a complete user journey is broken between services. A synthetic check can execute the actual flow, verify the response, and expose failures that a backend-only SLI misses. Uptime platforms can also test HTTPS, TCP, ICMP, or DNS paths from multiple regions, with confirmation logic that helps distinguish an isolated probe failure from a broader incident.
Fivenines offers infrastructure metrics, website uptime checks, cron monitoring, alert routing, and workflow automation in one monitoring platform. It can sit alongside application observability systems when a team needs external journey checks and infrastructure context in the same operational practice.
Teams evaluating broader observability arrangements can compare those needs with a unified observability platform. For organizations that also need cloud operations support, an overview of Azure support for East Midlands businesses provides a separate example of how monitoring and managed assistance can fit into an operational model.
SLO tooling should support review, not replace it. Teams should inspect incident data, compare false positives with missed failures, revise journey definitions when the product changes, and review the target at a regular engineering and product meeting.
Common SLO Mistakes and How to Avoid Them
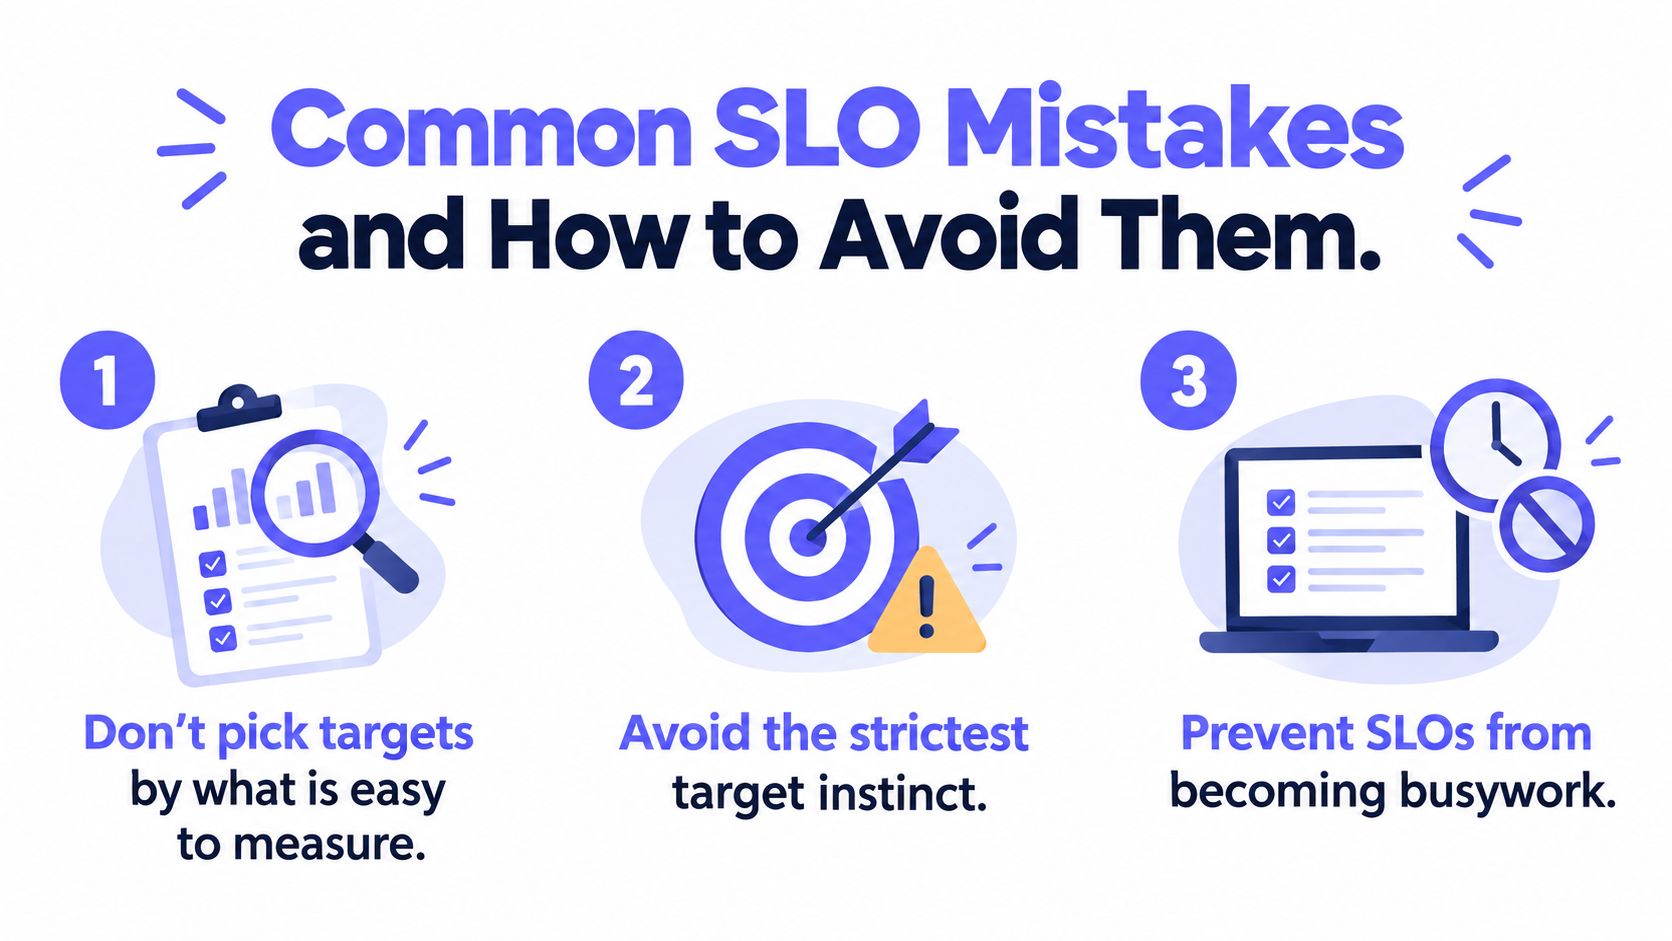
The strictest target isn't automatically the most useful target. A target only helps when the team can measure it accurately, connect it to user experience, and use it to make a decision.
Measuring convenience instead of experience
A team may choose CPU, memory, or host uptime because those metrics already exist. Those signals help diagnose causes, but they don't prove that a customer completed a journey.
Diagnostic question: Would the SLI fail when a real customer cannot complete the intended action? If not, the team should move the primary measurement closer to the user.
Chasing an impressive number
An extremely tight target can exceed what the architecture, deployment process, and recovery design can support. If the team misses it constantly, engineers learn to dismiss the SLO rather than use it.
Diagnostic question: Can the service owner explain the user and business reason for the target, and can the current system defend it? If neither answer is clear, the target needs calibration.
Treating the SLO as a static label
A product can change its traffic patterns, dependencies, workflows, and customer expectations. An SLO that once represented the journey may later measure only a small implementation detail.
Diagnostic question: Which recent incident changed the team's understanding of user impact, and did the SLO definition change afterward?
Alerting on the final breach
A final SLO breach is a late signal. It tells the team that the target has already been missed, rather than showing that the budget is being consumed at an unsafe rate.
Diagnostic question: Does each alert correspond to a response time and owner, or does every breach create the same noisy page?
Spending the budget without learning
An error budget isn't permission to repeat the same failure. It supports controlled delivery risk, but repeated consumption should fund reliability improvements, better tests, safer rollbacks, or dependency work.
Diagnostic question: After a budget-consuming incident, did the team make a concrete change to reduce recurrence?
The final trap is drift. A service owner can maintain a technically correct SLI while the business shifts to a different critical journey. Quarterly review should ask whether the target still protects the action customers value.
A Practical SLO Rollout Checklist
A platform or SRE team can start with a small, defensible scope rather than attempting to measure every service. The first deliverable should be a short SLO document that product and engineering can both understand.
- List the journeys: Identify the most important customer actions and describe success in plain language.
- Select the indicators: Choose one request-driven SLI for each priority journey, then add supporting signals only when they improve diagnosis.
- State the window: Document the measurement period, event exclusions, target, and treatment of maintenance or planned work.
- Calculate the budget: Express the allowed unreliability in the unit that helps the team decide, such as bad events or downtime.
- Instrument the events: Add consistent fields for journey, outcome, duration, dependency, and request validity.
- Configure burn alerts: Use a fast policy for urgent consumption and a slower policy for gradual regression.
- Publish ownership: Name the service owner, incident owner, release decision-maker, and review participants.
- Schedule review: Compare SLO performance with incidents, releases, customer impact, and changes in the product journey.
The rollout can follow a staged path:
- Days 1 through 30: Map the priority journeys, instrument the events, and establish a baseline without pretending the first target is perfect.
- Days 31 through 60: Pilot the SLO on one service, tune the queries, test alert routing, and agree on what happens when the budget is under pressure.
- Days 61 through 90: Extend the approach to related services, retire dashboards that don't support decisions, and report reliability outcomes in language leadership can use.
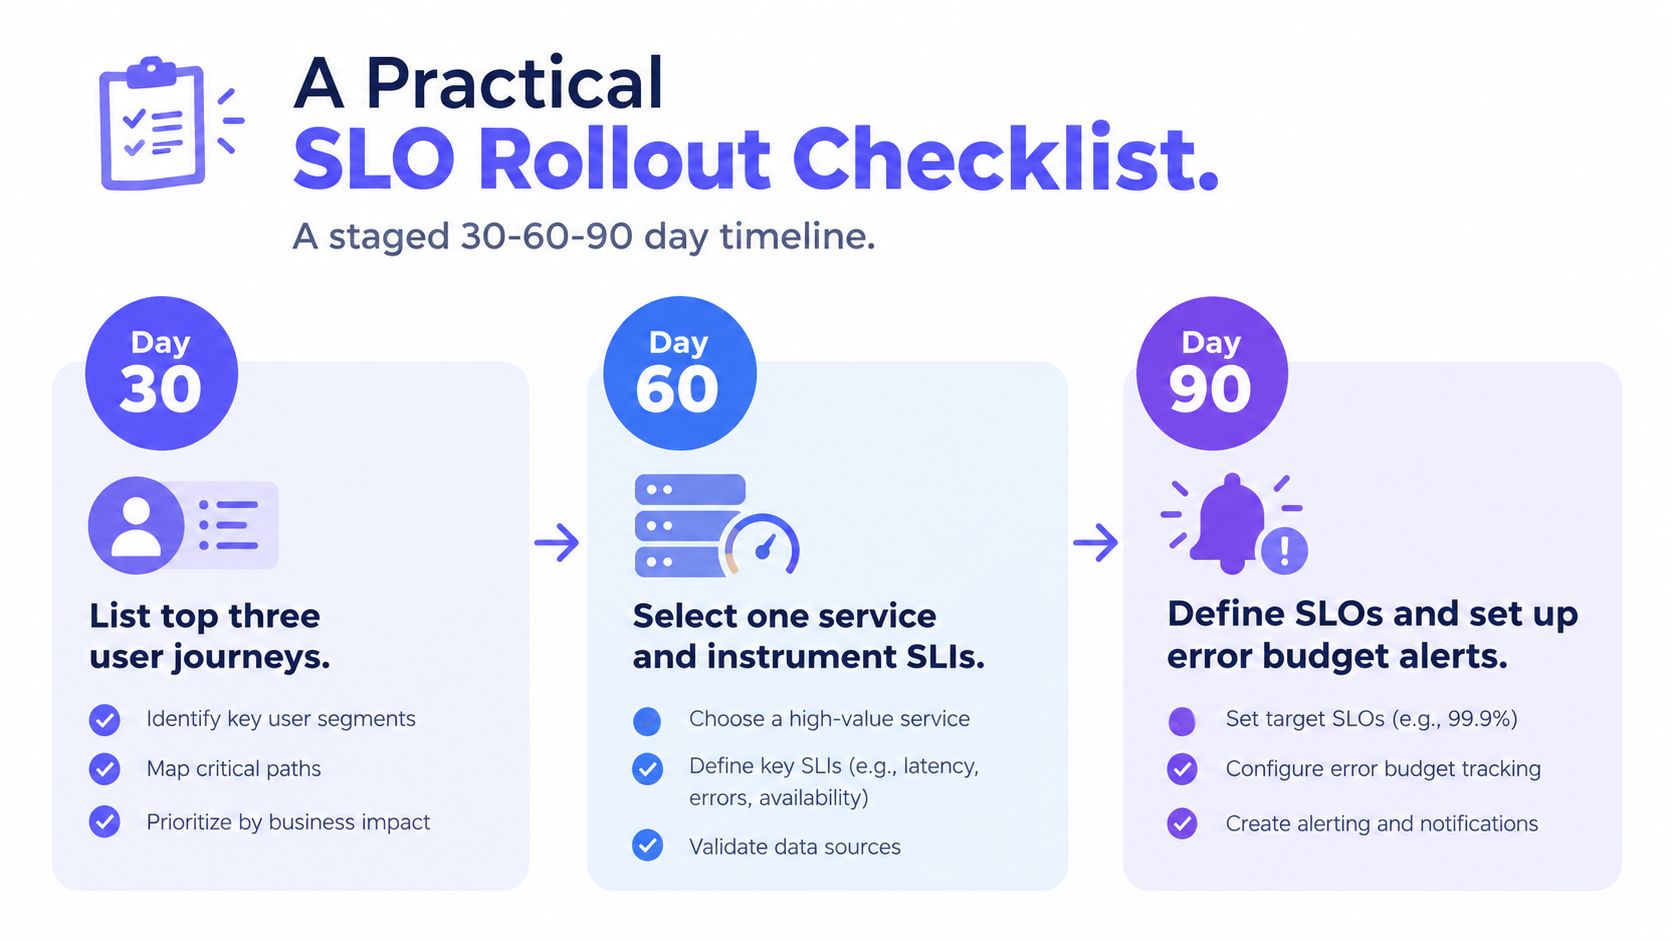
The strongest rollout ends with a standing review. Teams should ask whether the SLO changed a release decision, whether an alert led to useful action, and whether the measured journey still represents customer value. If the answer remains yes, the service level objective has become part of engineering practice rather than another dashboard label.
Fivenines brings infrastructure metrics, uptime checks, cron monitoring, alert routing, and workflow automation into one operational dashboard that can support the monitoring side of an SLO program. Teams can visit Fivenines to review the platform and decide whether its checks and integrations fit their journey-based reliability workflow.