Disk Queue Length: How to Interpret and Resolve Saturation

Disk queue length is the number of I/O operations outstanding simultaneously, so it measures device-level I/O parallelism rather than performance by itself. A queue length of 1 means roughly one outstanding request on average, while sustained queue growth alongside rising await is the stronger signal that storage is becoming saturated.
A production service can slow down while CPU and memory remain well below their usual operating ranges. Database queries take longer, containers appear stuck, and web requests pile up, yet the host looks healthy until storage telemetry is viewed at the device level. The misleading part is that a busy queue isn't automatically a broken queue. It may represent useful parallelism, or it may represent work waiting behind a device that can't keep up.
Table of Contents
- The Hidden Storage Bottleneck in Your Production Environment
- Reading Disk Queue Length in Linux
- Why Queue Length Matters More Than You Think
- HDD, SSD, and NVMe, Different Queues, Different Rules
- Troubleshooting Disk Queue Saturation Step by Step
- Monitoring Disk Queue Length with Fivenines
- Your Disk Queue Length Action Plan
The Hidden Storage Bottleneck in Your Production Environment
A common incident starts with an application timeout. The on-call engineer checks CPU, memory, and network utilization, finds no obvious limit, and then notices that several services share the same volume. Database reads, container logs, temporary files, and backup activity are all competing for the same storage path. The application doesn't report “disk saturation.” It just becomes slow.
Disk queue length provides a useful diagnostic lens because it describes I/O work that has entered the storage path but hasn't completed. It isn't a count of files, processes, or applications using a disk. Linux performance guidance defines it as the number of requests waiting for, or currently receiving, service from a storage device, with a queue length of 1 representing roughly one outstanding request on average in this Linux disk queue explanation.

A larger value means more concurrent work, but it doesn't establish whether the device is healthy or overloaded. An NVMe device may deliberately sustain many in-flight requests to expose its parallel queues, while a spinning disk can struggle when requests begin to accumulate. The same value therefore means different things on different media and under different workloads.
Why application symptoms are easy to misread
Queue pressure often appears above the disk layer. A database reports read latency, a container runtime waits on filesystem operations, or a web server holds connections while synchronous writes complete. Meanwhile, the storage device may show moderate utilization because the workload is bursty or because the wait occurs in a virtual, mapped, or shared layer above the physical device.
That layered ambiguity is why storage metrics belong in an infrastructure roadmap, not only in an incident dashboard. Teams reviewing capacity, resilience, and operational risk can use this secure and compliant IT roadmap as broader planning context, then validate storage behavior against each workload's actual latency requirements.
Reading Disk Queue Length in Linux
A production alert shows a rising queue on a busy host. Before treating it as saturation, check whether latency rose with it and whether the row belongs to the physical device or a logical layer. Queue length measures concurrent work, not device health. The same value can be normal for an NVMe workload and troublesome for a spinning disk.
Linux exposes block-device counters through /proc/diskstats. Most operators read them with iostat, which calculates extended metrics over a sampling interval. Start with:
iostat -x 1
The interval produces fresh samples instead of displaying only cumulative totals. Run the command during the incident, or during a representative baseline window, then compare device rows with application symptoms from the same interval.
Look for aqu-sz, or avgqu-sz on older iostat versions. Both report the average number of requests in progress for the device during the measurement interval. This is an average concurrency value, not a process count or a guaranteed snapshot of requests present when the row appears.
Read await beside it. Linux exposes read and write latency in fields such as r_await and w_await. These values include time spent waiting in the kernel queue and time spent being serviced by the device, as described in this storage workload material. A rising queue with stable latency can indicate useful parallelism. A rising queue with rising read or write wait points more strongly to contention, although no generic threshold applies across every device and workload.
A practical reading sequence
- Identify the device. Check the device name, mount relationship, RAID or device-mapper layer, and virtualization context. A logical-volume queue may differ from the queue at the physical device.
- Correlate the metrics. Compare
aqu-sz,r_await,w_await, throughput, IOPS, and utilization over one common window. Do not compare a brief spike with a long average. - Check workload direction. Separate read-heavy and write-heavy behavior. Synchronous writes, bursts, and shared storage can produce application delays without a high physical-device queue.
- Separate queue length from queue depth. Queue length usually describes measured outstanding work. Queue depth can describe a configured concurrency limit in a benchmark or device path.
For collection methods and correlated alerting, use this Linux disk monitoring guide.
Why Queue Length Matters More Than You Think
A production database can slow down while disk utilization looks ordinary. A burst of synchronous writes may leave requests waiting above the device, pushing p95 or p99 latency higher before a familiar queue threshold appears. Queue length is therefore a concurrency signal, not a health score.
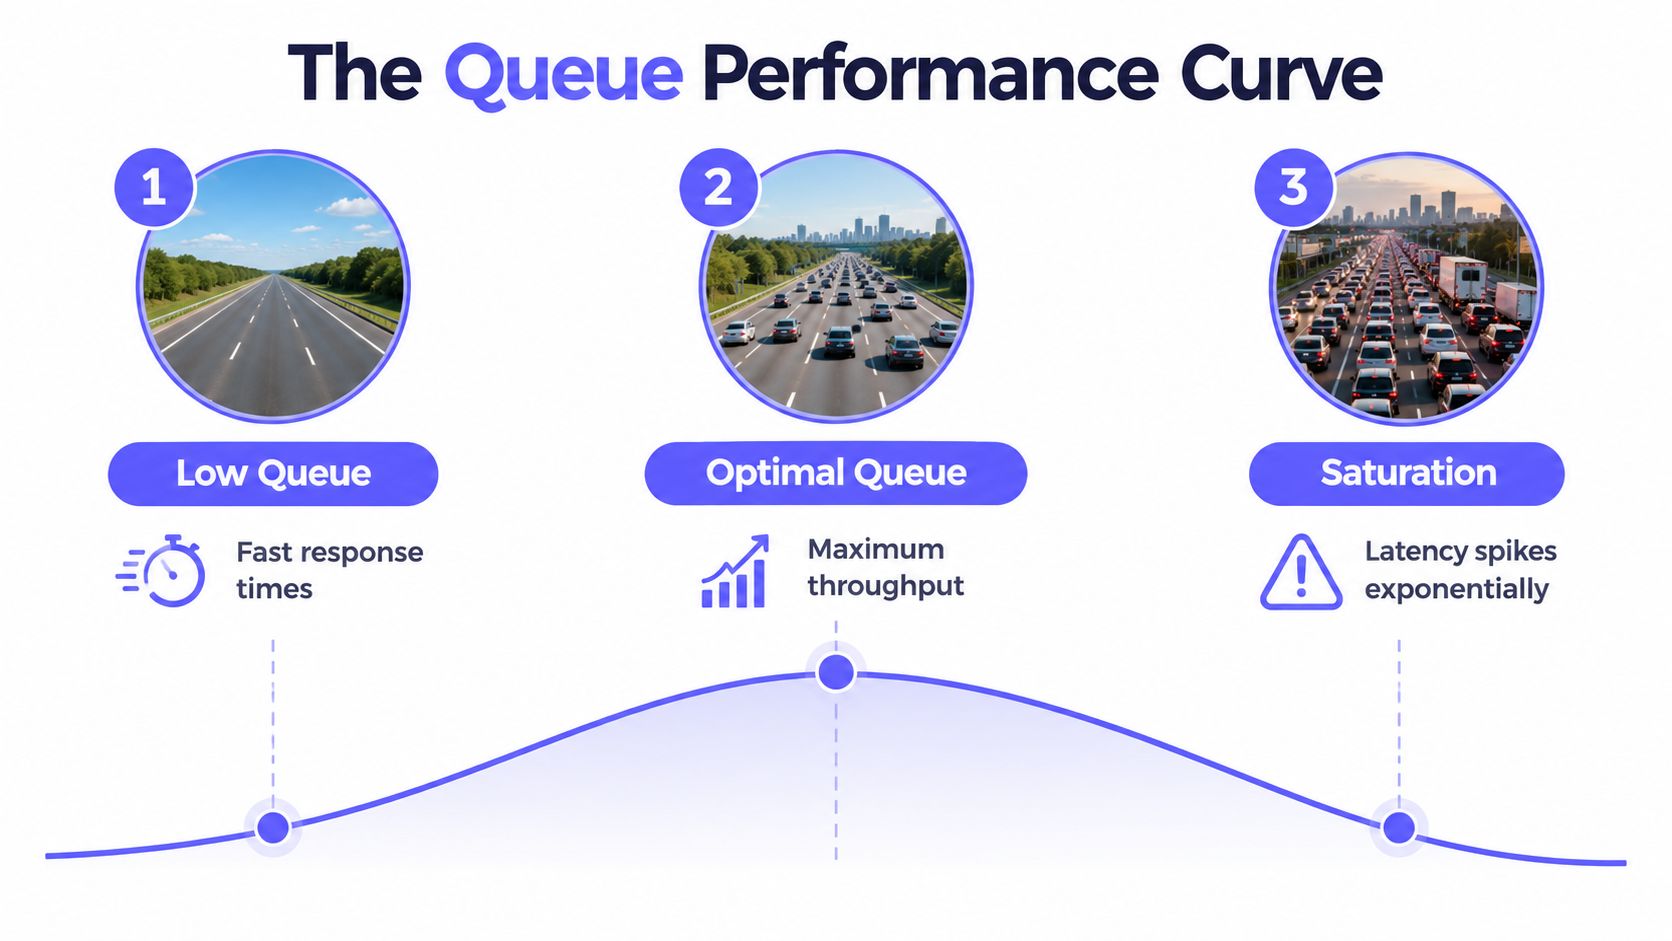
Storage can process several requests at once, but useful parallelism has limits. More outstanding work may improve utilization and throughput while internal resources are underused. After the device reaches its effective service capacity, additional requests mostly wait. The limit depends on the device architecture, queueing path, request size, read/write mix, and whether other workloads share the device.
Total I/O time consists of queueing time plus service time. Service time includes the work required to complete the operation, while queueing time reflects delay before that work begins or proceeds according to this storage performance material. This distinction matters in layered storage. An application can experience delay in a filesystem, virtual machine, controller, or host queue even when the physical device is not reporting extreme utilization.
Average latency can conceal the operational impact. A small group of slow requests may determine whether a user sees a fast page, a slow query, or a timeout, even while the average remains acceptable. p95 and p99 latency expose that tail and often reveal saturation earlier than a queue alert based on a fixed number.
The useful part of concurrency
A shallow queue is not automatically healthy. An SSD or NVMe device receiving too little parallel work may leave internal resources idle and deliver less throughput than its workload permits. Raising concurrency can help until throughput stops improving or latency begins to rise. At that point, queue growth represents waiting, not productive work.
Evaluate the queue with related signals:
- Queue size, showing outstanding work over the same interval.
awaitor service latency, showing request completion time.- IOPS and throughput, showing whether added concurrency produces useful output.
- Tail latency, showing whether a subset of requests is already suffering.
- CPU wait and application symptoms, showing where users and services feel the delay.
A rising queue becomes an operational concern when it coincides with worsening latency, stalled throughput, or application symptoms. A baseline built from normal workload periods gives alerting a meaningful reference. A performance baseline for infrastructure monitoring helps record productive concurrency and correlated latency before the incident occurs.
HDD, SSD, and NVMe, Different Queues, Different Rules
Queue length measures outstanding work, not device health. The same concurrency can overload a spinning disk, keep a SATA SSD productive, or remain routine for an NVMe namespace. Interpret it with await, throughput, request pattern, and the storage layer that reports the metric.
On a 7,200 RPM disk, sustained aqu-sz above 1 combined with await climbing past the single-digit millisecond range is a dependable early warning. Treat it as an observation from that device and workload, not a fleet-wide limit. Seek movement and rotational delay give HDDs limited service capacity, so queue growth often appears alongside rising latency.
SATA SSDs remove mechanical delay but still have controller, interface, firmware, and workload limits. A queue that remains harmless on one model can produce latency trouble on another. Write-heavy traffic, garbage collection, thermal behavior, and shared host activity can all change the point at which extra concurrency becomes waiting.
NVMe makes fixed thresholds even less useful. Its parallel queues can support substantial in-flight work while throughput improves and latency remains within the workload objective. Once the device or its downstream path is saturated, more outstanding requests add delay rather than useful output. The queue becomes a symptom of contention, not a diagnosis by itself.
Benchmark evidence needs context
An IBM storage benchmark illustrates why architecture changes the interpretation. Direct-attached storage degraded by roughly a factor of three under load and exposed a maximum queue length of three, while an Enterprise Storage Server reached a queue length of 32 and scaled better with load in the IBM storage benchmark report. The larger queue was not automatically worse. The systems could use concurrency differently.
Compare like with like: device type, request size, read/write mix, access pattern, and measurement layer. A local HDD, a virtual disk backed by a shared array, and an NVMe namespace should not inherit one alert threshold.
Capacity tests should pair queue behavior with transfer rates and latency. Throughput measurement guidance can help structure those tests. The practical question is whether additional concurrency still produces acceptable work for this device and workload. Alert on correlated deterioration, such as queue growth with rising await or stalled throughput, rather than queue length alone.
Troubleshooting Disk Queue Saturation Step by Step
A production database can slow during a backup even when the queue spike looks modest. A larger queue on a fast NVMe device may cause no user-visible problem, while a smaller, persistent queue on a busy virtual disk can push application latency beyond its objective. Queue length measures outstanding work, not storage health.
Using the earlier reading sequence, confirm the device-level picture first. The steps below focus on what to do after saturation is plausible.
Start at the device layer
Identify the affected block device and trace it through the stack. Check the filesystem, LVM or device mapper, RAID layer, virtual disk, hypervisor, and cloud volume where applicable. Host-level aggregates often hide one overloaded volume among otherwise quiet devices.
Then verify which service is generating the pressure. Separate database traffic, logging, backups, virtual-machine storage, and batch jobs when possible. Random reads, sequential writes, and mixed workloads place different demands on the same device, so an identical queue value can represent very different conditions.
Distinguish a burst from a condition
Align storage observations with application behavior and the workload timeline. A backup-related burst that drains after the competing job finishes needs a different response from a queue that repeatedly grows during normal traffic. Watch whether completed work catches up, whether latency keeps rising, and whether throughput stops improving despite more outstanding requests.
Short pressure may be acceptable if the service-level objective remains intact. Sustained pressure requires finding the source and the constrained layer.
Find the useful concurrency limit
Test with a representative workload rather than applying a universal queue threshold. Sweep outstanding requests across the relevant read/write mix and access pattern. Increase concurrency until throughput or IOPS stops gaining materially, then record the point where p95 and p99 latency no longer meet the service-level objective.
That point is the device and workload's practical knee. Repeat the test after meaningful changes to volume type, virtualization, RAID, or application behavior.
Remediation depends on the bottleneck. Reduce unnecessary I/O, separate competing workloads, reschedule backups, increase device or volume capacity, change the storage architecture, or limit application concurrency. Raising a queue limit alone usually permits more waiting without increasing useful work. Use Fivenines to alert on correlated queue growth, latency deterioration, and stalled throughput rather than queue length in isolation.
Monitoring Disk Queue Length with Fivenines
A useful monitoring design treats disk queue length as one signal in a correlated view. The dashboard should show queue growth beside read and write latency, IOPS, throughput, utilization, CPU wait, and application response indicators. This prevents an efficient NVMe workload from triggering the same alert as a genuinely stalled disk.
Fivenines supports that model through an open-source Linux agent that pushes telemetry over HTTPS, avoiding inbound ports and remote command paths. Teams can build custom dashboards around specific devices and workloads rather than relying on one fleet-wide queue threshold.

Build alerts around sustained pressure
An alert should require a meaningful relationship between signals. For example, queue growth can be evaluated alongside rising await, worsening p95 or p99 latency, and a plateau in IOPS or throughput. A short queue spike without those effects should usually remain visible for investigation rather than page an engineer immediately.
The monitoring approach should also preserve context:
- Device identity: Keep physical, virtual, mapped, and cloud-backed devices distinguishable.
- Workload baseline: Compare databases, logging, backups, and virtual-machine storage against their own normal behavior.
- Tail latency: Include p95 and p99 so average latency doesn't mask users waiting at the edge.
- Incident duration: Distinguish a brief burst from sustained queue growth.
- Ownership and routing: Send storage alerts to the team that can change the workload, host, volume, or backend.
This correlation model is especially important for NVMe. Increasing outstanding work can raise throughput while the device has spare capacity, but after saturation it primarily increases waiting and latency as discussed in this research on queue-depth interpretation.
Operational response also needs more than a chart. Fivenines provides workflow automation for routing, delays, retries, and escalations, while its broader monitoring features can keep infrastructure and service symptoms in the same operational view. A related example is disk space monitoring guidance, which shows why capacity signals are more useful when connected to the service context.
Your Disk Queue Length Action Plan
The practical mental model is simple: queue length measures concurrency, not health. A high value may indicate productive parallelism, harmful contention, or a queue forming at a different layer from the one being monitored. The answer depends on the device architecture, workload pattern, latency objective, and measurement interval.
A team reviewing its current monitoring can use this checklist:
- Define the metric: Confirm whether the system reports average in-flight requests, pending work, hardware queue capacity, or another queue concept.
- Name the layer: Record whether the value comes from the application, filesystem, kernel block layer, hypervisor, virtual device, or physical storage.
- Pair the signals: Put queue size beside
await, service latency, IOPS, throughput, utilization, CPU wait, and tail latency. - Classify the media: Keep HDD, SATA SSD, NVMe, RAID, cloud volume, and shared-array baselines separate.
- Group the workload: Establish different expectations for databases, logs, backups, and virtual machines.
- Review duration: Treat sustained or growing pressure differently from a short burst.
- Test the knee: Sweep representative queue depths and stop increasing concurrency when useful throughput levels off while tail latency breaches the service objective.
A fixed queue threshold is easy to configure, but it often produces both false positives and false negatives.
A better alert says that a particular device has sustained queue growth, rising read or write wait, and deteriorating application latency relative to its own baseline. That policy catches harmful saturation without penalizing storage that is using parallelism as designed.
The final operational question should be, “Where is the wait occurring?” A low queue at one layer doesn't prove that an upper or lower layer is uncongested. Correlated visibility gives engineers enough context to reduce workload demand, isolate competing traffic, tune concurrency, or expand the storage path before users experience a broader outage.
Fivenines brings Linux disk telemetry, custom dashboards, workload-relative alerts, and workflow automation into one infrastructure monitoring platform. Use it to correlate disk queue growth with latency and application symptoms, then visit Fivenines to start building a more reliable storage saturation workflow.