Server Monitoring Checklist: 8 Go-Live Acceptance Gates

A new Linux VPS goes live on a Tuesday. The agent installs, the CPU and memory charts fill in within minutes, the site loads, and the onboarding ticket gets closed as monitoring done. Two days later the nightly backup stops running. Nobody notices until someone needs a restore. When the dashboard is finally opened, the host has been quiet for 40 hours and the backup status says nothing at all.
That isn't a tooling failure. The graphs worked exactly as designed. What was missing was an acceptance decision: a record showing which signals were checked, who owns each one, what evidence proved it, and whether the result was pass or fail.
This server monitoring checklist is that record. It runs eight gates, and every gate carries an owner, the evidence that proves it, a pass or fail call, and a follow-up line with a due date. For the fundamentals behind the metrics themselves, start with the Linux server monitoring guide and the system health monitoring guide. Then use the gates below to decide whether one server is ready for production.
Table of Contents
- 1. Collection freshness and agent presence
- 2. CPU, memory, and disk-capacity acceptance
- 3. Service and application-dependency checks
- 4. Scheduled-job completion checks
- 5. External availability and endpoint verification
- 6. Notification receipt and safe alert validation
- 7. Recovery validation and failback
- 8. Ownership, acceptance evidence, and go-live decision
- What each go-live gate proves and where it fails
- Turn the Checklist Into a Go-Live Decision
1. Collection freshness and agent presence
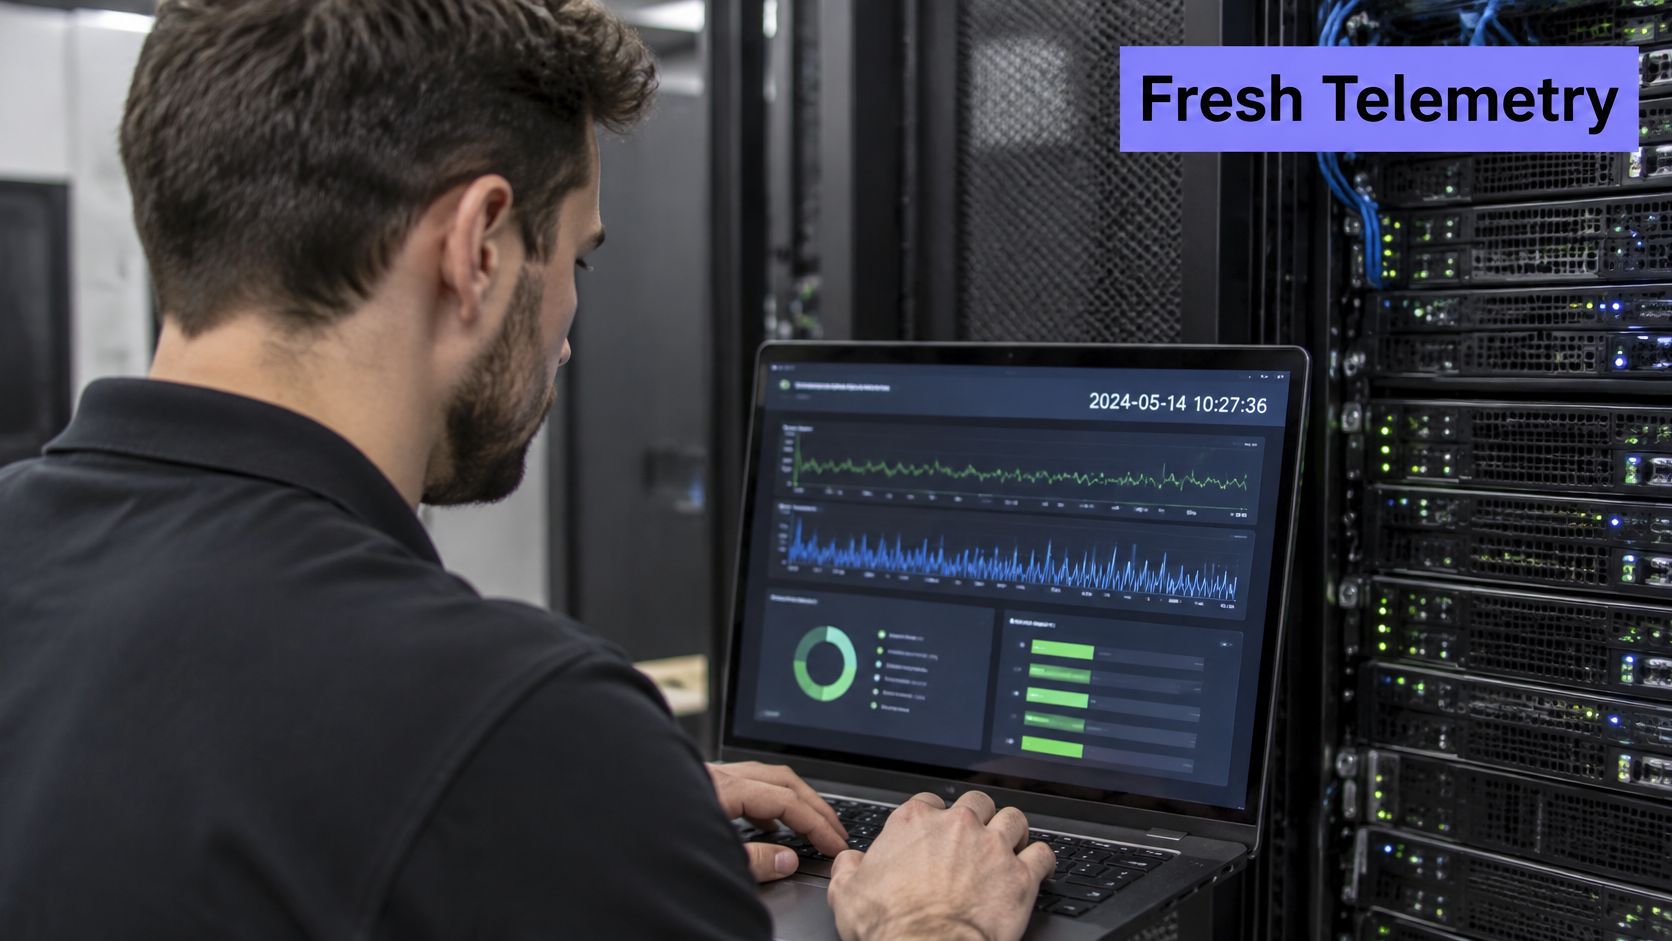
Freshness is the first gate because every gate after it depends on it. A host that appears in the inventory but hasn't reported since yesterday still draws a chart, and that chart looks calm. Check the timestamp of the latest successful collection, not the presence of the host in a list.
What a freshness gate actually proves
Freshness separates a monitored server from an enrolled one. The open-source agent sends telemetry over outbound HTTPS, so a host behind an egress rule that blocks 443 installs cleanly and then never reports. That failure mode looks like a quiet, healthy server.
Illustrative example: an operator expects a new Linux or Windows host to report inside a defined internal interval, records the latest timestamp on the acceptance sheet, and fails the row when no current reading is available.
- Confirm outbound HTTPS before install. Test the path from the host itself, not from an admin laptop on a different network segment.
- Follow the documented install path for the operating system. Don't assume a universal package or command sequence carries across distributions and Windows versions.
- Wait one normal collection cycle, then read a real metric. Not a "connected" badge, an actual CPU or memory value with a timestamp.
- Record the numbers. Expected interval, observed timestamp, operator name, result. A single delayed update is worth investigating before it becomes a persistent failure.
Missing data is not a healthy host. Verify the latest collection before you trust any percentage built from it.
Telemetry portability belongs in this gate, not in a later architecture review. Grafana's 2024 Observability Survey found 89% of respondents investing in Prometheus and 85% in OpenTelemetry, with nearly 40% using both (Grafana Observability Survey 2024). At acceptance, confirm the agent exposes metrics you can query and keeps stable labels for host, service, environment and cluster. Unbounded labels such as container IDs or request IDs inflate storage and query costs.
Pass when the newest successful collection sits inside the agreed interval and the reading matches the host's role. Fail when the gap is longer, and note whether one delayed update or a repeating pattern caused it.
2. CPU, memory, and disk-capacity acceptance
Resource rows fail acceptance in two directions: missing entirely, or present with a threshold nobody can defend. Both are cheap to catch on day one and expensive to discover during an incident.
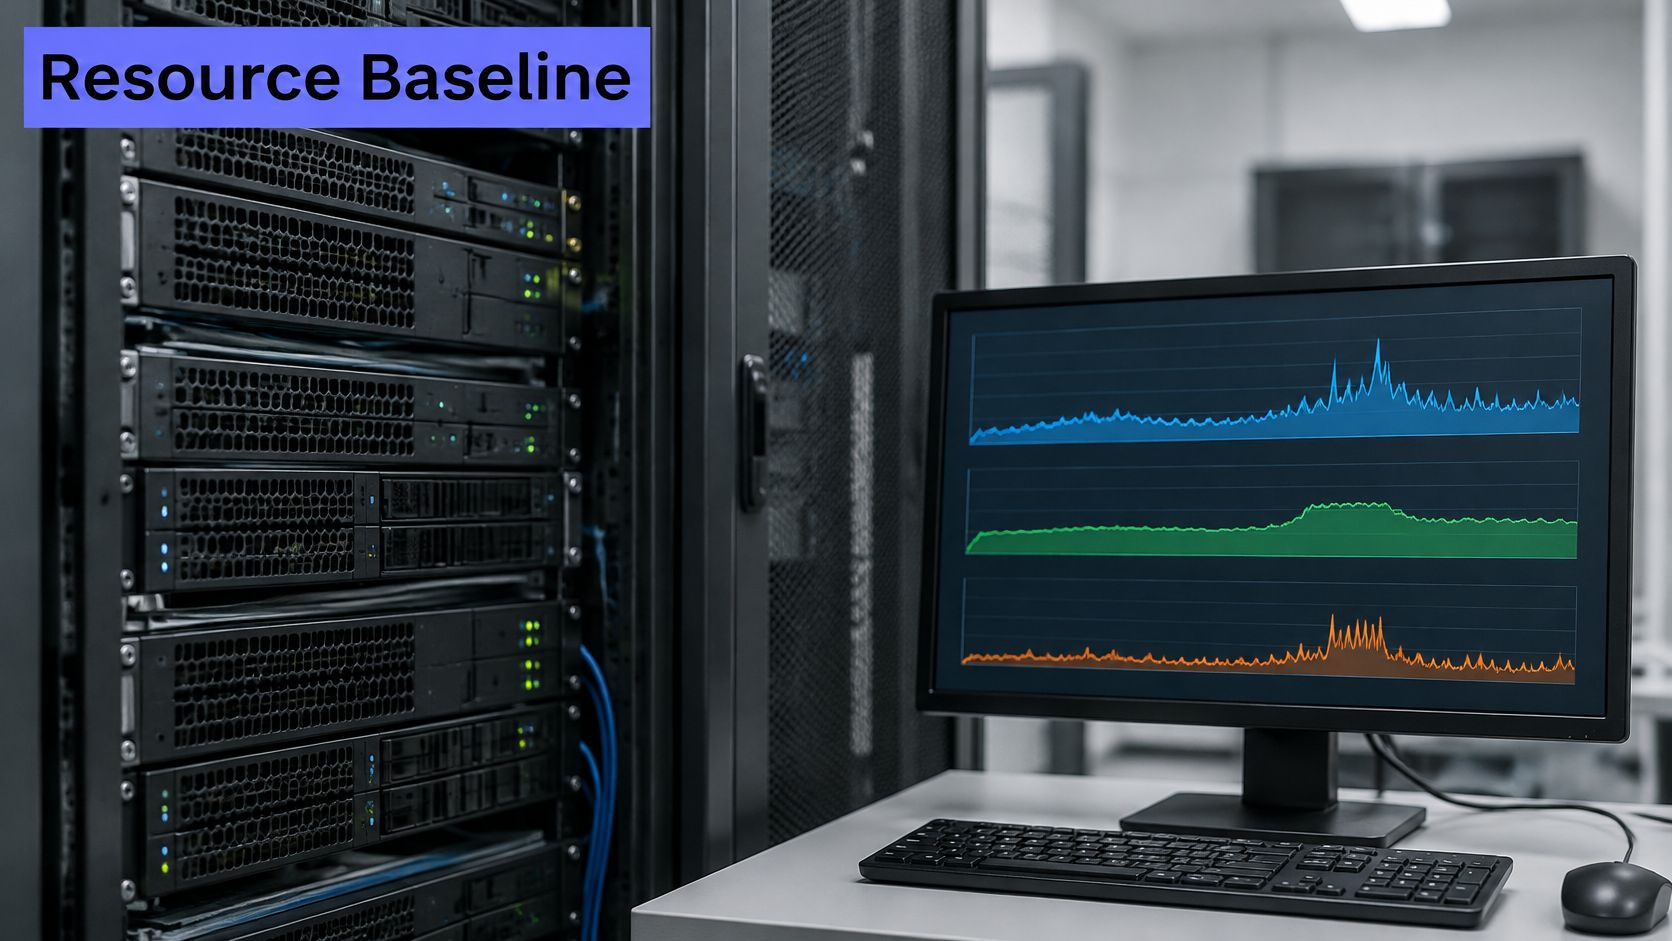
Anchor the gate in a framework rather than a favorites list. Google's Site Reliability Engineering guidance, published in the SRE book in 2016, groups service health into latency, traffic, errors and saturation, and defines saturation as how full a constrained resource is, including CPU, memory, storage, I/O, connection pools and queues (Google SRE book). That guidance also warns systems degrade before reaching 100% utilization, which is why trend thresholds and capacity forecasts carry more weight than a single peak number.
Set thresholds per role, not per percentage
- Ask the service owner for operating history. A database host, an application node and a build server have different normal profiles.
- Write the window and the recovery condition. A signal must stay outside the threshold for the agreed period before it alerts, and must clear after recovery.
- Name the filesystem for disk. Free space means nothing without a mount point and an action. The disk space monitoring guide covers inode exhaustion and growth-rate checks that belong in this row.
- Separate missing data from low usage. A gap is a collection failure, not a healthy reading of zero.
Illustrative example: during a one-hour pilot, the operator records sustained CPU, memory and disk readings, compares them against the host's normal workload, and writes each threshold as role-specific with a stated reason.
Acceptance rule: a threshold with no window, no owner and no recovery condition is decoration. Fail the row until all three exist.
Pass when each required metric is current, plausible for the role, and attached to a documented threshold. Fail when a metric is absent, or when the only threshold on the sheet is a generic percentage copied from another host.
3. Service and application-dependency checks
Service rows are where checklists usually go vague. "Monitor nginx" is not a check. Decide what the check proves, who responds when it fails, and which evidence gets retained.
CISA recommends deciding how each event type will be captured, enabling logging on servers, firewalls and monitoring software, and creating automatic alerting and response rules where possible. Where automation isn't available, its guidance assigns a schedule for manual log review and a documented event knowledge base for triage (CISA incident management guide). Centralized collection is a separate control: CISA recommends remote server logging with retention through a SIEM or equivalent, and names journald output and the contents of /var/log as valuable sources (CISA advisory on centralized logging). Verify collection and retention, not just a running local agent.
Separate the three failure boundaries
- Host availability tells you the machine is up. Nothing more.
- Local service state tells you the process or unit is running on that host.
- External endpoint tells you a consumer can reach the service.
Keep the evidence for each one apart, or a failed check won't reveal which boundary broke. On Linux, journald summaries cover selected units only, giving error context for the units you enrolled. That's incident context, not full log ingestion, and it isn't a searchable log archive.
Illustrative example: a web tier passes when its externally tested endpoint responds and the local service state is recorded, with the owner stating whether an upstream failure is a server incident or an application escalation.
A successful host check is not proof that a dependency is healthy. Name the dependency or leave the row blank.
Pass when every production service has an owner, a check method and an expected response written down. Fail when the row lists a service with no named responder, or when the evidence is only "the process is running."
4. Scheduled-job completion checks
Backup and batch failures are the quietest incidents on any server. A job that never ran produces no error at all unless something expects it to appear.
Incident load is steady enough that missed jobs rarely surface on their own. In a 2025 SRE survey of 301 respondents distributed globally, 40% handled one to five incidents in the previous 30 days and another 23% handled six to ten (the 2025 SRE Report). Every one of those incidents consumed attention that a silent job failure never earns.
Record the job, not the green tick
- Identity and schedule. Command or workflow name, expected cadence, time zone, expected duration.
- Owner and escalation. Which missed run becomes an incident, and who gets called outside business hours.
- Missed execution detection. Alert on absence, not only on explicit failure. A job that never starts never fails.
- Freshness objectives. How recent the last successful artifact must be before the row turns red.
- Destination checks. Retention, storage capacity, and reachability of the backup target.
Separate "job succeeded" from "service is protected." A successful run can still be unusable because credentials expired, the storage pool filled, encryption keys rotated, or restore permissions changed. Scheduled-job monitoring for cron-style work can detect missed and failed runs and belongs in this gate, but it isn't a general scheduler, job runner or business-log archive. The cron job monitoring guide covers expression syntax and schedule validation before enrollment.
Illustrative example: an operator enrolls a recurring backup-related job, confirms the expected schedule is recognised, and validates the check through an existing observed result rather than interrupting a production run.
Safe validation: never stop a real job to create an alert. Use an existing execution, a scheduled window, or a non-destructive test job.
Pass when the last successful run is inside the freshness objective and a missed run would raise an alert. Fail when the only evidence is a task-scheduler status column, or when an unsupported job is assumed to be covered.
5. External availability and endpoint verification
Everything so far is measured from inside the host. A server can report perfect metrics while the network path in front of it is broken.
An external check answers exactly one question: can a consumer reach this endpoint from outside the monitored machine? A hosted platform running HTTPS, TCP, ICMP and DNS checks from four probe regions gives you that answer as reachability and response-time signals. It does not demonstrate application correctness, transaction success or user experience.
Match the protocol to the service contract
- HTTPS for an endpoint that must serve a valid certificate and a specific status code.
- TCP for an exposed port where the banner or protocol payload doesn't matter.
- ICMP for basic host reachability where the service contract is simple.
- DNS for name resolution, especially after a migration or registrar change.
Define the expected response before you accept the row. An HTTPS check that passes on any status code proves almost nothing. If a content or status condition is part of the contract, write it down and test against it. For broader coverage of multi-step checks, the synthetic monitoring overview explains where browser-level scripts differ from single-endpoint probes.
Illustrative example: an HTTPS check succeeds from an external vantage point while a local service check confirms the server-side dependency, and the operator records both results side by side.
An external availability pass is not a claim about authentication, transactions or application logic. Keep the row's scope honest.
Pass when the external check runs from a network context that represents the intended consumer and records the expected condition. Fail when the check exists but nobody has written down what a passing response looks like.
6. Notification receipt and safe alert validation
An alert nobody received is indistinguishable from a system with nothing to report. This gate is the one most often skipped, and it's the cheapest to close.
Alert quality is an underserved gap rather than a stylistic preference. Grafana Labs' 2025 survey of 1,255 practitioners found alert fatigue was the leading obstacle to faster incident response, outweighing the next most common obstacle by almost 2:1 (Grafana Observability Survey 2025). Adding signals without adding discrimination makes that worse.
Run a controlled test, then roll it back
Prefer the platform's own alert-test mechanism over forcing CPU, disk or a service into a real failure state. If no non-destructive test path exists for the current plan, record that limitation and use a clearly labelled low-impact condition with owner approval.
- Record the test condition. What was triggered, on which host, and by whom.
- Record the trigger and receipt times. The gap between them is your notification latency.
- Read the message as a responder. Does it name the host, the service, the condition and the escalation path? A message containing only a metric name fails this row.
- Roll back and restore. Remove the temporary condition and confirm the previous workflow configuration is intact.
Available channels and workflow capabilities depend on the subscribed plan, so log the channel you tested rather than the ones that appear in a feature list. For configuration patterns, the real-time alerting guide covers routing and deduplication. Authentication events deserve a standing row of their own: CISA lists failed login attempts and privilege escalation among the events that warrant an alert path (CISA logging guidance).
Pass when a named recipient received a clear message and confirmed they knew what to do next. Fail when the test alert was routed to a shared inbox nobody had opened in a month.
7. Recovery validation and failback
A recovery test is useful only if it shows that the service and its monitoring signals returned to normal. Treat the exercise as an acceptance gate: record the procedure, evidence, decision and follow-up for this server.
Uptime Institute's annual outage analysis reported that 54% of respondents said their most recent significant, serious or severe outage cost more than $100,000, while 20% said the cost exceeded $1 million (Uptime Institute annual outage analysis). The report notes that incidents are not consistently disclosed, so these figures have limits. The operational point remains: a recovery process must confirm service health, not merely stop an alert.
Choose a low-impact exercise
Select a non-critical monitored service and an approved restart or failback procedure. Before starting, record the prerequisites, operator permissions, execution location, expected signal and safest reversal step. Assign an owner to run the exercise and capture its evidence.
- Capture detection timestamp. Record when the alert fired or the check failed.
- Capture acknowledgement timestamp. Record when a person took ownership.
- Capture recovery timestamp. Record when the service signal returned to normal.
- Verify a fresh reading. A recovered check paired with stale collection does not prove recovery.
If no safe exercise is possible, hold a tabletop review with the on-call owner and label the result as a tabletop. It is not a passed recovery test. Record whether the procedure was reviewed and what follow-up is required. The monitoring platform can alert and provide context; the runbook must define the fix, since monitoring does not restart services, patch hosts or provide remote access.
Recovery gate: Pass only when the alert resolves, the external check recovers and a new metric reading arrives with a fresh timestamp.
The acceptance record should show the observed timestamps and the final decision. Pass when all three timestamps are recorded and the signals clear without manual dashboard interpretation. Fail when recovery is inferred only because alerts stopped. Assign an owner and follow-up for every failure.
8. Ownership, acceptance evidence, and go-live decision
The final decision is administrative as much as technical. For one server, assign an owner to every row, attach the observation that proves the result, mark pass or fail, and give each failure a follow-up owner and a due date.
Measuring whether monitoring works means measuring operations, not agent installation. DORA's framework separates delivery metrics such as change lead time, deployment frequency, failed-deployment recovery time, change-fail rate and deployment rework rate from operational reliability, which should be assessed on its own terms (DORA metrics overview). In practice, every alert should be testable against an incident lifecycle: detection timestamp, acknowledgement time, mitigation or recovery timestamp, routing result and post-incident classification.
Two worked rows
- Resource capacity. Owner: server owner. Evidence: sustained CPU, memory and disk readings inside the agreed window with no collection gap. Decision: pass. Follow-up: confirm the disk alert owner before fleet rollout.
- Scheduled job. Owner: application owner. Evidence: the latest required run is missing or failed. Decision: fail. Follow-up: confirm job observability, assign remediation, set a due date.
Keep unknown, unsupported and passed as three distinct states. An unavailable capability, such as full log search, is a scope limitation and never a successful test. List the server's role, operating system, monitoring scope, agent version where it matters, collection interval and test conditions above the rows.
Before you expand
Run one host and one check first. Connect the appropriate Linux or Windows host, confirm useful readings become current, then safely test a single notification and record its receipt. Expand only when that record is complete, because a fleet of unverified agents reproduces the same gap at scale.
What each go-live gate proves and where it fails
| Item | Primary evidence | Accountable owner | Typical failure boundary |
|---|---|---|---|
| Collection freshness and agent presence | Latest successful collection timestamp and a current host metric | Monitoring or server operator | Service may be reachable while the agent is stopped, disconnected, or misconfigured |
| CPU, memory, and disk-capacity acceptance | Current, plausible readings evaluated against role-specific thresholds and observation windows | Server or service owner | Missing telemetry is not proof of healthy resource usage; host metrics may not explain application issues |
| Service and application-dependency checks | Service-specific check results and selected journald error context, where applicable | Owner of each monitored service or dependency | Host health does not prove application health; upstream failures may cause service-check failures |
| Scheduled-job completion checks | Job identity, expected schedule, and latest successful or failed outcome | Named business or operational job owner | Monitoring detects missed or failed work but does not repair or rerun jobs |
| External availability and endpoint verification | External HTTPS, TCP, ICMP, or DNS result and response time | Application or endpoint owner, with infrastructure escalation as needed | Reachability does not prove application workflows or business transactions work |
| Notification receipt and safe alert validation | Controlled test alert, correct host and condition, and recipient receipt evidence | Monitoring or on-call owner | A test message does not validate every severity or routing path; channels depend on the plan |
| Recovery validation and failback | Approved recovery exercise, restored monitoring signal, and detection and recovery timestamps | Service owner or recovery operator | Monitoring provides alerts and context but does not perform repair, restart, patching, or remote access |
| Ownership, acceptance evidence, and go-live decision | Completed owner, evidence, pass/fail, and follow-up records for each check | Go-live decision owner, with owners assigned per control | A passing pilot does not establish suitability for every workload or replace other operational controls |
Turn the Checklist Into a Go-Live Decision
Eight gates, one server, one page. Fill a row for each: owner, prerequisite, observed evidence, pass or fail, and a dated follow-up. The record is the deliverable, because six weeks later nobody remembers whether the notification path was tested or merely configured.
Mark any gate you could not test as blocked rather than passed. Blocked is a legitimate outcome and a useful one. It names the gap while there's still time to close it, instead of surfacing it during a restore.
Watch for two specific failure patterns. The first is a pass based on absence: no alert arrived, so the check must be fine. The second is a pass based on presence: the agent is installed, so the host is monitored. Both substitute a symptom for evidence. Verify the reading, the timestamp and the recipient directly.
A Linux host is the easiest place to start. Confirm the agent reports current readings through the Linux server monitoring feature page, then send one safe test notification and record who received it and when. That single completed record tells you more about production readiness than a dashboard with fifty panels.
For teams that want the whole picture in one place, Fivenines reports Linux and Windows host metrics through an open-source agent, alongside uptime checks, scheduled-job monitoring and alert workflows. The scope is deliberate: infrastructure visibility and actionable alerts, not full APM, patch management or a searchable log archive.
Fivenines brings the pieces of this acceptance record into one hosted platform: an open-source agent for Linux and Windows host metrics, external uptime checks, cron monitoring and alert workflows, with a 14-day trial that doesn't need a credit card. Connect one host, confirm its readings are current, and send a single safe test notification before you widen the scope. Visit Fivenines to start that one-host pilot.