How to Monitor DNS Server Answers, Delegation and Latency

The usual advice to ping a DNS server or check whether its DNS port responds is incomplete. To monitor DNS server behavior deliberately, operators need separate checks for response and timeout, expected answers, delegation, and server health, with independent alert windows and collection-failure rules. A reachable server can still serve the wrong address, publish an old zone, or fail validation.
Table of Contents
- Four Signals a DNS Server Monitor Must Keep Separate
- How to Run the dig Diagnostic Sequence in Order
- Schedule Probes from Several Vantage Points
- Expected Results and Alert Conditions for Each Check
- Triage a Failing Resolver from Server-Side Signals
- What a Simple DNS Probe Cannot Prove
- Start With One Resolver and One Zone
Four Signals a DNS Server Monitor Must Keep Separate
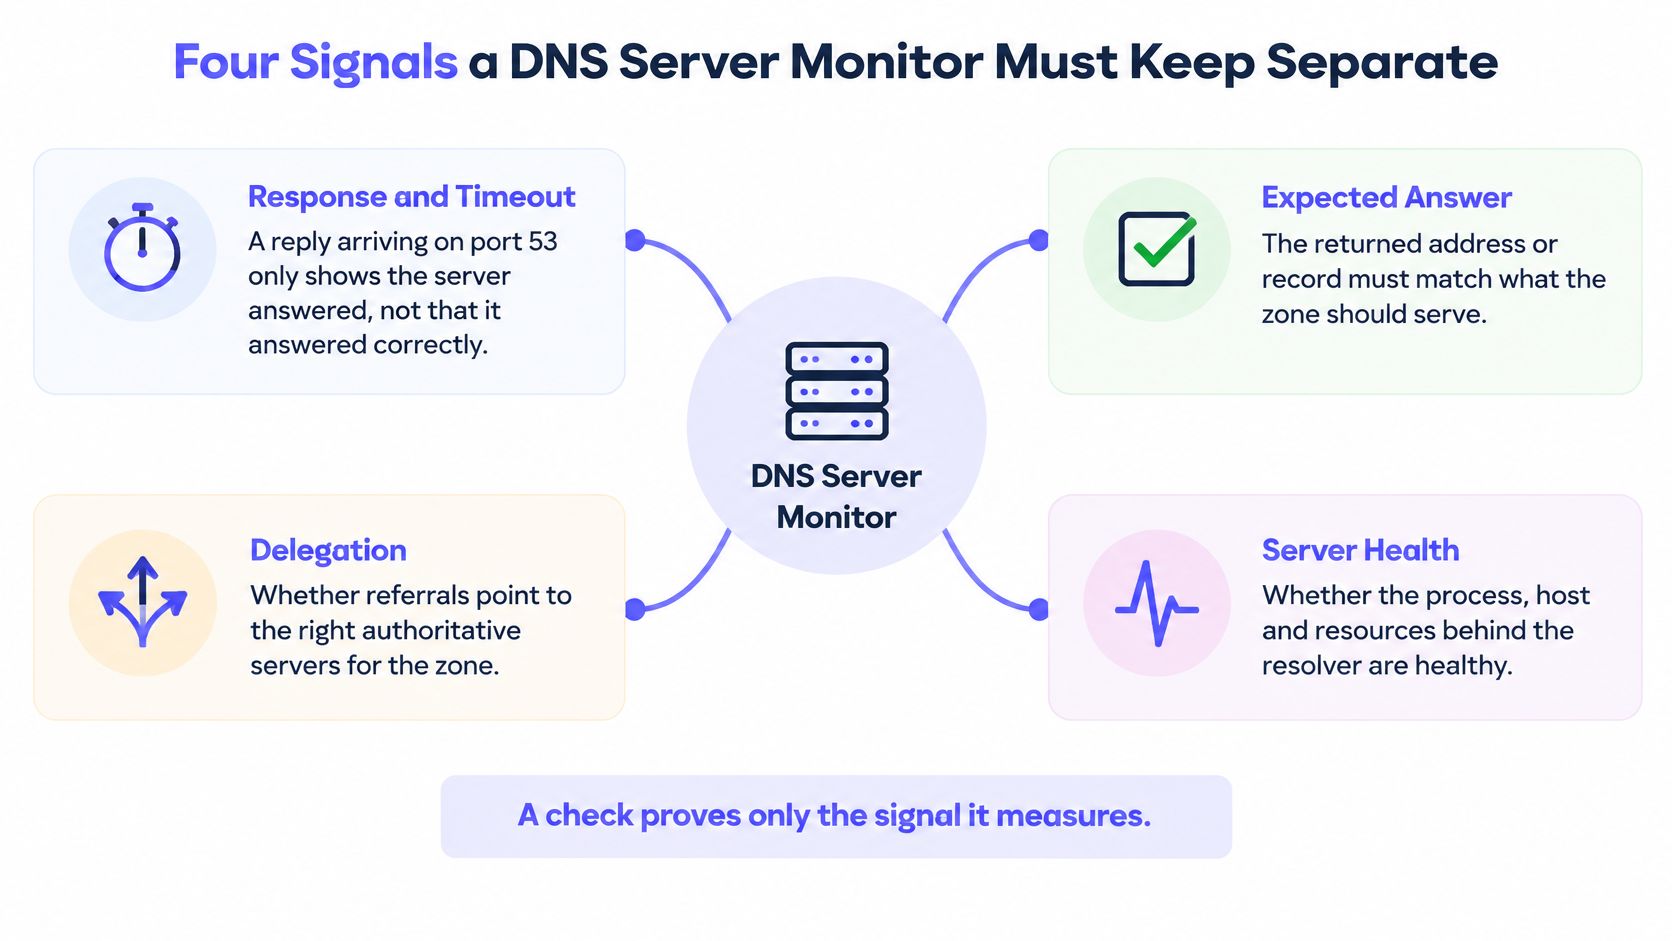
A DNS monitor shouldn't collapse every observation into a single green indicator. Each signal needs a defined question, an expected result, and enough context to identify which layer failed.
- Response and timeout: Did the selected server complete the DNS transaction within the probe's wait budget? Record elapsed time, transport, attempts, and final status, including failures that never produced a response.
- Expected answer: Did the reply contain the intended A, AAAA, CNAME, MX, NS, or SOA data? Compare normalized record sets against an approved expectation, not against whatever the previous query returned.
- Delegation: Does the parent direct queries to the intended nameservers, and do those servers answer authoritatively for the zone?
- Server health: Can the process and host sustain the workload? Collect query volume, response-code shares, resource pressure, and the distinction between local processing time and upstream waiting.
The conceptual boundary matters more than the dashboard layout.
Measure transactions, not listening sockets
The USENIX DNS measurement study collected request counts, response times, and unanswered-request rates in five-minute intervals. That measurement model remains useful: latency and loss can deteriorate while ordinary reachability still succeeds.
Measure the client-observed transaction from query issuance to response, rather than treating socket acceptance as successful resolution. Preserve latency distributions alongside failure shares so a fast successful subset doesn't conceal slow or unanswered queries.
The IETF nameserver operational framework also addresses query failures, unexpected responses, publication failures, DNSSEC problems, and traffic changes. Process uptime alone doesn't establish any of those outcomes.
Practical rule: A check proves only the signal it measures. No response-time measurement establishes answer correctness.
For record terminology and general checks, the existing DNS health-check guide provides the shared basics. Production server monitoring adds explicit expectations, independent perspectives, and a distinction between failed queries and failed monitoring.
How to Run the dig Diagnostic Sequence in Order
Run the read-only diagnostic sequence manually before scheduling it. Use dig from BIND 9 utilities, commonly packaged as dnsutils on Debian or Ubuntu and bind-utils on RHEL-family systems; macOS operators should confirm the installed build, and Windows operators need an available dig build.
Prerequisites and execution location
Record the installed version with dig's version option. Run from a host outside the nameserver, with permitted network access to the client resolver and authoritative servers; no administrative privileges or zone changes are required for these queries.
Use the production zone, a critical name, the actual client resolver, and each authoritative server as the inputs. The sequence below describes the query operations without embedding deployable commands or domain configurations.
This flow summarizes the execution order.
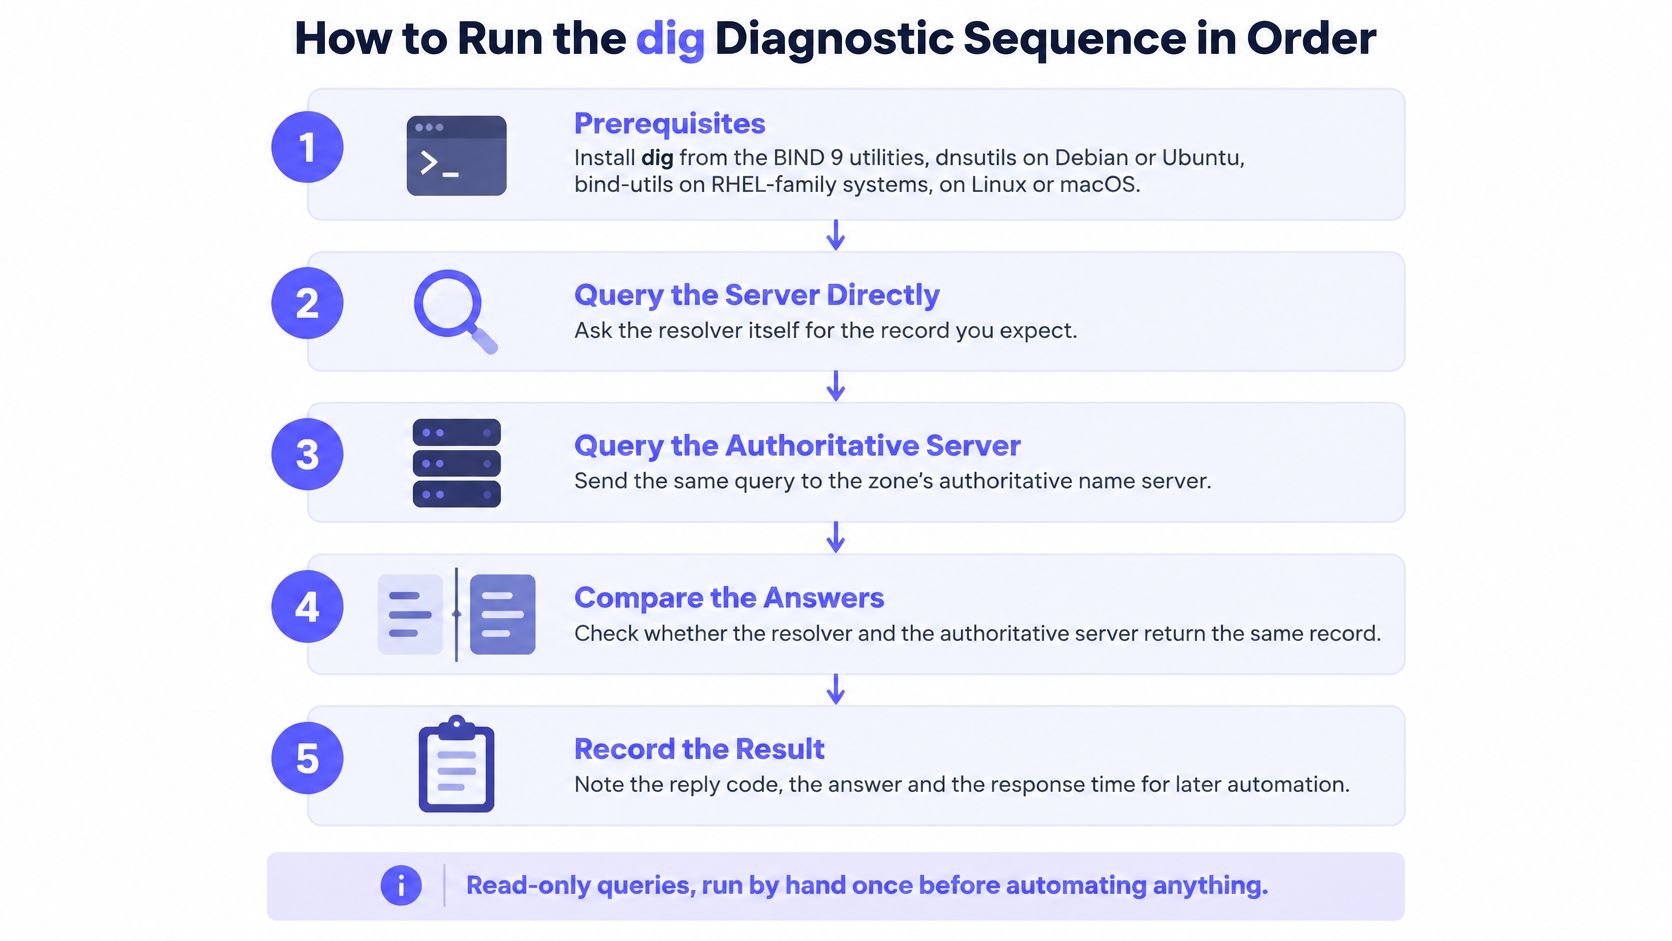
- Query the client resolver for A. Select the resolver explicitly. Preserve the status, complete answer, query time, and whether a response arrived before the configured deadline.
- Repeat for AAAA. Treat this as a distinct record-type test. An AAAA lookup over an IPv4 connection doesn't test IPv6 transport reachability.
- Discover the NS set. Query the zone's NS records for an initial inventory. A recursive answer isn't proof of the parent's delegation; confirm the parent referral during the trace.
- Query every authoritative server directly. Disable recursion and request the same production record. Check the aa flag, status, and expected values, rather than merely checking that an answer exists.
- Compare SOA serials. Request the SOA from each authoritative server and record its serial. Temporary differences during an approved publication need a convergence deadline, not an immediate configuration change.
- Trace the delegation. Follow referrals from the root and identify the slow or failing hop. A blocked outbound path from the diagnostic host can interrupt the trace without proving a zone outage.
- Check a signed answer through a validating resolver. Request DNSSEC material and inspect the ad flag on a trusted resolver path. If validation fails, a checking-disabled comparison can help distinguish validation trouble from unavailable data, but it isn't a fix.
Keep timeouts and retries visible
The IETF resolution-failure guidance limits retries of the same query to the same server address over the same transport to three queries total. Separate record types aren't retries of the same query, and scheduled probes shouldn't multiply attempts.
dig flags used in the sequence
| Flag | What It Changes | Where It Is Used |
|---|---|---|
| +norec | Clears recursion-desired; the server can still answer from authoritative or cached data | Step 4, authoritative checks |
| +time=3 +tries=1 | Sets an illustrative three-second timeout and a single UDP attempt | Every probe step where applicable |
| +noall +answer | Prints only the answer section; omits diagnostic headers and timing | Compact answer logs alongside separate status metrics |
| +trace | Follows delegation from the root and shows each hop | Step 6, delegation fault isolation |
| +dnssec | Requests DNSSEC records; doesn't itself perform validation | Step 7 |
| +cd | Requests checking-disabled handling from the resolver, for diagnosis only | Separating validation failure from missing data |
The timeout setting is an illustrative probe policy, not a universal deadline. Preserve full diagnostic output during setup; compact answer-only output can't distinguish all failure conditions.
The accompanying video provides a visual reference for terminal-based diagnosis.
Schedule Probes from Several Vantage Points
Place authoritative probes outside the nameserver host, resolver probes on representative client networks, and external probes in distinct user regions. An external monitor can't substitute for a check inside a private network, and a local resolver can't represent every remote user's path.
Choose an existing dedicated monitoring name under an operator-controlled zone. Don't create or edit production records merely to exercise monitoring; expected answers should come from the approved zone inventory.
Assign schedules by failure cost
Critical address checks deserve a shorter collection interval than administrative records that rarely change. Query each authoritative server individually so a healthy peer doesn't conceal a broken server behind load balancing or cached selection.
- Address coverage: Schedule A and AAAA independently for critical names, including the applicable CNAME chain.
- Zone coverage: Check MX, NS, and SOA on a slower schedule, with additional checks after approved DNS changes.
- Transport coverage: Label IPv4 and IPv6 transport separately from A and AAAA record types. Where relevant, distinguish UDP from TCP outcomes.
- Regional coverage: Keep an independent probe outside the network serving the zone, and select external regions that correspond to actual users.
In an academic measurement set of approximately 3 billion queries, the DNS query-failure study reported failure rates of about 6.9% for A queries and 64.2% for AAAA queries. Those are findings from that measurement set, not expected production failure budgets, but they demonstrate why record types shouldn't share an undifferentiated status.
Preserve enough context to compare paths
Store timestamp, vantage point, target server, queried name, record type, response code, elapsed time, transport, attempt count, and returned values. Record the expected-answer version too, so an approved deployment doesn't become an unexplained historical mismatch.
A regional latency increase needs network context before an operator blames resolver processing. The network-latency diagnostic guide helps separate path degradation from service-side delay.
A missing probe run isn't a successful query. Preserve it as missing data and alert on collection health independently.
Review the probe inventory whenever a nameserver is added or retired. Otherwise, monitoring can keep testing a removed server while never exercising its replacement.
Expected Results and Alert Conditions for Each Check
Expected results and alert conditions
The windows below are illustrative starting policies, not protocol requirements or measured performance guarantees. Expected values must come from the zone's approved configuration.
| Check | Expected Result | Alert Condition | Window | Collection Failure |
|---|---|---|---|---|
| Client resolver A | NOERROR with expected A value | SERVFAIL, timeout, or unexpected value for a production name | Two consecutive runs per region | dig cannot start, or probe-side resolver access is unavailable |
| Client resolver AAAA | NOERROR with expected AAAA value, or NODATA if none is published | Timeout, SERVFAIL, or unexpected value where AAAA is published | Ten minutes | Probe lacks IPv6 routing for an IPv6-transport test |
| Authoritative answer | NOERROR, aa set, values match the zone | A server returns an unexpected value or lacks aa | Two consecutive runs | Probe-side connectivity prevents execution |
| Delegation (NS) | Parent NS set matches intended zone delegation | Listed server missing or not authoritative | Two runs, thirty minutes apart | Parent or NS query cannot be collected |
| SOA serial | Same serial after expected convergence | Serials differ beyond the normal transfer interval | Sixty minutes, adjusted to publication policy | A server supplies no usable SOA sample |
| Latency | p95 near established baseline | p95 near twice baseline | Ten minutes | Insufficient samples |
| Timeouts | Near zero for production names | Timeout share exceeds established baseline | Ten minutes | Probe metrics missing |
| NXDOMAIN | Stable share for known names | Unexpected rise for names that should exist | Fifteen minutes | No baseline recorded |
| SERVFAIL | Near zero for production zones | Sustained rise above baseline | Five minutes | Resolver statistics unavailable |
| DNSSEC validation | ad on signed answers through a known validating resolver | Confirmed validation failure on a signed zone | Two runs | Validating resolver cannot be reached from the probe |
Separate bad results from absent evidence
A query that was transmitted but received no reply is a timeout measurement. A collector that never launched dig produced no DNS measurement at all. That distinction prevents monitoring failures from being reported as either healthy service or confirmed zone failures.
Some missing samples are ambiguous. If an authoritative query gets no response, retain the timeout and mark answer correctness as unknown; don't suppress the availability failure just because no answer value was collected.
Likewise, missing resolver statistics prevent calculation of server-wide response-code shares, but synthetic checks can still report their individual outcomes. A dashboard should preserve both facts rather than choosing whichever status looks healthier.
Interpret response codes in context
RFC 9520 distinguishes NXDOMAIN, meaning the name doesn't exist, from SERVFAIL, meaning resolution couldn't be completed successfully. Neither should be interpreted without the queried name and expected outcome.
A deliberately nonexistent name should return a negative result. An existing production name returning NXDOMAIN is an answer-correctness failure, even if the resolver responds quickly and consistently.
NODATA isn't NXDOMAIN. A name can exist without an AAAA record, producing NOERROR with no answer for that type. Monitoring should accept that only when the approved expectation says no AAAA record is published.
Define recovery and ownership
For this illustrative policy, recovery requires two consecutive passing runs from the affected perspective. Missing samples don't count as passes, and a passing region doesn't clear another region's unresolved incident.
Use p95 or p99 latency with a minimum sample requirement. A percentile calculated from sparse observations shouldn't carry the same confidence as a well-populated window.
Record the selected threshold, owner, expected-answer source, and recovery rule in the runbook. The real-time alerting guide provides related guidance for turning those conditions into actionable notifications.
Triage a Failing Resolver from Server-Side Signals
When a synthetic check fails, inspect the resolver's counters before restarting services or flushing caches. Those actions change the evidence and can add load while leaving the actual upstream problem untouched.
Start with query volume, timeout share, SERVFAIL share, and NXDOMAIN share, broken down by client and resolver. The Datadog DNS monitoring documentation identifies these client-and-server dimensions as useful for distinguishing resolver-specific failures from client-network problems.
Split local work from upstream waiting
Add cache-hit ratio, memory pressure, processing latency, and upstream response duration. Preserve p50 and p99 distributions rather than relying on a mean that can conceal slow resolution paths.
The DNS observability runbook recommends separating resolver processing time from per-upstream latency. That split narrows the next diagnostic action without pretending that a counter alone establishes the cause.
| Observed symptom | Likely area to investigate | Next read-only check |
|---|---|---|
| Upstream duration rises before SERVFAIL | Forwarding or authoritative reachability | Direct authoritative query and delegation trace |
| Local processing duration rises while upstream timing stays stable | CPU, concurrency, queues, or resource pressure | Host metrics and resolver workload counters |
| Only a client network reports timeouts | Client path, filtering, or resolver access | Same resolver query from another permitted network |
| A server returns unexpected authoritative data | Zone loading or publication | SOA and expected-answer comparison on that server |
| Signed names fail while comparable unsigned names resolve | Validation chain or signature problem | Validating query and diagnostic checking-disabled comparison |
Apply the evidence without overclaiming
Hypothetical scenario: a resolver develops a sustained SERVFAIL increase while direct authoritative checks remain correct. That pattern directs investigation toward the resolver, its forwarder, validation state, or its outbound path, rather than immediately changing zone content.
A cache-hit decline can explain additional upstream work, but it doesn't establish why upstream requests are slow. Correlate the change with traffic composition and upstream timings before increasing resources.
For name-specific failures, the DNS name-resolution troubleshooting guide complements service-wide counters. Keep the diagnostic record attached to the incident so the next operator can distinguish observed facts from working hypotheses.
What a Simple DNS Probe Cannot Prove
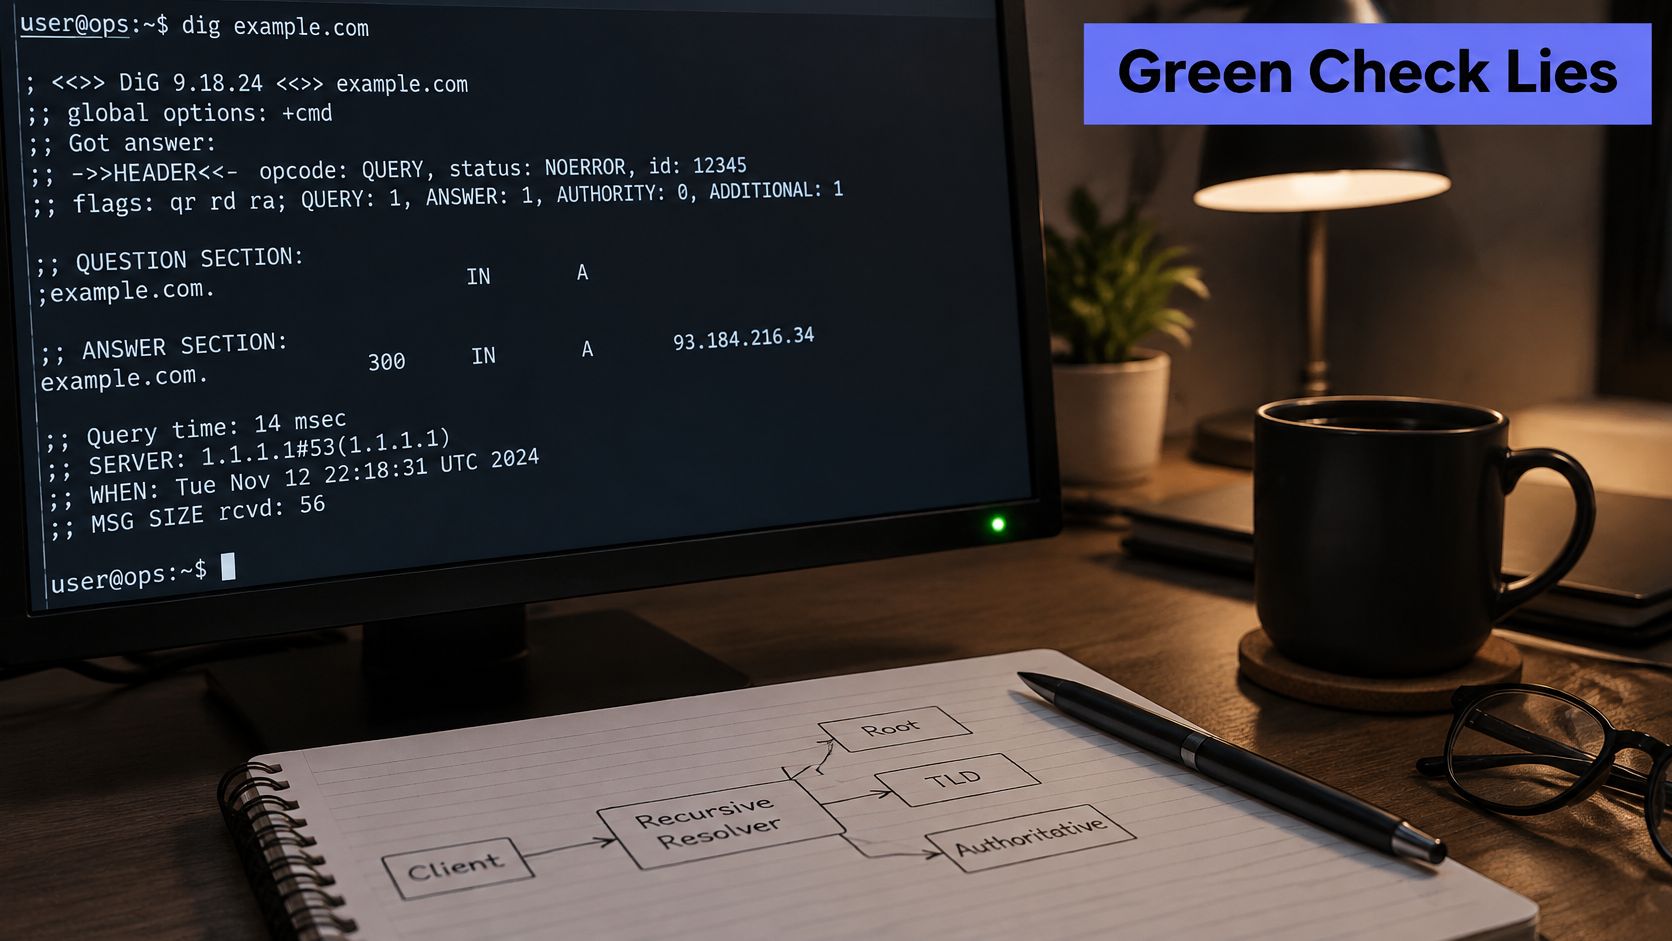
Hypothetical scenario: a resolver continues returning a cached old address after an approved authoritative update. A status-only probe reports NOERROR, but an expected-answer comparison shows that the resolver and authoritative servers disagree.
That disagreement isn't automatically a fault. Compare the remaining cache lifetime and the approved change schedule before declaring stale data; cached answers can legitimately outlast an authoritative update.
This illustration places terminal diagnosis alongside the network relationships a simple status check omits.
Match each blind spot to a specific check
- Lame delegation: A parent-listed server doesn't answer authoritatively for the zone. Inspect the referral and authoritative flag, not just the child's NS answer.
- Incomplete publication: An authoritative server retains an older zone version. Compare SOA convergence alongside the actual critical records.
- Wrong but valid answers: NOERROR accompanies an unintended address or mail destination. Only an explicit expected-value comparison catches that mismatch.
- Expired or broken signatures: The DNS service replies, but validating resolution fails. Exercise a signed zone through a trusted validating resolver.
ISC's BIND 9 monitoring recommendations combine response-code monitoring with service, transfer, and external checks. A rising SERVFAIL rate warrants investigation into validation and valid zone data, not just process availability.
Encrypted DNS changes the observation point
Enterprise encrypted-DNS guidance describes DoH over HTTPS port 443 and DoT over TCP port 853. Passive observation of conventional DNS traffic won't account for every lookup when clients use these paths.
For a controlled resolver, use its query logs, response statistics, and protocol-level health signals. If clients can select external resolvers, approved egress and endpoint telemetry are needed to establish which resolver they use.
Resolver health and resolver adoption are different questions. A perfectly healthy internal resolver doesn't establish that clients are using it.
The internet-connectivity monitoring guide helps place those dependencies in network context. A DNS uptime probe alone doesn't establish complete DNSSEC correctness, delegation correctness, or application connectivity.
Start With One Resolver and One Zone
Begin with a production zone, its authoritative servers, and a representative client resolver. Keep the initial scope small enough that an operator can explain every result without searching through unrelated infrastructure.
Run the manual diagnostic sequence and attach the output to the corresponding matrix entries. Record legitimate differences, including split-horizon answers, geographic responses, and planned publication delays, before treating all disagreement as failure.
Build a small, explainable pilot
The initial automated set should cover the client A answer, direct authoritative correctness including the authoritative flag, and SOA convergence. Add record-type, transport, delegation, and validation coverage deliberately rather than hiding unsupported checks behind a single service status.
- Set expectations: Assign an owner to the approved answer inventory and define how legitimate DNS changes update monitoring.
- Preserve evidence: Retain the target, vantage point, final status, elapsed time, returned values, and collection state.
- Test safely: Use a staging name with a deliberately incorrect monitor expectation. Don't alter production DNS to manufacture an outage.
- Restore the expectation: Return the monitor configuration to the approved value and verify recovery through its configured passing-run policy.
Also test collection failure by pausing a non-production collector or withholding its scheduled run under controlled conditions. The expected outcome is a monitoring-health incident, not a fabricated DNS answer failure.
Add hosted reachability without expanding its meaning
Fivenines Uptime Monitoring runs HTTPS, TCP, ICMP, and DNS checks from four probe regions, with confirmation before alerts reach the team. Its role in this workflow is external availability and response-time monitoring, not replacing authoritative, delegation, or DNSSEC diagnostics.
Review the current uptime-monitoring capabilities before connecting an initial check, and match the documented check behavior to the intended signal. Keep unsupported assumptions out of the runbook, especially expectations about validation depth or authoritative-answer inspection.
The pilot is ready to expand when the operator can identify what each passing result proves, what remains unknown, and who receives a sustained failure. Add coverage according to those gaps, not according to how many green indicators fit on a dashboard.
Fivenines brings external uptime checks and production infrastructure monitoring into one hosted platform. Visit Fivenines to start with a DNS check, verify the availability and response-time readings, and test a safe alert while retaining separate checks for answer correctness, delegation, and validation.