Internet Connectivity Monitoring: What Each Check Proves

Consider this incident: a client reports that a site is down while an external dashboard stays green. Both observations can be valid because the client and the probe tested different paths. Restarting the server or blaming the ISP before comparing those paths can send the investigation in the wrong direction.
Good internet connectivity monitoring separates the client LAN, the ISP access path, DNS, and the externally visible service. It records what each check observed, where it ran, and what remains unknown.
Table of Contents
- Four Layers Between Your Client and Your Service
- What Each Probe Proves and How to Read Results
- Placing Vantage Points for Client and ISP Paths
- Layered Troubleshooting Matrix for Failed Checks
- Alert Rules for Sustained, Regional Failures
- Confirm the Boundary With One Host and One Check
Four Layers Between Your Client and Your Service
The house, the road, the address book, and the front door are different parts of a delivery. Similarly, a web request depends on several systems. A user may describe a failure in any of them as “the internet is down.”
The Question Each Layer Answers
These four layers are diagnostic categories, not a mandatory packet sequence. DNS can use a local cache or resolver, and a proxy or CDN can answer without reaching the origin server.
- Client LAN: Does the host have the expected network configuration, and can it communicate with its gateway?
- ISP path: Can this access network reach the destination, with acceptable delay and loss?
- DNS: Does the resolver used by this client return the expected records?
- Service: Does the endpoint accept the connection, validate TLS, and return the expected application response?
A structured DNS health check covers the third question in depth. The other categories need evidence from the relevant networks too.
An external probe observes its own route, resolver and destination. It cannot directly inspect a client's private LAN, represent every user's connection, or identify a failing ISP router from one failed check.
Practical rule: Match the conclusion to the observation. Failed HTTPS does not prove that the whole network is down; successful ping does not prove that the application works. Successful HTTPS does establish that the dependencies actually used for that request worked sufficiently at that moment.
What Each Probe Proves and How to Read Results
Every probe provides a limited observation from one location at one time. Check the probe's configuration and health as well as the target before combining results into a diagnosis.
ICMP Echo
An ICMP echo reply establishes that the tested address responded to that probe. Repeated probes measure reply loss and round-trip time for that sample. They do not establish that port 443 accepts connections or that HTTPS returns usable content.
If ping fails while HTTPS succeeds, record those two facts. ICMP filtering or rate limiting is one explanation; different destination addresses, IP families and paths are others. A missing ICMP reply alone cannot establish an application outage.
TCP Connect
A TCP connect establishes that a handshake completed to the tested address and port. It does not establish that TLS or the application works. The responding listener may belong to a load balancer or proxy rather than the origin.
Set an explicit timeout and record connection duration. A rise warrants comparison with the baseline, but it does not by itself distinguish congestion, route changes, packet loss or listener pressure. The guide on how to ping a TCP port covers port testing in more detail.
DNS Query
A DNS query reports what a particular resolver returned for a particular name and record type. NOERROR is not enough: verify the requested answer and any CNAME chain. A name can exist without an A record, producing a NODATA response rather than NXDOMAIN. NXDOMAIN reports name nonexistence; SERVFAIL reports resolution failure and does not identify its cause. DNSSEC validation, upstream reachability and server problems are possible investigation paths. RFC 2308 distinguishes negative answers; RFC 9520 covers resolution-failure caching.
Negative answers can persist after a fix. Under RFC 2308, their initial cache TTL is the smaller of the SOA record's TTL and its MINIMUM field; the remaining TTL decreases in cache. Record that remaining value instead of promising instant recovery. Resolution-failure caching is a separate mechanism. Also check the client's resolver: a browser using encrypted DNS may not follow the resolver path used by a command-line test.
HTTPS Request
An HTTPS check tests an application request as well as the connection and TLS. Define success using the expected status and, where relevant, response content. A 200 login page or captive portal is not necessarily the intended service.
The IANA HTTP status code registry lists status classes; HTTP semantics in RFC 9110 explains individual responses. Do not automatically treat every 3xx as a redirect: 304 relates to conditional requests. Follow expected redirects only under an explicit policy. A 401, 403 or 429 can reflect authentication, access policy or rate limiting and may affect real users. A 5xx can originate at the application, reverse proxy or CDN; it does not prove that the origin failed.
Keep the transport result separate from the HTTP result. Without --fail, curl can exit successfully after receiving an HTTP 500. Its timing fields help compare phases, but they are cumulative timestamps and do not isolate server execution time. For broader interpretation, see checking network latency.
Record missing measurements as unknown, not zero. A check that did not run is a collection failure, not evidence that the target is down.
| Check | Evidence from this probe | Not established |
|---|---|---|
| ICMP echo | Replies, sampled reply loss and round-trip time | Working TCP port or application |
| TCP connect | A handshake completed to the address and port | Valid TLS or application content |
| DNS query | Response status and records from the tested resolver | Correct answers for every resolver and user |
| HTTPS request | TLS result, HTTP response and timing for this request | All application journeys or other client paths |
Placing Vantage Points for Client and ISP Paths
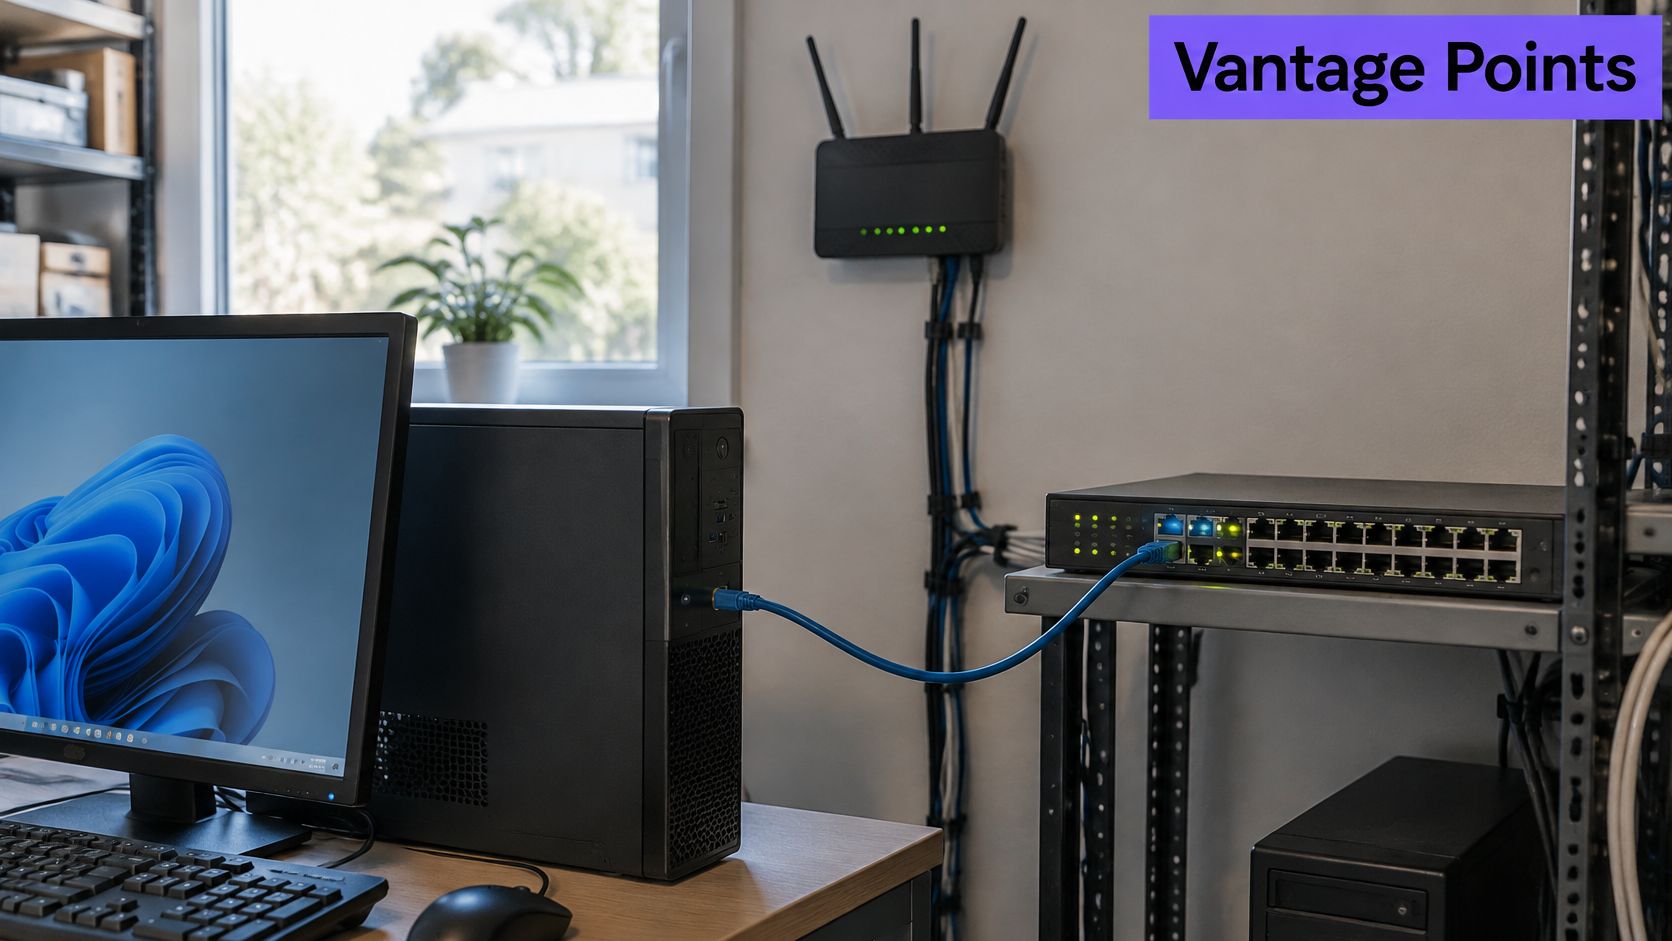
A failed check is compatible with several causes, including a faulty probe. Comparing observations from independent locations helps narrow the investigation; it does not automatically identify the failed component.
Four Positions Worth Recording
- Client LAN host: Run checks from the affected site. Compare local gateway reachability with the end-to-end request; an end-to-end failure alone does not isolate the LAN.
- Second access path: Repeat from another ISP or a mobile hotspot. Keep the request comparable and note differences in DNS, destination IP, IPv4/IPv6 and access policy.
- External probes: Test public reachability from several regions where available. These cover the selected probe paths, not all customers or private networks.
- Origin-side probe: Where you control such a host, test the origin locally. Record whether it bypasses a CDN, load balancer, authentication or public hostname, because that changes what success means.
| Vantage point | Useful comparison | Main limitation |
|---|---|---|
| Client LAN host | Gateway test versus public service test | A failed service test can still involve any downstream dependency |
| Second access path | Same request through another network | DNS, edge routing or policy may change too |
| External probes | Public DNS, TCP and HTTPS across selected regions | No direct visibility into private client connections |
| Origin-side probe | Local origin response versus public endpoint | Local success may bypass the failing public component |
Mark missing vantage points as unavailable. Keep the check definition, timeout and interval consistent where possible, and record unavoidable differences. Include UTC time, resolver, resolved address, IP family, port, hostname and URL path alongside each result.
Layered Troubleshooting Matrix for Failed Checks
Start on the affected client, then repeat from another network where available. The following diagnostics do not change DNS, routing or firewall configuration, but they generate traffic and application logs. Use bounded checks against endpoints you are authorized to test, not broad scans.
The Sequence in Order
- Resolve the name: Use
dig +time=2 +tries=1 example.com A, then queryAAAAif IPv6 is relevant. Inspect the answer and status, not just the command's exit code. The BIND dig manual describes resolver selection and retry options. - Test gateway and path: On Linux, use
ping -c 5 -W 2followed by the actual gateway address, then the service address. Check your local manual on other systems because timeout flags differ. Record which address family you tested. - Test the port: Use
nc -vz -w 5 example.com 443with a compatible netcat implementation. Flags vary, so verify the local manual. Distinguish a timeout from an explicit connection refusal. - Test the application: Run the complete bounded curl example below. Replace the example URL with the endpoint under investigation.
- Inspect the path: A short
mtr -rwc 10 example.comreport can provide a starting comparison. MTR combines path discovery and repeated probing and may require packet-sending privileges. Ten probes are a small sample, not a stable loss estimate.
curl --connect-timeout 5 --max-time 10 -sS -o /dev/null \
  -w 'http=%{http_code} ip=%{remote_ip} dns=%{time_namelookup} tcp=%{time_connect} tls=%{time_appconnect} first_byte=%{time_starttransfer} total=%{time_total}\n' \
  https://example.com/
probe_exit=$?
printf 'curl_exit=%s\n' "$probe_exit"
Run this in an ordinary interactive shell; a script using set -e needs to handle a failed curl command explicitly before it can record the exit code. The curl manual documents these fields. Times are seconds from the start, not independent phase durations. Keep stderr too: http=000 means no HTTP response code was obtained. This example neither follows redirects nor validates response content, and curl_exit=0 does not mean HTTP success. Use it to collect evidence, then apply the endpoint's expected status/content policy.
Keep TLS certificate verification enabled. Record a TLS error rather than hiding it with
-k.
A silent intermediate MTR hop may simply filter or limit diagnostic replies. Loss shown at one hop but absent at later hops is not proof that router dropped forwarded traffic. Compare the final destination, repeated samples and application results before assigning blame. See packet loss detection for a deeper investigation.
Prioritize the earliest demonstrated problem without assuming it explains every symptom. A DNS fault deserves investigation, but other checks or logs may reveal a second failure. Document any controlled bypass separately so it is not mistaken for the normal client path.
| Symptom | Investigation area | First comparison | Supported conclusion |
|---|---|---|---|
| Name does not resolve | Resolver, records, delegation or validation | Compare status, answer and resolver | Resolution failed on the tested path; cause still needs evidence |
| Ping fails, HTTPS works | ICMP policy, address family or path | Match destination IP and test time | This HTTPS request works despite missing ICMP replies |
| TCP times out, ping replies | Listener, policy or transport path | Compare the same IP/port from another network | No TCP handshake completed within the timeout |
| TCP connects, HTTPS returns 5xx | Application, proxy or CDN | Inspect response and corresponding logs | An HTTP component reported a server error |
| Fails from one network only | Local path, resolver or network-specific policy | Compare DNS, IP family and request details | The failure is specific to the tested context, not necessarily the ISP |
| Latency rises without observed loss | Path, TLS, application or probe load | Compare timing phases and baseline | Requests slowed; the location of the delay is not yet established |
Alert Rules for Sustained, Regional Failures
Use corroboration, duration and user impact to decide when to alert. A single failed check may justify action for a critical endpoint, but it should not automatically become a confident root-cause claim.
| Pattern | Useful investigation | Alert context |
|---|---|---|
| Several resolvers return an unexpected answer | Records, caches and authoritative data | Include expected and observed records plus resolver identity |
| Public checks fail while a local origin check passes | Edge, routing, TLS, policy and differences in requests | Identify what the local check bypasses |
| Only one access network fails | Client network, resolver and network-specific edge behavior | Involve the site owner; retain service evidence and user impact |
| One vantage flaps while others pass | Probe health and the particular path | Separate collection failures from target failures |
| Latency rises across locations | Shared dependencies, application and paths | Escalate according to impact and the latency objective |
Thresholds, Recovery, and Dead Probes
Here is a hypothetical policy, not a description of a particular product's settings: require failures from two of three locations at each of three consecutive 60-second check rounds, then three successful rounds for recovery. Specify how missing results affect that decision. Regional agreement and consecutive failures over time are different dimensions; one setting cannot be assumed to implement both. A deliberate monitoring schedule makes detection and recovery delays easier to evaluate.
For latency, compare the same endpoint and vantage with a relevant baseline and an explicit service objective. A warning may suit mild degradation; a page may be appropriate when users cannot complete critical work. If you use p95, record the sample count: one check per minute gives only about 15 observations in 15 minutes, making a tail estimate sensitive to individual samples.
Do not import a universal packet-loss threshold into an application alert. ITU-T Y.1540 is a reference for IP performance and availability measurement; application alert policy still needs its own measurement window and impact criteria. Voice, VPN and API traffic can react differently to loss, delay and jitter.
Define monitoring-health rules separately. For a collector you operate, “no report for two expected intervals” could be a starting condition, adjusted for scheduling and delivery delays. Distinguish intentional pauses from unexpected missing results. For managed probes, use the health signals the provider exposes rather than assuming you can pause or instrument its infrastructure.
Confirm the Boundary With One Host and One Check
A small pilot makes the coverage boundary concrete. Keep existing monitoring running while comparing results.
- Pick one endpoint: Choose a service whose outage matters. Write down its normal resolver, public path and expected status/content.
- Create one external check: Configure the endpoint in Fivenines uptime monitoring. Its current offering includes HTTPS, TCP, ICMP and DNS checks, with US East, EU West, AP Southeast and Africa South as selectable probe regions, plus response-time, availability and HTTPS certificate-expiry monitoring. Verify the actual interval, timeout and alert settings in your account. Regional failure confirmation is not a promise that the hypothetical consecutive-round policy above is a single built-in option.
- Run a comparable client-side request: Record the client LAN result alongside the external result, including timestamps, DNS answer, destination IP and address family. This client-side test is a separate diagnostic; the external check does not automatically deploy a private LAN probe.
- Compare cautiously: An external failure with a client-side pass narrows the difference between two paths. It does not prove that the origin is healthy or identify the edge as the cause. If both pass while users still fail, test the affected hostname, login or application journey.
- Test one controlled failure and recovery: Use a non-production endpoint you own and confirm the chosen notification route. Test missing-collector behavior only for a collector you control and a supported monitoring-health mechanism; do not disable production checks or vendor probes as a shortcut.
Start with one endpoint, compare an external check with an affected-client observation, and validate a safe alert before expanding coverage. Fivenines brings external uptime, server and network monitoring into one platform. Each configured check or integration adds specific evidence; it does not automatically cover every client path.