How to Write Incident Report: Outage Template and Example

Imagine this outage: at 02:40 UTC the checkout uptime check turns red, three host alerts land within ninety seconds, and by the time traffic flows again the ticket holds nine comments that contradict each other. Two days later the client asks for the written report. Nobody can say with confidence whether the first alert or the first customer complaint came first, and the engineer who ran the fix is on leave.
That gap is what the report exists to close. It brings the evidence and decisions together in one durable record, and it will be read by people who weren't in the channel: your own team in three months, the client's operations lead in six, the next engineer who hits the same failure.
A common report-writing failure is blending measurement with guesswork, so "the database failed" sits in the same paragraph as a real error count and the reader can't tell which half is evidence. The fix isn't better prose. It's a label on every statement and a template with a slot for uncertainty.
Table of Contents
- Copy This Outage Report Template
- Label Impact, Observations and Root Cause
- Build the Timeline From Evidence
- Work Through a Hypothetical Storage Outage
- Assign Corrective Actions That Can Be Verified
- Send the Report and Schedule the Review
Copy This Outage Report Template
A production outage report records what broke, who was affected, what the team did, the supported causal explanation and the follow-up work. This template is for an MSP client or engineering team reviewing an IT service outage; it does not replace your organization’s separate security, legal or workplace reporting process.
Google's SRE guidance defines the record plainly: the incident, its impact, the actions used to mitigate or resolve it, the root causes, and the follow-up actions, per the Google SRE postmortem chapter. Everything below is that structure made concrete enough to fill in at 03:00.
| Field | What to write | Evidence to attach |
|---|---|---|
| Incident ID and title | Unique ID and a plain description of the affected service, such as "Checkout 503s, EU region" | Ticket or alert reference |
| Severity and status | Severity level, open or resolved, and the date of the last update | Alert policy or severity matrix |
| Timezone and dates | One timezone for all times, normally UTC | System clock or NTP source |
| Summary | Two customer-facing sentences: confirmed impact and current state; keep any unconfirmed cause explicit | References to the impact and recovery evidence below |
| Confirmed impact | Affected services, measured users or requests, regions, duration, and data-integrity findings or unknowns | Uptime check results, error counts, client confirmation |
| Detection | First signal, the source that raised it, and who confirmed it | Alert history, check configuration |
| Timeline | Timestamped entries from first symptom to closure | Logs, alert events, change records |
| Observations | What a system showed at a given time, with no interpretation | Metrics export, screenshots, command output |
| Hypotheses | Possible explanations, each with the test that would confirm or reject it | Test plan and results |
| Root cause | Supported causal conditions and the evidence that distinguishes them from competing explanations; unknown if unresolved | Reproduction, config diff, or analysis record |
| Contributing conditions | Factors that increased impact or delayed detection | Alert coverage review, capacity data |
| Corrective actions and verification | Each action with owner, priority, target date and check of effect | Change ticket, post-change metrics |
Copy this plain-text skeleton into your incident ticket. Keep unknowns visible instead of filling them with assumptions.
Incident ID / title:
Service / client scope:
Severity and definition:
Service state / investigation state:
Report owner / reviewer / version / updated at (UTC):

Summary (confirmed impact and current state):
Impact window / measurement interval / uncertainty:
Affected users or requests (source and scope):
Data integrity: confirmed findings / checks pending:

Timeline (one event per line):
UTC timestamp | observation or action | source | confidence
First symptom:
Detection / acknowledgement:
Mitigations and observed effects:
Service recovery / validation completed:

Hypotheses / tests / results:
Supported cause(s), or unknown:
Contributing conditions and evidence:

Action | owner | priority | due date | acceptance test | ticket
Open question | owner | next update date
Evidence index (source, capture time, access, retention):
Customer communications / next update:
Review date / reviewer:
Revision history (what changed, why, supporting evidence):
The fields that stall a draft
Three fields stop people cold. Root cause stays "unknown" until evidence arrives, and that is a legitimate entry. Hypotheses are only useful when each one carries the test that would kill it. Confirmed impact names its measurement source and coverage. If you must estimate an affected population, label the estimate and method; a failed regional probe alone does not establish that every user was affected.
Use the same fields for outages detected by uptime checks, host alerts, missed jobs or a client email. Keep the live incident record during the response, then complete the causal analysis and action review afterward. Service restoration can be confirmed while the investigation remains open.
Label Impact, Observations and Root Cause
A misleading sentence can blend a recorded event with an implied cause: "The database failed after the deployment." The deployment may well be relevant. The failure may be real. The reader still can't tell which half was observed and which was inferred.
A label isn't a disclaimer. It's a claim about evidence, telling the reader what the sentence rests on and what would change it.
| Label | Wording pattern | Evidence required |
|---|---|---|
| Confirmed impact | "X was unavailable from HH:MM to HH:MM UTC" | Check results, error counts, client confirmation |
| Observation | "Metric X exceeded Y from HH:MM to HH:MM UTC" | Timestamped metric export or screenshot |
| Hypothesis | "Likely cause: X; test: Y" | A written test plan only, until a result exists |
| Root cause | "Root cause: X, confirmed by Y" | Reproduction, config diff or analysis record |
| Contributing condition | "Contributed by: X" | Alert coverage review or capacity data |
| Open question | "Open: X; owner: Y; due: Z" | Stays open until answered |
One rewrite with explicit evidence
Replace “The database failed during peak traffic” with: “Database connection usage reached its configured limit at 14:07 UTC (observation, metrics export E1). A pool-size change deployed at 13:50 may have contributed (hypothesis). Compare its configuration diff and traffic with the earlier baseline, then test the old and new settings under comparable load outside production. The connection chart alone does not establish causation.”
Two habits keep this honest. Never name a person or a vendor as the cause without evidence; describe the system condition instead. And if an automated tool proposed the cause, say so in the report, because an automated summary is not independent verification.
Practical rule: An observation states what a named source recorded, when and under which conditions. A causal explanation interprets those observations and needs supporting analysis. Either may need correction if the source, clock or interpretation proves wrong; retain the evidence and revision history.
Deciding what counts as "degraded" comes before any of this. The guide to availability metrics covers which signals turn a vague "it was slow" into a number you can defend in front of a client.
Build the Timeline From Evidence
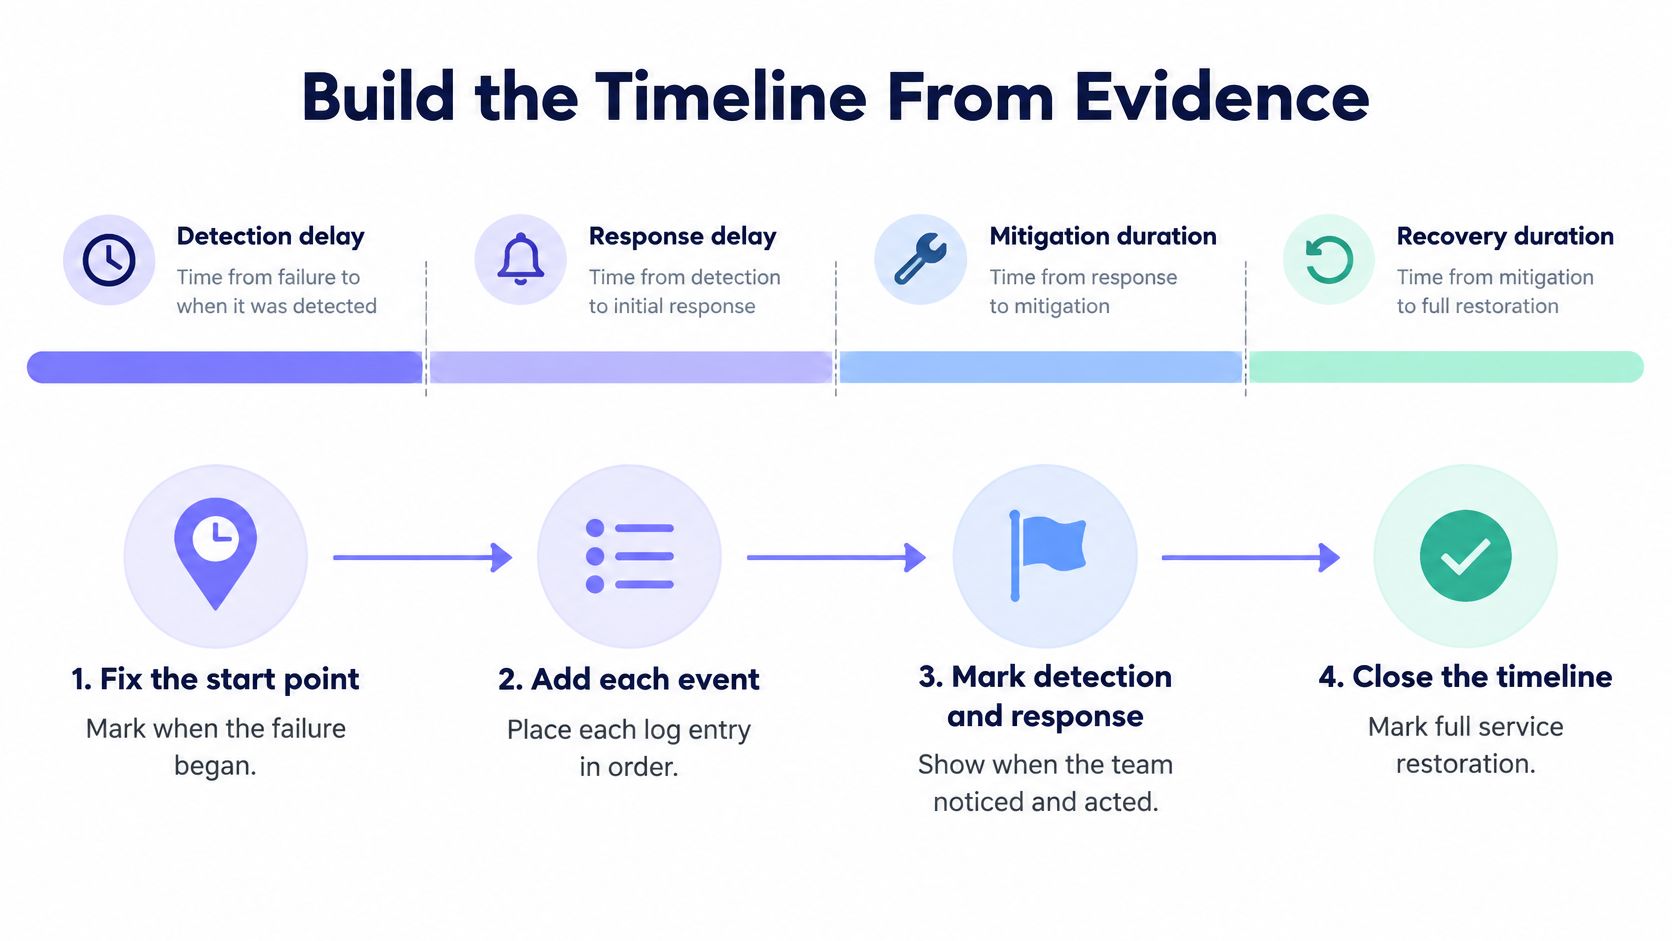
A timeline lets you calculate detection delay, acknowledgement delay, time to mitigation and time to recovery. Define the start and end of each measure: acknowledgement is not necessarily the start of technical work, and a mitigation attempt is not necessarily successful mitigation. These measures can overlap and should not be added without checking their definitions.
For cybersecurity incidents, NIST SP 800-61 Rev. 3, published in April 2025 and replacing Rev. 2, calls for recording investigation actions and preserving records and evidence with their integrity and provenance (RS.AN-06/07). For an operational outage, use the same discipline: record the event time, source and capture time as you work, and control access to the evidence.
Six steps, in order
- Fix one timezone. Display UTC consistently, while retaining original timestamps and UTC offsets in the evidence. Record clock skew and distinguish event time from ingestion time; converting timezones does not fix an unsynchronized clock.
- Find the first symptom, not the first alert. The earliest signal often sits in a failed check or a missed cron run before anyone was paged. Take the timestamp from the source, never from the chat message that mentions it.
- Record detection and confirmation separately. Note who acknowledged and when, plus the moment the failure was confirmed on a second host or region. Describe what each check actually established and its scope; two regional failures corroborate an outage but do not establish its cause or every user’s experience.
- Log each mitigation with its start time and observed effect. "Restarted the service at 09:31" is an action. "Error rate fell to zero at 09:34 after the restart" records an observed improvement, but timing alone does not prove the restart caused it.
- Mark recovery only after a sustained window. Choose the validation window from the service’s checks, traffic and failure mode; ten minutes is only an example. Record both when the healthy interval began and when validation completed. Keep incident closure separate from service recovery.
- Preserve evidence before retention overwrites it. Export alert history, copy the journal lines you'll cite, save screenshots with visible timestamps, and capture the current configuration as a diff.
If a collector or check returns no samples for a window, write "no data" for that window and log the collection failure as its own timeline entry. Writing "normal" across a gap hides the monitoring hole that let the outage run, which is the most damaging error a report can carry.
With Fivenines log monitoring enabled on a Linux host, you choose the systemd services to watch. Error and warning counts, masked samples and journal context attached to an incident can support the report. Logs do not themselves open incidents, and this is not a searchable log archive. Attached log context is deleted after 30 days, so preserve the relevant evidence under your own access and retention policy before it expires; review masked samples before sharing them.
Timestamp mistakes to cut on review
- Times from memory. Label recollections and their uncertainty. Contemporaneous notes or messages can be evidence too; distinguish the recorded message time from the estimated event time.
- Rounding to the hour. "Around 14:00" erases a 12-minute detection delay and makes the monitoring look better than it is.
- Mixed zones in one table. A 17:05 entry beside a 09:05 entry reads as an eight-hour outage that never happened.
Reviewers reconstruct duration from your timestamps. Make them do arithmetic, not archaeology.
Work Through a Hypothetical Storage Outage
Every value below is invented. Assume an MSP client runs a Linux host with an application VM. A scheduled backup begins at 09:00 UTC. For this example, host CPU time reported as I/O wait exceeds 20% from 09:00; an illustrative five-minute sustained condition alerts at 09:05. Checkout requests begin returning HTTP 503 at 09:12. These thresholds are not universal recommendations or a claim about a specific Fivenines rule.
Fill it in this order
Write the summary first, because it forces a decision about severity and state. Then confirmed impact, then the observation that supports it, then the timeline, then the hypothesis, then everything still unknown.
| Field | Hypothetical value | Label |
|---|---|---|
| Summary | Checkout returned HTTP 503 for the observed interval 09:12–09:50 UTC; healthy operation was then validated until 10:00. Cause and data integrity remain under investigation | Confirmed impact and open findings |
| Confirmed impact | Application request logs and two regional checks support a 38-minute error window. Affected request count and data-integrity checks are pending; do not infer global user impact from two probes | Observed impact; scope incomplete |
| Observation | Host CPU I/O-wait readings exceeded 20% from 09:00 to 09:48 UTC. This is host-level context, not a measurement of disk utilization | Observation |
| Timeline | 09:00 backup starts and I/O-wait readings rise; 09:05 resource alert; 09:12 first checkout error and outage alert; 09:14 outage acknowledged; 09:31 backup paused; 09:50 healthy interval begins; 10:00 validation completes | Timeline, illustrative |
| Hypothesis | The backup job saturated the storage device during peak checkout traffic; test by comparing job logs, device latency/queue data and application errors, then reproduce under controlled load in an isolated test environment | Hypothesis, unconfirmed |
| Root cause | Unknown; compare the competing explanations and record the controlled test results before naming a cause | Unknown |
| Contributing conditions | Configuration shows no backup I/O cap and the schedule overlaps client traffic; whether these contributed to this outage still needs testing | Observed conditions, causal role unconfirmed |
| Corrective actions | Test an I/O cap and a lower-traffic schedule that meet backup objectives; validate outage routing and evidence collection before rollout | Proposed actions pending validation |
| Open questions | Whether the backup alone reached the alert threshold; owner is the infrastructure lead; due at the next review | Open question |
Using these illustrative timestamps, the observed impact window is 38 minutes (09:12–09:50), acknowledgement delay is 2 minutes (09:12–09:14), and time from acknowledgement to the pause is 17 minutes (09:14–09:31). The pause-to-recovery interval is 19 minutes, but it is not proof that pausing caused recovery. Recovery validation lasts another 10 minutes, ending at 10:00. Do not add that validation period to the 38-minute impact window. With one-minute probes alone, exact failure and recovery boundaries would remain uncertain within the sampling intervals; the example assumes request logs support them. Report this as one incident’s duration; it does not establish the typical recovery time across incidents.
The root cause row is the important one. Writing "the backup caused it" would feel decisive and could be wrong in a way that sends the next fix sideways: the backup may have exposed a storage limit that also affects snapshot jobs and container image pulls. Leaving it marked unknown is more useful than a confident guess, and the report says exactly what test closes the gap.
I/O wait is a CPU-accounting signal, not a disk saturation percentage. The Linux kernel documentation describes limitations in its accounting. Compare it with device latency, queue depth, throughput and application behavior. The guide to disk queue length explains the device-level measurements needed to investigate the storage hypothesis.
Assign Corrective Actions That Can Be Verified
"Retrain staff" doesn't demonstrate that a hazard was removed. "Improve monitoring" has no owner, no threshold and no test. Both are common, and both leave the next incident to find the same gap.
Give every action five fields: the control to change, a responsible team or named role, a priority level, an explicit due date, and a verification method. Google's SRE postmortem guidance assigns action items a priority level and recommends feeding them into the team backlog with completion objectives agreed with stakeholders, per the SRE workbook on postmortem culture. That's the difference between a lesson and a work item.
From weak action to verifiable action
For the hypothetical outage, create action A1: evaluate an I/O cap and a lower-traffic backup window, owned by the infrastructure lead, priority P2, due 20 November 2026 (an illustrative date). Record the chosen schedule and rollback plan in its change ticket. Acceptance: an isolated load test and two subsequent scheduled backup runs finish within the agreed backup window, pass the backup tool’s verification, meet the client’s recovery-point objective and keep checkout errors and latency within the agreed service limits. Record measured results; two successful runs do not prove the failure can never recur.
Map supported contributing conditions to actions, and keep unconfirmed ones as tests. The example already has an I/O-wait alert at 09:05, so adding the same alert would not close a demonstrated gap. Review who received it and why the later outage required a separate response. Test notification routing and define how missing telemetry is detected. If your monitor supports a three-cycle missing-data rule, document the interval, maintenance behavior and acceptance test instead of treating that example as a built-in default.
A corrective action needs observable acceptance evidence. That evidence may be a metric, a restore test, a configuration check or a documented exercise; it does not have to appear in a dashboard.
The analysis behind the action should explain why existing safeguards failed and identify changes that reduce either the probability or the impact of a repeat, as the Google SRE incident response guidance frames it. When a verification run finishes, record its date and the metric that showed the change, inside the report. Then set a review date in the report itself so a named person confirms completion and checks whether the failure returned.
The habits that keep actions from stalling between incidents, including how ownership and follow-up are tracked after the call ends, are set out in the guide to incident response best practices.
Send the Report and Schedule the Review
Four checks before the report leaves your hands. Blameless wording: no unverified claim about a person or a vendor. Evidence attached: every confirmed fact points to an export, a screenshot or a command output. Owned actions: each corrective item carries an owner, priority and verification method. Sensitive data removed: no personal data, credentials or client-identifying detail that doesn't belong in a document that may be forwarded.
Agree the send time with the client, and put the verification review on the calendar before you send. That single scheduling act is what stops corrective actions from dissolving into a backlog nobody reads.
Keep a revision log with the changed field, new evidence, reason, author and date. Correct the current report when a conclusion changes, while retaining the earlier version in an access-controlled history. A superseded claim should be clearly marked so it is not mistaken for the current finding.
The wider lifecycle is covered in the guide to the incident management process. The Fivenines public API exposes resources including uptime monitors and incidents using API-token authentication. Check the current endpoint schema and retained data before designing an export; format the report in your own tooling and keep tokens out of reports. This does not imply a native incident-report writer or a complete forensic record.
For a practical pilot, connect one representative host or uptime check and verify that its readings match the service. Configure a route using the Fivenines workflows page, then send a safe test notification to an agreed destination and retain the delivery evidence. Review the plan and channel configuration before relying on it for client incidents.
Use Fivenines to gather monitoring evidence, then combine it with application logs, change records and client observations in the report. Keep facts, hypotheses and open questions distinguishable all the way through review.