NVIDIA Xid Errors Linux: How to Triage Safely

A single line in the kernel log that reads NVRM: Xid (PCI:0000:5a:00): 13, pid=..., name=python is not a verdict on the health of a graphics card. It is a driver report, written the moment a general GPU fault occurred, and the same code can come from an out-of-bounds access inside a CUDA kernel, a driver defect, or a card that is degrading. Teams that read the number as a diagnosis either replace hardware that was fine or restart a job that crashes again an hour later.
The narrower question is the useful one. Which layer failed, and what evidence separates the plausible branches? Start by collecting evidence without changing the workload. Reproduction, diagnostic archives and recovery actions have separate operational effects and may take much longer. This walkthrough follows the NVIDIA Xid errors Linux investigation in the order an on-call engineer needs it, from the first search command to the evidence bundle handed to a vendor.
Table of Contents
- Find Xid Messages in the Kernel Log
- Capture GPU, Host and Workload Context
- Match Xid Patterns to the Next Check
- Verify Recovery and Decide Whether to Reboot
- Retain Evidence and Escalate Safely
- Confirm the Next Check on One GPU Host
Find Xid Messages in the Kernel Log
Start with the command that lists Xid lines from the active boot:
journalctl -k -b | grep -F 'NVRM: Xid'
Nothing in that pipeline writes, resets or reloads anything. It reads the kernel journal for the current boot and filters for the exact driver marker. The -F flag requests literal matching. Neither the colon nor the space needs escaping in this pattern; quoting keeps the whole pattern in one shell argument. A plain grep 'NVRM: Xid' also matches this text.
The sequence below is the order that produces a usable result.
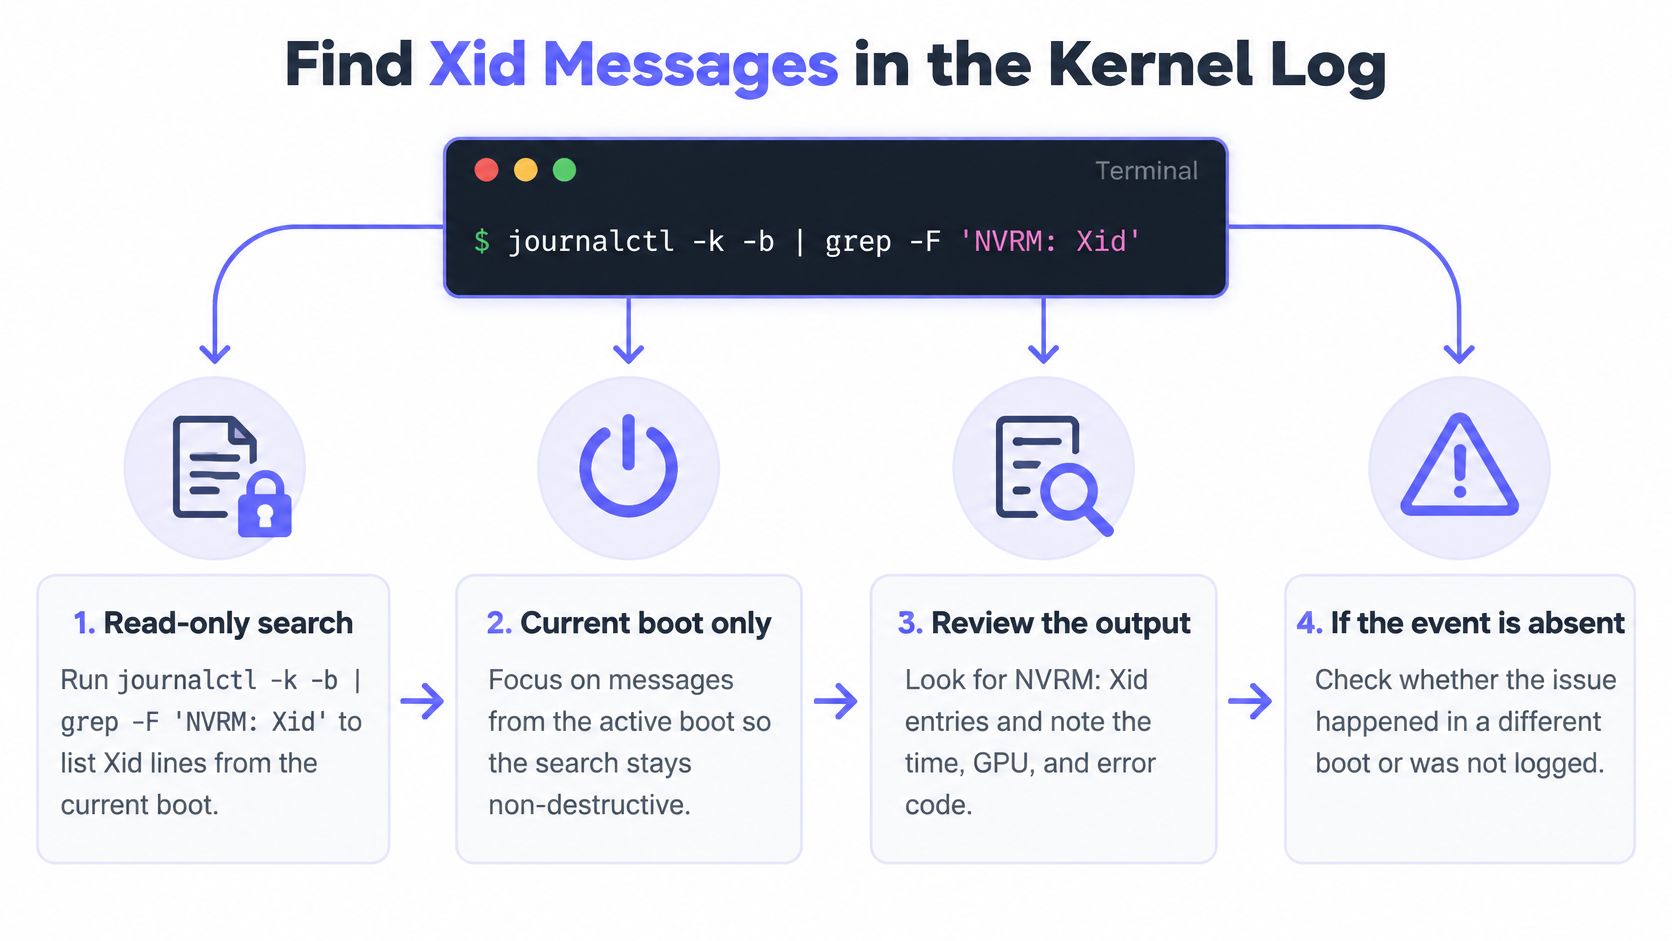
The illustration scopes the search to this boot; reading a retained previous boot is also non-destructive.
- Search the current boot first.
journalctl -k -b | grep -F 'NVRM: Xid'shows whether the fault happened since the last restart. If access is denied or limited, use an authorized account with journal access orsudo; group names and ACLs depend on the distribution. - Check the previous boot.
journalctl -k -b -1reads the boot before the current one, when that boot is retained in the journal being queried. Checkjournalctl --list-boots. Volatile local journals do not survive reboot; persistent or centrally forwarded copies may still exist. - Fall back to file logs. If a syslog service is configured to retain these messages,
sudo grep -F 'NVRM: Xid' /var/log/syslogon Debian and Ubuntu, or/var/log/messageson RHEL, Rocky and AlmaLinux, may retain a copy. These paths are not guaranteed to exist; check rotated files and any central log destination too. - Record four fields per line. Note the timestamp, the PCI bus address in brackets, the Xid number, and whatever device or process identifier the line carries. Preserve nearby
NVRM: GPU at ... GPU-...identity lines as well: filtering only Xids can omit the UUID mapping. - Copy the surrounding context. Export an unfiltered kernel-log window, including PCIe AER, IOMMU and thermal messages. Replace these example UTC times and the boot selector with the incident values. The second command is only a focused view; keep the complete window as evidence. See the journalctl manual for boot and time selectors.
journalctl -k -b --utc -o short-iso-precise --no-pager \
  --since "2026-11-15 09:14:00 UTC" --until "2026-11-15 09:20:00 UTC"
journalctl -k -b --no-pager | grep -E 'NVRM: (Xid|GPU at)|AER|IOMMU'
NVIDIA's guide to working with Xid errors is explicit that these are driver-generated reports written to the kernel log and surfaced through journald or distribution log files, and that the underlying event is a general GPU fault rather than proof of a defective card. Correlating timestamp, device identity, workload and preceding messages is the investigation method used here, not a diagnosis supplied by the code.
Practical rule: an empty grep means no matching line was returned from that input. It does not establish GPU health. Rotated logs, a non-persistent journal and a ring buffer that has already wrapped all produce the same silence as a healthy device.
Reading the output is mechanical once the lines exist. A typical record contains NVRM: Xid, a bracketed PCI address, a numeric code, and often a pid and process name. Later entries in a burst may show the same bus address with a different code, which is normal: an initial fault frequently triggers cleanup events behind it.
What the reader holds at the end of this step is a timestamped list of Xid events per host, each tied to a bus address, ready to classify.
Capture GPU, Host and Workload Context
The following queries gather context without requesting a reset or configuration change. A missing workload identity limits application diagnosis, but a device-level fault can still require immediate action. Keep the output private because process and container details can contain sensitive information.
- Map the bus address to a physical GPU.
nvidia-smi --query-gpu=index,pci.bus_id,uuid,name,driver_version --format=csvconverts the address from the log into an index, a UUID and a card model. Note both index and UUID. The index can shift across reboots when cards are added or reordered; the UUID does not. - List compute processes. Start with
nvidia-smi --help-query-compute-appsto check the installed version’s fields, then querynvidia-smi --query-compute-apps=pid,process_name,gpu_uuid,used_memory --format=csv. Join the GPU UUID to step one. This lists currently visible processes, not a historical process inventory; an empty result cannot identify what ran before the crash. Container PID namespaces and virtualization can limit visibility. - Capture thermal, power and ECC state.
nvidia-smi -q -d TEMPERATURE,POWER,ECCreturns temperatures, power draw and any error-correction counters. On GeForce-class cards and some virtualized environments those ECC sections are missing, which is a reporting limitation rather than a clean bill of health. - Record the software stack.
uname -rfor the kernel release, plus the driver version from step one. Both belong in the ticket, because a fault that appears across several hosts after one driver or kernel update is a different problem from a fault isolated to one card. - Link the PID to a unit or container. Run
cat /proc/<pid>/cgrouporsystemctl status <pid>to find the owning systemd unit, thenjournalctl -u <unit> --since "<incident time>"for that service's own log. For containers, use authorized runtime inspection to recover the image digest and launch command. A PID may have exited or been reused, so confirm its start time. Inspect output can include environment secrets; do not paste it unreviewed into a ticket.
The reasoning behind the order is simple. Use the host, incident timestamp, PCI bus address and GPU UUID together. The bus address identifies a location on that host, not a globally unique card, and physical changes can change the mapping. Workload identity decides whether the failure follows the job or the hardware. Versions decide whether the incident is a regression or a one-off.
Rule of thumb: if the compute process list is empty and no unit started a job near the Xid timestamp, treat workload identity as unknown and say so in the ticket. Guessing invites a vendor to chase the wrong layer.
For background on the metric side of GPU observability, the existing guide to tracking GPU performance on Linux servers covers what to collect on an ongoing basis. What matters at incident time is narrower: the context set of GPU identity, workload identity, versions, and telemetry from the minutes around the event.
Match Xid Patterns to the Next Check
An Xid is a triage signal. NVIDIA's Xid error documentation describes the codes as debugging guides produced when a general GPU fault occurs, and lists incorrect driver programming, corrupted commands sent to the GPU, and hardware or application problems among the possible sources. Several layers can raise the same number, so the evidence captured around the event decides which branch to test. What the catalogue does fix is meaning: a code keeps its definition across driver versions, which makes comparing incidents across hosts and releases worthwhile.
Look up the exact code and applicable GPU generation in the current Xid catalog. The table below is a triage aid, not a rule that application debugging must precede urgent device recovery.
| Log evidence | Candidate explanation | Initial evidence check | Next decision |
|---|---|---|---|
| Xid 13 with a crashed process | Application fault, with other causes possible | Capture application error and nearby kernel messages | Reproduce under a debugger only in an isolated test |
| Driver context with no clear workload identity | Driver or unresolved cause | Record versions, full log window and device identity | Collect a diagnostic archive; do not infer cause from missing PID data |
| Repeated faults at one device across unrelated jobs | Device, slot, power or shared software issue | Compare UUID, bus mapping and reported telemetry | Plan a controlled comparison and vendor diagnostics |
| Xid 45 after another fault or deliberate termination | Possible cleanup event | Read preceding Xids and check the platform-specific catalog | Follow the initiating fault; do not treat every cleanup line as a new hardware failure |
| Xid 79, device inaccessible over PCIe | Device or PCIe path failure | Preserve kernel and platform events | Stop new placements and follow the vendor recovery procedure; do not wait for a second day |
| Failures on hosts sharing one recent update | Regression candidate | Compare versions and equivalent workloads | Use a controlled reproduction; correlation alone does not prove the update caused it |
Investigate application-associated faults
For an application-associated Xid 13, NVIDIA recommends debugging the application, for example with Compute Sanitizer memcheck. It runs and instruments the application: the job can still write data, call services and consume GPU resources. Use a disposable fixture on a drained test device, with production writes disabled. For example:
# Runs the named test program; not a read-only system inspection.
compute-sanitizer --tool memcheck --error-exitcode 99 ./cuda-repro --fixture test-input
cuda-repro and its fixture option are placeholders for your own bounded test. Save the report and exit status. A clean run covers only the exercised paths. If device health or the code-specific recovery action indicates a more serious fault, investigate that branch without waiting for sanitizer results.
Investigate the driver branch
If the driver branch remains plausible, collect evidence before unloading the module or rebooting when service impact permits. NVIDIA’s collection instructions describe sudo nvidia-bug-report.sh, which writes a compressed archive and can occasionally hang. It is not a pure read-only query. Use the installed vendor script in a restricted working directory, review its output before sharing, and consult the documented safe-mode fallback if collection stalls. Do not delay urgent isolation of an unhealthy node just to complete the archive.
Investigate hardware with controlled comparisons
Repeated faults on one device justify investigation, but do not prove the card is defective. In a maintenance test, hold image, input, driver and settings constant while comparing compatible GPUs. Then change one variable at a time. This narrows the possibilities without pretending that one successful run rules out intermittent hardware failure. Temperature and power history add context; see NVIDIA GPU temperature monitoring on Linux. For physical checks, follow the system vendor’s powered-down service procedure and coordinate downtime. The GPU fault diagnosis walkthrough from Steel City IT provides background on that hands-on layer, not a substitute for the server’s service manual.
As a hypothetical test: the same input fails under the new loader and passes under the old loader on the same test GPU, while memcheck identifies an out-of-bounds write. That supports investigating the code change. Changing both GPU and loader at once would confound the comparison. This is an example of test design, not a reported customer incident.
Threshold discipline: pick the observation window before the incident and write it into the runbook. Choosing it after the fault, based on how the operator feels at 3 a.m., is how a real regression gets closed as noise.
Verify Recovery and Decide Whether to Reboot
The required recovery depends on the code, GPU generation, driver and topology. Some application faults allow a process restart; others require draining, reset or reboot. Read the reported GPU Recovery Action where available and consult the NVIDIA node triage guidance. Do not promise recovery without a reboot.
- Application failure with no device recovery required. Restore or restart the application according to its runbook, then test useful work.
- Reset completed. Lost CUDA contexts are not restored by a reset. The scheduler or operator must restart affected jobs, using checkpoints where available, then verify their results.
- Device unavailable or recovery required. Stop new work and follow the hardware-specific recovery procedure, including host or VM reboot when required.
Shared GPU hosts and container platforms make this harder, because restarting one workload can leave stale device state, orphaned jobs or reduced capacity for every other tenant on the card.
Use these acceptance checks after the required recovery action. They are a suggested operational checklist, not a vendor certification:
- Run a fresh
nvidia-smi -qand check identity, supported health fields and any GPU Recovery Action. A responsive query alone does not prove workload health. - Run a bounded, preapproved CUDA test on the intended device and validate its result, then check the affected service. This executes work and belongs in a controlled recovery window.
- Check an application operation that requires GPU execution. A generic service startup line or an existing PID alone does not prove a CUDA context was created successfully.
- Watch the kernel journal for new Xid lines on the same bus address across an observation window you set, for example 24 hours.
- Compare supported ECC, row-remap and temperature readings against the baseline. Record which counters reset during recovery; a smaller counter alone is not evidence of improvement.
Interpret new Xids using the code-specific guidance and preceding events. A failed acceptance test or an action requiring device isolation keeps the resource out of service. An informational cleanup event can have a different response. A quiet observation window supports recovery but does not establish the original cause.
nvidia-smi --gpu-reset is disruptive and requires root. Without a target selector it can address all GPUs; devices must not be in use, and NVLink, NVSwitch and virtualization impose additional restrictions. The nvidia-smi manual warns that reset is not guaranteed and is not recommended as a general production action. Use the platform’s approved recovery procedure, with all affected tenants coordinated. Moving work elsewhere is failover, not an undo for lost GPU state. Event correlation across host, GPU and service timelines helps assess the result.
Retain Evidence and Escalate Safely
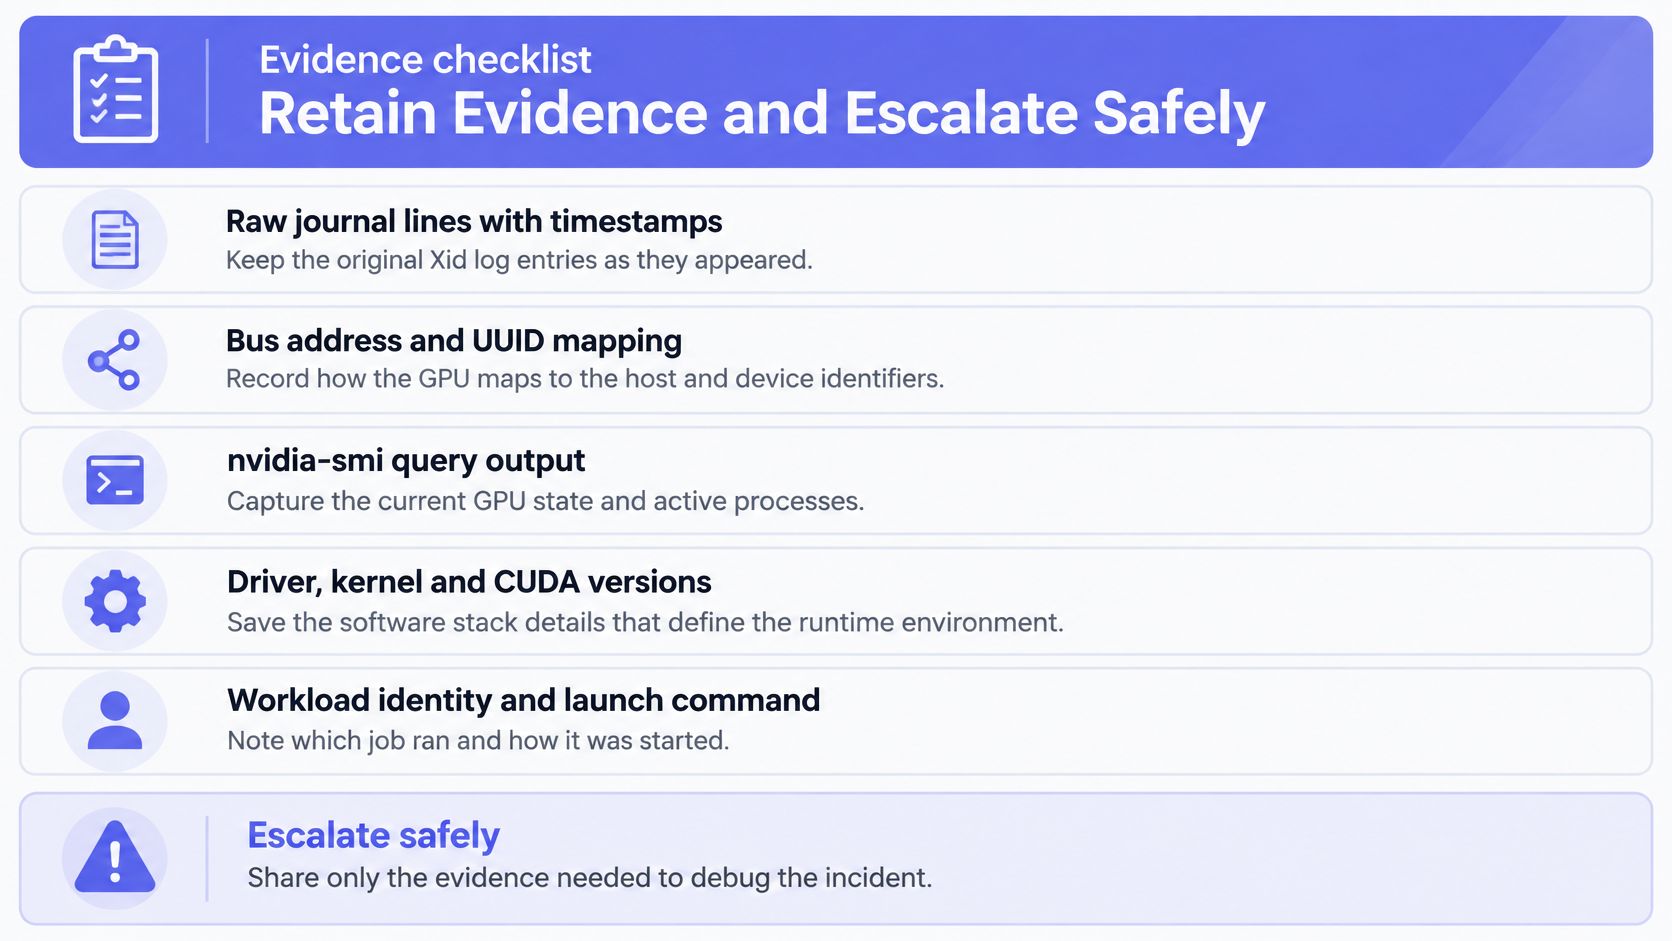
The bundle matters more than the narrative. Collect this before closing the incident:
- Raw journal lines with timestamps, copied verbatim from the source, not retyped or summarised.
- Bus address and UUID mapping from the
nvidia-smiquery, so the receiver knows which physical card is meant. nvidia-smi -qoutput covering temperature, power, ECC and row-remap state where the card reports them.- Driver, kernel and application CUDA runtime versions, including the container image digest and recent changes. The CUDA compatibility version displayed by
nvidia-smiis not proof of the toolkit or runtime used by the job. - Workload identity and launch command, meaning the unit, container image and entrypoint.
- Recovery verification results, including which test ran and what it returned.
- The
nvidia-bug-report.sharchive whenever the driver path is suspected.
Where a field was never captured, write unknown. An estimated value in a vendor case costs more time than a gap.
Escalation splits by layer. For user-programming faults, NVIDIA's Xid investigation guidance points at CUDA-GDB or Compute Sanitizer's memcheck. Suspected hardware problems go to the hardware vendor with the bus ID, recurrence dates and recovery results. Suspected driver defects go to NVIDIA with the bug report output, and the same page is clear that an Xid does not identify a single failure class, which is why the destination depends on the suspected layer rather than the code.
For non-urgent recurrences, define a review window and owner in advance. Never use a two-day recurrence threshold to postpone action required by the current Xid or an unavailable device. Preserve the initial event and all intervening recovery steps.
Handling rules are essential. Keep an unmodified restricted original, then review a sharing copy for tokens, environment secrets, personal data and sensitive host or network details. Retain the diagnostic identifiers needed by the authorized recipient; record any redactions that could affect analysis. Never disable TLS verification to make a diagnostics tool connect. Never paste secrets into a ticket. Run only diagnostic scripts you have reviewed, from sources you trust, and prefer the vendor's own script for vendor cases.
Closing artefact: one directory, a README index listing every file with its host and timestamp, the raw log extract, and each command output saved under a name that states what it contains.
The build-up matters. Incident response habits are the difference between a bundle that resolves a case in one round trip and a thread that drags for a week, and the wider practices in this guide to incident response apply directly to GPU faults.
Confirm the Next Check on One GPU Host
Fivenines GPU monitoring shows NVIDIA utilization, temperature, VRAM and power draw as supporting history around an incident. It does not decode Xid codes, reset GPUs or replace the kernel log workflow, and the metrics depend on supported hardware, drivers and visibility to the host or guest doing the collection. Use the Xid and surrounding logs as fault evidence, with metric history as context. Neither alone establishes root cause.
A reasonable pilot looks like this. Follow the GPU monitoring prerequisites: use a supported Linux host or passthrough guest with a working NVIDIA driver, NVML device access and GPU collection enabled in the standard agent. Compare the available readings with local nvidia-smi output; the feature page itself is documentation, not the setting that enables collection. Test one alert on a non-production resource, and only on a notification channel your plan includes. Check the current feature and pricing pages before relying on any plan detail.
Keep the pilot if the readings match local tools and the timeline shortens your next review. Drop it if it duplicates a dashboard nobody opens.
Fivenines collects NVIDIA GPU utilization, temperature, VRAM and power draw from Linux hosts next to server metrics, so the history around an Xid is already on one timeline when the next incident opens. Connect a single GPU host, compare its readings against local nvidia-smi output, and keep it only if that context earns its place in your runbook. Start at Fivenines.