Agent vs Agentless Monitoring for Mixed MSP Estates

A client site has healthy servers, silent switch graphs and a website that still answers. Before anyone restarts network equipment, the operator needs to identify which host collects those readings. For a mixed MSP estate, agent vs agentless monitoring is a per-target decision: local agents collect server context, SNMP pollers collect network-device counters, and external checks measure service reachability. The overlooked dependency is the polling host itself.
Table of Contents
- Choose the Collection Method for Each Target
- Why Fivenines Uses an Agent on the Polling Host
- Comparing Visibility and Access Requirements
- Failure Modes and the Blind Spots Each Model Hides
- Operating Cost and Scale Across a Mixed Estate
- One-Site Pilot Checklist Before You Roll Out
- Choose Your Collection Mix for the Next Site
Choose the Collection Method for Each Target
Start with the signal needed during an incident, then choose where collection should run. A server needs local inspection to explain resource pressure; a switch needs a reachable SNMP poller; a public service needs a check that doesn't depend on its own host reporting healthy.
Collection methods in Fivenines for a mixed MSP estate
| Target | Collection method | What you see | Access you grant | Main failure mode |
|---|---|---|---|---|
| Linux or Windows server CPU, memory, disk | Local agent over outbound HTTPS | Host metrics at the 60-second default interval | Agent installation and host permissions | Agent stops reporting, leaving a collection gap |
| Services, processes, journald units | Local agent | Service and process state; allowlisted-unit counts, error patterns and bounded incident context | Scoped host access and selected journald units | A unit outside the allowlist isn't observed |
| Proxmox cluster, nodes, VMs, LXC, storage | Local agent on a cluster node | Cluster quorum, node, guest and storage state | Agent on the node with access to the required cluster information | A running guest doesn't prove its application works |
| Switches, routers, firewalls | SNMP v2c or v3 polling by an agent host | Interface traffic, errors, reachability and alerts | Explicit device entry, SNMP settings and a permitted polling path | Poller failure affects every device it polls; credential failure affects devices using that credential |
| Websites, APIs, ports, DNS | External HTTPS, TCP, ICMP and DNS checks | Reachability and response time from outside | A reachable endpoint for the selected check | Detects failure without necessarily explaining its cause |
| Scheduled jobs | Cron monitoring | Missed or failed runs | Permission to instrument the job's execution reporting | Missing execution reports can't alone distinguish a failed job from failed reporting |
Which method, rather than which vendor?
Server metrics belong close to the operating system. CPU, memory and disk readings help explain what happened inside the workload host, rather than merely whether it answered a remote probe.
Services and journald need deliberate scope. Fivenines journald log monitoring is Linux-only, opt-in and in beta. It collects summaries for selected systemd units; incident digests are currently read through the MCP incident_context tool, rather than a searchable web log viewer. Systemd service monitoring is a separate module with a short journal tail for failed units. Select the needed units and verify the intended access path during the pilot.
Proxmox state provides the infrastructure hierarchy. Guest-level application checks remain separate because virtualization state and application availability answer different questions.
Network devices expose management counters without an additional monitoring installation on the appliance. Their collector still needs compute, credentials and network access.
External checks provide an independent service perspective. An HTTPS response establishes something different from a running web-server process.
Scheduled jobs need completion evidence, not just host uptime. A reachable backup server doesn't establish that its scheduled work finished successfully.
Selection rule: Choose the collection method that supplies evidence for an operational decision, not the method that collects the most fields.
Most mixed estates need both models at once.
Why Fivenines Uses an Agent on the Polling Host
For SNMP polling, agentless means no additional monitoring package on the switch. A collector still requests its counters and forwards the results. Other products can implement that collector as a service, appliance or remote management integration; Fivenines uses its agent on a reachable host. This requirement is specific to the implementation, not a rule that every agentless system needs a separate host-monitoring agent.
The physical setup includes both the appliance and the server performing that work.
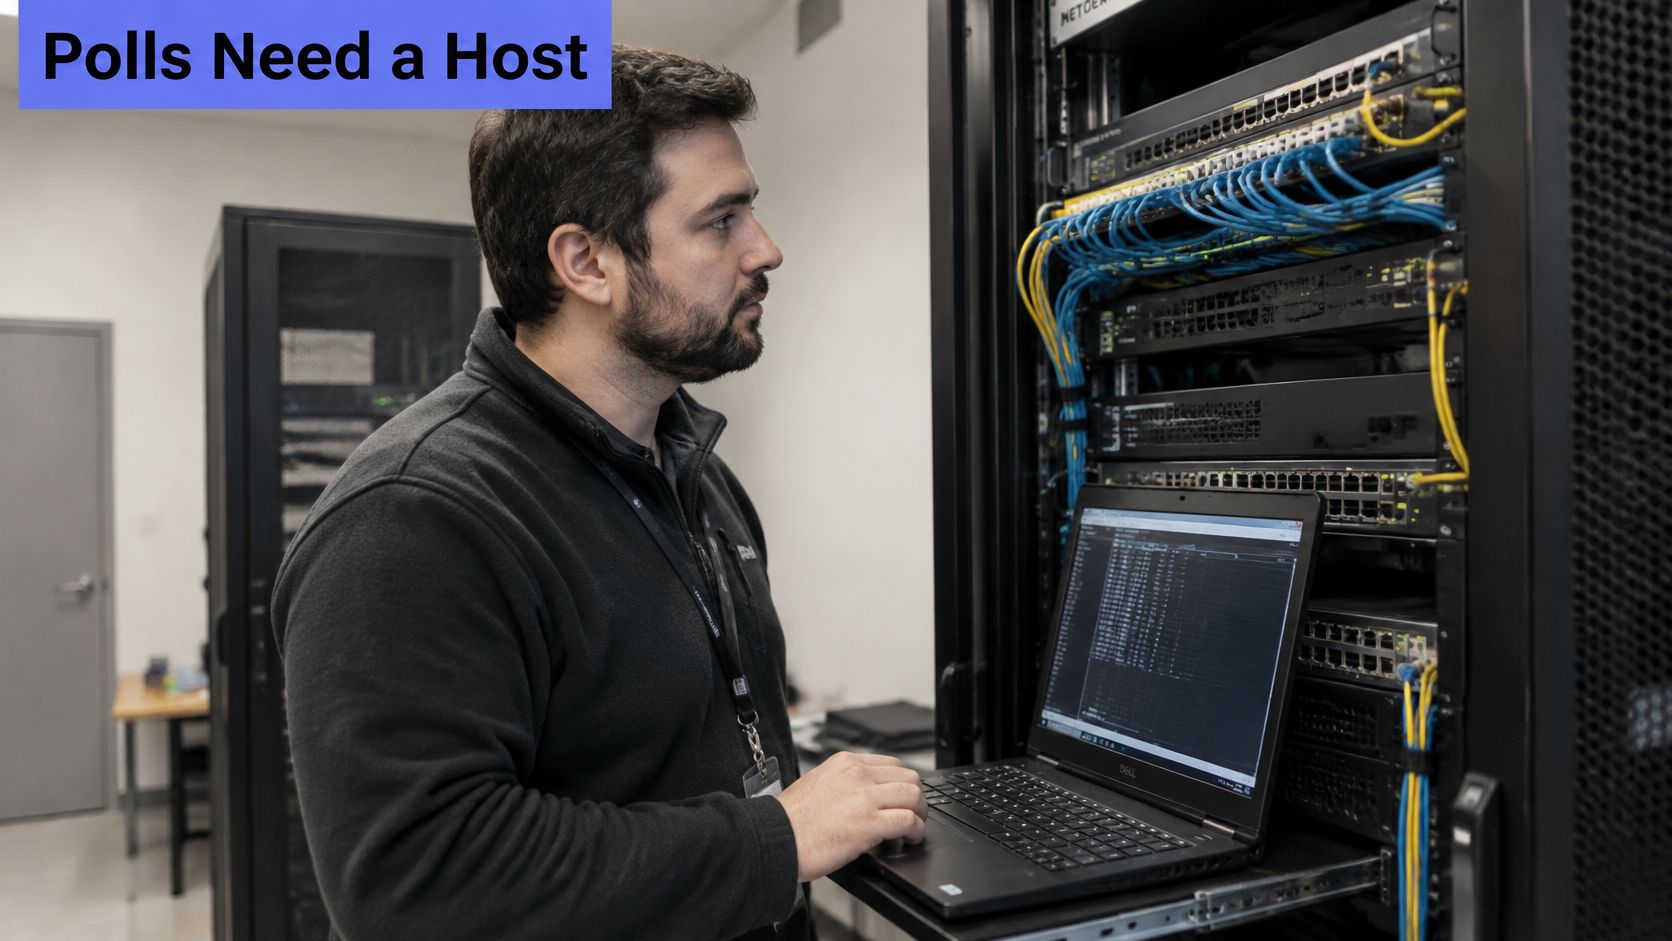
Fivenines is the publisher's product, so this is a vendor-specific implementation, not an independent tool ranking. Its network monitoring uses a local agent host that can reach the client's devices, with SNMP polling enabled and each device entered with its own settings and credentials. Separately installed net-snmp tools support that polling.
The dependency chain
Device counters → local SNMP polling host → outbound HTTPS → hosted platform
The agent pushes results over outbound HTTPS. The host doesn't need to expose an inbound agent port to the internet, but it still needs an allowed outbound path and a working local route to the devices.
The poller's responsibilities are distinct:
- Agent health: The collector process must run and deliver results.
- Device access: Routing and access rules must permit polls and replies.
- Credential validity: Each device must accept the configured SNMP version and security settings.
For the broader host-side setup, the remote server monitoring guide provides the shared operational foundation.
The video below demonstrates SNMP polling in SolarWinds Observability Self-Hosted. Its menus and installation steps apply to SolarWinds, not Fivenines; use the Fivenines collector requirements for this pilot.
If this host goes offline, healthy switches behind it can all stop producing readings at once. That makes collector placement an availability decision, not just a convenient place to install software.
There's also inventory work to budget: this implementation doesn't scan subnets or receive SNMP traps. Operators add each device explicitly rather than expecting discovery or unsolicited notifications to fill coverage gaps.
Count the poller as a server with its own monitoring.
Comparing Visibility and Access Requirements
Visibility separates local collection from management-protocol polling. A local agent can inspect processes, services and disks, and supported modules can summarize selected journald units. SNMP retrieves the object identifiers the device exposes; an interface counter doesn't automatically provide process-level context, filesystem diagnostics or application error detail. The network device monitoring guide helps establish which device signals belong in that layer.
Access determines what can be collected. An agent needs installation rights and appropriate runtime permissions, while SNMP needs a target address, compatible version, credentials and a permitted polling path. The IETF's SNMPv3 User-based Security Model defines message-level security procedures, but those protections don't remove credential rotation, device configuration or network access requirements. SNMP v2c sends its community string without encryption, so it shouldn't be treated as equivalent to a securely configured SNMPv3 deployment.
Grant access to signals, not whole systems
The open-source agent can be audited, improved or forked for custom builds. That transparency helps an operator review collection behavior, but it doesn't make every permission appropriate or eliminate the need to manage updates.
| Access decision | Local agent | SNMP polling |
|---|---|---|
| Where permissions apply | On the monitored host | On the device and the network path from the poller |
| What to restrict | Runtime privileges and enabled modules | Read access, permitted source and available management objects |
| What to record | Installation owner, runtime account and enabled collection scope | Device address, SNMP version, credential reference and polling host |
| What to review after changes | OS compatibility and retained permissions | Device configuration, access rules and credential validity |
Linux access controls illustrate why installation alone doesn't guarantee visibility. The Linux kernel's /proc documentation describes process information exposed through the filesystem and the hidepid controls that restrict its visibility. A collector running with limited privileges may legitimately see less than an administrator's interactive session.
Firewall design deserves its own review rather than improvised exceptions during onboarding. The guide to monitoring internal services without opening firewall ports covers those shared security basics.
This guide doesn't treat WinRM or SSH polling as a supported collection path for the product, because its documented scope here doesn't establish them. Generic protocol capabilities aren't evidence that a particular platform implements them.
Use SNMPv3 with authentication and privacy (authPriv) when encryption is required. Selecting version 3 alone does not guarantee encryption: authNoPriv authenticates without encrypting, while noAuthNoPriv supplies neither. Match the device and collector settings, restrict polling to the intended source, and record the credential reference without copying the secret into tickets.
Failure Modes and the Blind Spots Each Model Hides
One stopped process can silence an entire site's monitoring. When the host that runs your SNMP polling goes down, every switch, router and firewall it reaches goes quiet at once, even though none of those devices runs an agent and none of them has failed. The failure domain is the polling host, and it is the piece most agentless comparisons skip.
A blocked management path, a stopped agent or an overloaded poller produces the same broad symptom as a shared credential change: readings stop from appliances that are otherwise healthy. Agentless collection does not remove that risk, because the operator still owns the credentials, the access rules and the collector doing the work. Collection also deserves deliberate scoping. Every check runs somewhere and consumes resources somewhere, so wider instrumentation is never free because it required no install.
Diagnose by shared dependency
The following checks are read-only. Likely causes are starting hypotheses, not confirmed diagnoses, and any corrective configuration change requires operator approval.
Symptom, likely cause and first check
| Symptom | Likely cause | First check |
|---|---|---|
| One device silent while others on the same poller report | Wrong SNMP version, address or credential | Compare the device entry with the device's SNMP configuration |
| Every device on one poller silent | Poller host offline, agent stopped or path blocked | Check the polling host: agent status, outbound HTTPS and SNMP reachability |
| Host marked offline, external HTTPS check passes | Collector stopped reporting; the endpoint may also be served by a load balancer or another host | Check agent freshness and identify which backend answered the external check |
| External check fails, server agent reports healthy | DNS, firewall or network path between users and service | Run DNS and TCP checks from outside and compare with host readings |
| Proxmox guest shows running, application unreachable | Guest power state says nothing about application health | Probe the application separately |
| Journald errors missing for a service | Unit not in the allowlist | Confirm the unit is selected in journald monitoring |
When several switches at a site stop reporting together, first investigate their shared collector, network path and power dependencies. Because each device was added to a single polling host explicitly, that host is the shared dependency: inspect its agent, its outbound connection and its SNMP path before touching hardware that may still be forwarding traffic normally. Restarting switches because the dashboard went quiet is how a blind spot becomes a real outage.
Missing data needs its own interpretation
A stale reading is not a healthy reading, and an empty error summary is not proof that no errors occurred. Operators need to separate a genuine zero from an absent observation.
- Fresh data: Interpret the measured value against the service's operating baseline.
- Stale data: Investigate collection health before drawing conclusions about the target.
- Unsupported signal: Record the coverage gap explicitly and select another source if it matters.
- Restricted signal: Review permissions or scope without automatically broadening access.
External checks establish the service symptom. Host and device readings supply evidence for the cause.
A successful check has its own boundary. An external HTTPS response confirms that a request received an acceptable answer from that location; it says nothing about the dependencies or user workflows behind it.
Alert recovery should require fresh evidence rather than the disappearance of a notification. After a collector interruption, confirm the affected devices resume reporting and that independent checks agree with the restored view. The recovery signal is fresh data arriving on schedule, not the absence of red on the dashboard.
Operating Cost and Scale Across a Mixed Estate
Agent operation repeats per host; polling operation repeats per device and per collector. Neither model removes administration, and a license quote won't capture the work of maintaining access, validating upgrades and diagnosing collection gaps.
The 2022 Redfish-Nagios paper archived by the NSF reports up to 2% CPU and about 17.5 MB memory for a particular Go/LIKWID agent sampling power and energy every second. Separately, its Redfish monitoring server ran 2,802 checks across 467 nodes every two minutes, averaging about 69% CPU, 3.04 GB memory and 2.13 Mbps bandwidth. Those workloads, signals and intervals differ: this is not a like-for-like agent-versus-agentless benchmark, an SNMP sizing guide or a measurement of Fivenines. The useful lesson is to measure both endpoint overhead and collector demand in your own pilot.
Recurring work belongs in the operating plan
For agent-managed hosts:
- Upgrade management: Validate compatibility before expanding an agent update across client systems.
- Permission review: Retain only the rights needed by enabled collection modules.
- Rebuild coverage: Reinstall and verify reporting after replacement, reimaging or an OS change.
- Resource review: Observe collector resource use alongside the production workload.
The agent security documentation describes user-level installation. That can help meet a restricted deployment model, but available visibility still follows the runtime account's permissions.
For polled devices:
- Credential rotation: Update the device and monitoring configuration through an approved process.
- Device-entry audits: Remove retired equipment and reconcile addresses against the client inventory.
- Access-rule review: Confirm the intended poller remains permitted after network changes.
- Collector capacity: Review resource use, polling completion and response delays before adding targets.
Polling interval, device response time and metrics per device all affect collector demand. A successful small pilot doesn't establish unlimited capacity, particularly when an unreachable device or slow management interface changes the poller's workload.
Count resources before comparing plans
The monitoring cost guide provides broader budgeting context. For this platform, each added server monitor, uptime check, task or network device counts once against the plan's monitor limit.
Proxmox VMs and LXC containers discovered through the Proxmox API are included with the node running the agent and don't count as separate monitors. That distinction matters when translating an infrastructure inventory into a commercial estimate.
For example, one polling host + three other server agents + two network devices + two uptime checks + one cron task = nine monitors. Count a polling host only once if it is already in the server inventory. Guests discovered through the Proxmox integration do not add separate monitors; installing a separate agent inside a guest adds a server monitor. Confirm current allowances and notification channels on the pricing page before purchase.
One-Site Pilot Checklist Before You Roll Out
A useful pilot proves collection, failure interpretation and alert delivery without interrupting client production. It also records the work another engineer will need to repeat.
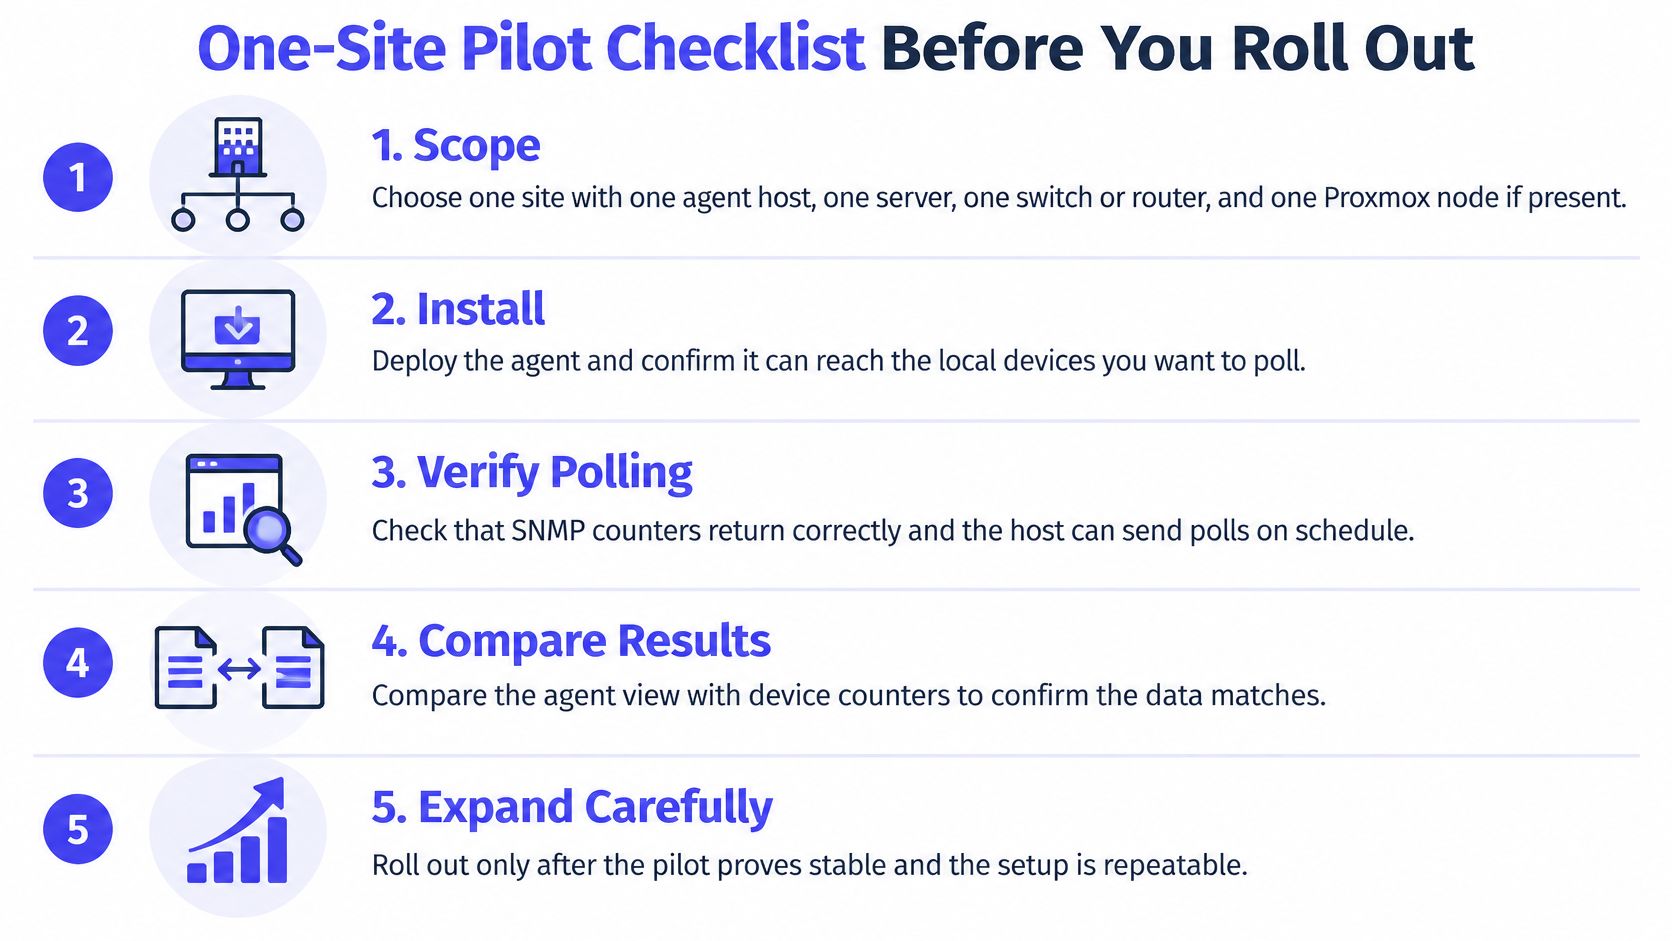
The checklist visual provides a rollout reminder; the detailed steps below identify permissions, verification and rollback.
Pilot execution
Scope and baseline, read-only. Select a site, an agent host, a representative server, a switch or router, a Proxmox node if present, and an external check. Record the owner, supported OS and device firmware, expected signals and existing configuration. This prevents a successful interface graph from being mistaken for complete site coverage.
Prerequisites, read-only. From the intended poller, confirm the route and permitted SNMP path to the appliance; record its address, SNMP version, credential reference and applicable firewall rules. Confirm approved installation permissions, outbound HTTPS access and the required net-snmp tools. These checks separate an access problem from an installation problem.
Install and register, state-changing. Install the agent on the poller and representative server using the current setup documentation, then enable polling and add the device explicitly. Installation supports a shell command per server or deployment through Ansible and existing configuration management; copy the current installer from the setup workflow rather than an old runbook. Record every changed setting so another operator can reverse it.
Verify collection, read-only. From the poller, query a known object such as numeric OID
1.3.6.1.2.1.1.3.0, orsysUpTime.0, using the recorded SNMP version and approved credentials. A valid reply establishes that this object was accessible through that path; a timeout leaves routing, access rules, credentials and device configuration as candidates. Compare interface readings with the device's own counters over matching observation periods, confirm fresh results within the documented polling interval, and check external reachability separately.Test alerting, state-changing. Use a non-production resource to produce a safe alert condition, then confirm delivery through a channel available on the selected plan. Record the actual trigger and recovery conditions, and how collection failure is represented. For example, the SNMP Device Unreachable template uses three consecutive failed polls; do not assume every monitor type uses the same evaluation rule. Restore the resource and verify recovery rather than stopping at notification receipt.
Acceptance and rollback
Keep credentials out of command arguments, shell history and copied tickets. Retrieve secrets from an approved credential store through the tool's supported secure mechanism, without printing them into diagnostic output.
The site describes a short agent installation and a 60-second default host collection interval. A collection interval is not a guarantee that setup and the first dashboard update finish within that time. SNMP device cadence also depends on the polling host's agent cycle and device response time. Record actual setup time, last-success timestamps and missing signals.
- Accept: Fresh host and device readings, an independently verified endpoint and a delivered alert with confirmed recovery.
- Investigate: Missing expected data or unexplained disagreement between collection sources.
- Record unsupported coverage: Signals the implementation doesn't provide, never a healthy status.
- Roll back, state-changing: Remove the test device entry, stop the agent on the test host and reverse only the configuration changes recorded for the pilot.
The monitoring onboarding guide can support the handover checklist. Expansion should follow a repeatable setup with named ownership, not merely a dashboard containing graphs.
Choose Your Collection Mix for the Next Site
Mostly servers, with some network equipment: Use local agents for host diagnosis, an agent host for appliance polling and external checks for public services. Keep each signal tied to a specific operational question.
Many switches and firewalls, few servers: Treat the collector as critical infrastructure. Place it on a deliberately managed host and make its health the first investigation point when the site's device readings disappear together.
Proxmox-heavy infrastructure: Use cluster visibility to understand quorum, nodes, guests and storage. Add application probes where a client's service commitment extends beyond virtualization state.
Restricted installations or inbound access: Outbound collection can accommodate an inbound restriction, but a prohibition on every agent installation rules out this local-agent polling model. External checks can still establish reachability; process-level visibility remains a gap to disclose before committing.
The product boundary also matters: no subnet discovery, SNMP traps, SNMP v1, or device CPU, memory and temperature charts. The agent is open-source, but the dashboard, storage and alerting backend are hosted SaaS and can't currently be self-hosted.
The appropriate next step is a network device monitoring pilot using an agent host and a device. Verify useful readings, confirm the collector dependency and deliver a safe test alert before expanding.
Fivenines combines production server metrics, explicitly configured SNMP device monitoring and external checks in a hosted observability platform. Visit Fivenines to start with a suitable host and device, validate the readings and test alert delivery before committing the next client site.