How to Manage Network Performance: Baselines to Alerts

A high-impact outage carried a median cost of $2 million per hour in 2025, according to New Relic's survey of 1,700 IT and engineering leaders. The expensive part of that hour usually isn't the repair. It's the twenty minutes spent arguing about whether the fault sits on your switch, your provider's transit, or a DNS resolver nobody owns.
Dashboards full of device metrics can't settle that argument. What settles it is a measured baseline, percentile thresholds instead of averages, and probes running from several places at once so a failure has a location before it has an owner. Get those three things right and you can manage network performance as a repeatable process rather than a series of fire drills.
Table of Contents
- Core Metrics and Starting Thresholds to Track
- How to Build a Baseline in Five Steps
- Separating Local From External Faults and Alerting on Them
- Troubleshooting Playbook for Common Symptoms
- Planning Capacity From Baseline Trends
- Provider Escalation and Customer Status Decisions
Core Metrics and Starting Thresholds to Track
Seven metrics cover the production networks in common use. Treat the thresholds below as starting points and tune each one after two weeks of your own data, because a number copied from a vendor document is a guess about someone else's network.
| Metric | What it measures | Starting threshold | Why it matters |
|---|---|---|---|
| Round-trip latency (p95) | Time for a packet to reach a target and return | Alert when p95 stays above baseline plus a fixed margin for 10 minutes | The mean hides bursts users feel |
| Jitter | Variation in delay between packets | Set per application; keep it low for voice and video | Breaks real-time traffic even when latency looks fine |
| Packet loss | Share of packets not delivered | Alert above 1% sustained over 5 minutes | Loss bursts cause retransmits and timeouts |
| Availability | Share of scheduled time a service is reachable | Alert when the rolling 30-day figure drops below 99.9%, roughly 43 minutes of allowed downtime | Time-based, so it reflects real user impact |
| DNS response time | Time to resolve a name against each resolver | Alert when p95 doubles against baseline | Slow DNS looks like a slow application |
| Interface utilization | Share of link capacity in use | Warn at 70% of capacity; page only alongside a latency breach | Saturation drives queuing delay |
| Throughput | Achieved transfer rate for bulk flows | Compare against contracted or measured capacity | Shows whether a link delivers what it is paid for |
Availability is a clock, not a counter
99.9% sounds like near perfection until you convert it. Over a 30-day month it allows about 43 minutes of unreachable time, which is the budget you're spending. Track availability as the fraction of scheduled service time during which users can reach the service, not as a tally of successful probes, because ten thousand green checks say nothing about the four minutes when nobody could log in.
The mean is the least useful number on the row
A path can report a mean latency of 40 ms and still feel broken. If its p95 is 150 ms, one request in twenty waits nearly four times longer than the average suggests, and that's the request the customer remembers. Report minimum, median, p95, p99 and maximum together so the spread stays visible.
Thresholds also have to survive geography. ITU data-collection guidance reports expected mobile-network latency of roughly 100 to 300 milliseconds in countries relying mainly on 3G, compared with approximately 20 to 50 milliseconds in countries where 4G/LTE predominates. One absolute number applied to every region will either page constantly about the slower one or never notice when the fast one degrades. Compare each path against its own history.
If the vocabulary is unfamiliar, this guide to network health covers how availability, throughput and error rates fit together. Start with three metrics tied to user experience: availability, p95 latency and packet loss. Add DNS timing and utilization once the first baseline has held for a month.
One check tells you the table is earning its place: if p95 latency climbs while the mean stays flat, you've caught a problem the average was hiding.
How to Build a Baseline in Five Steps
A baseline is a record of what normal looked like, kept in a form you can compare against six months later. ITU-T Recommendation Y.1545.1, published in 2017, sets out a monitoring framework that goes well beyond a single average-speed figure: it recommends measuring IP activation success and timing, DNS response time, round-trip delay, one-way delay variation, packet loss, service availability, and achieved download and upload rates, reporting each as minimum, maximum, mean, median, variance and percentile values, and including peak traffic periods when congestion is most likely to affect users (ITU-T Y.1545.1).
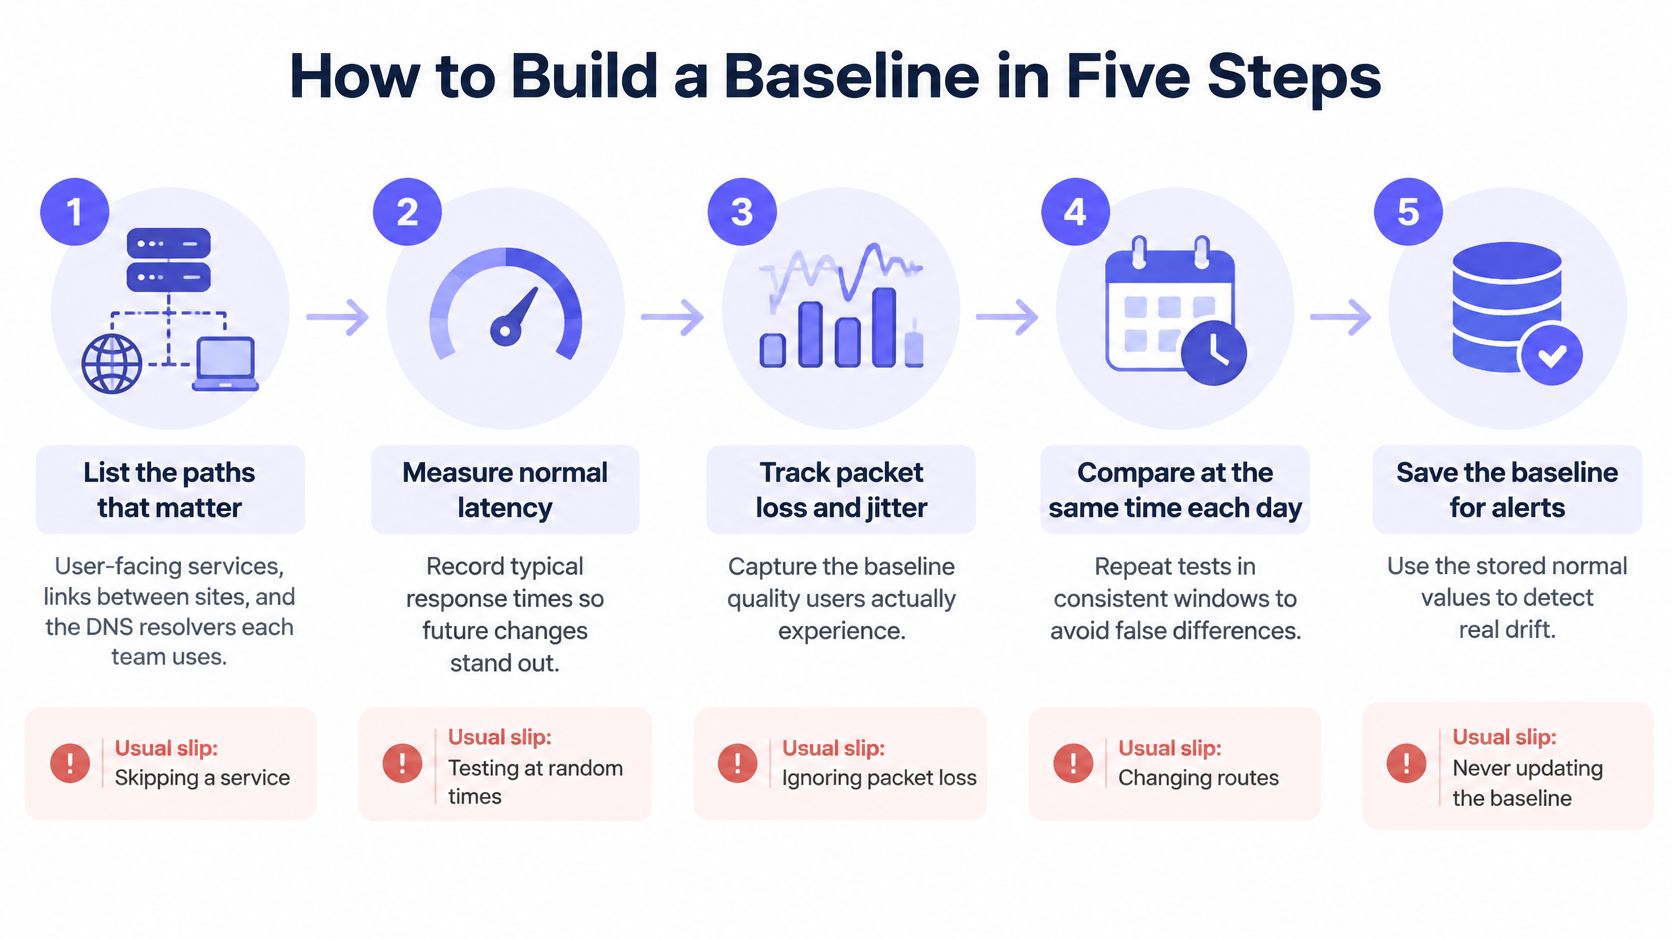
List the paths that matter. A baseline of the wrong paths is worthless, so start with user-facing services, the links between sites, and every DNS resolver your teams query. Write the list down. It becomes the scope of everything that follows.
Probe on a fixed interval from fixed vantage points. Sixty seconds is the practical default for both synthetic checks and SNMP polling. The usual slip is comparing measurements taken from different places: a check that runs through a VPN one week and a direct path the next is measuring two different networks.
Collect at least 14 days, including a full business peak window. Off-peak data hides exactly the congestion users complain about. The slip here is starting on a holiday week and recording a quiet network as normal.
Summarize each path statistically and by hour of day. Calculate minimum, median, mean, p95, p99 and maximum per path, then split those figures into hourly buckets. A percentile calculated across three collectors in three time zones means nothing until you check clock sync, because a few seconds of skew distorts the tail.
Write the threshold down as a rule. Something like: alert when p95 stays above baseline plus a fixed margin for 10 minutes. A rule that fires on a single sample will fire during every nightly backup.
Healthy baseline: a daily p95 band that repeats within a tight range, a written list of known spikes such as backups and month-end batch jobs, and thresholds that respond to ten minutes of drift rather than one bad packet.
Keep that spike list next to the baseline. When the on-call engineer sees a 02:00 latency climb, the list should already explain it.
Separating Local From External Faults and Alerting on Them
A probe can show that a service is failing. Comparing probes from different locations with device telemetry helps identify where the fault sits: inside your network, on an external path, or at the service itself.
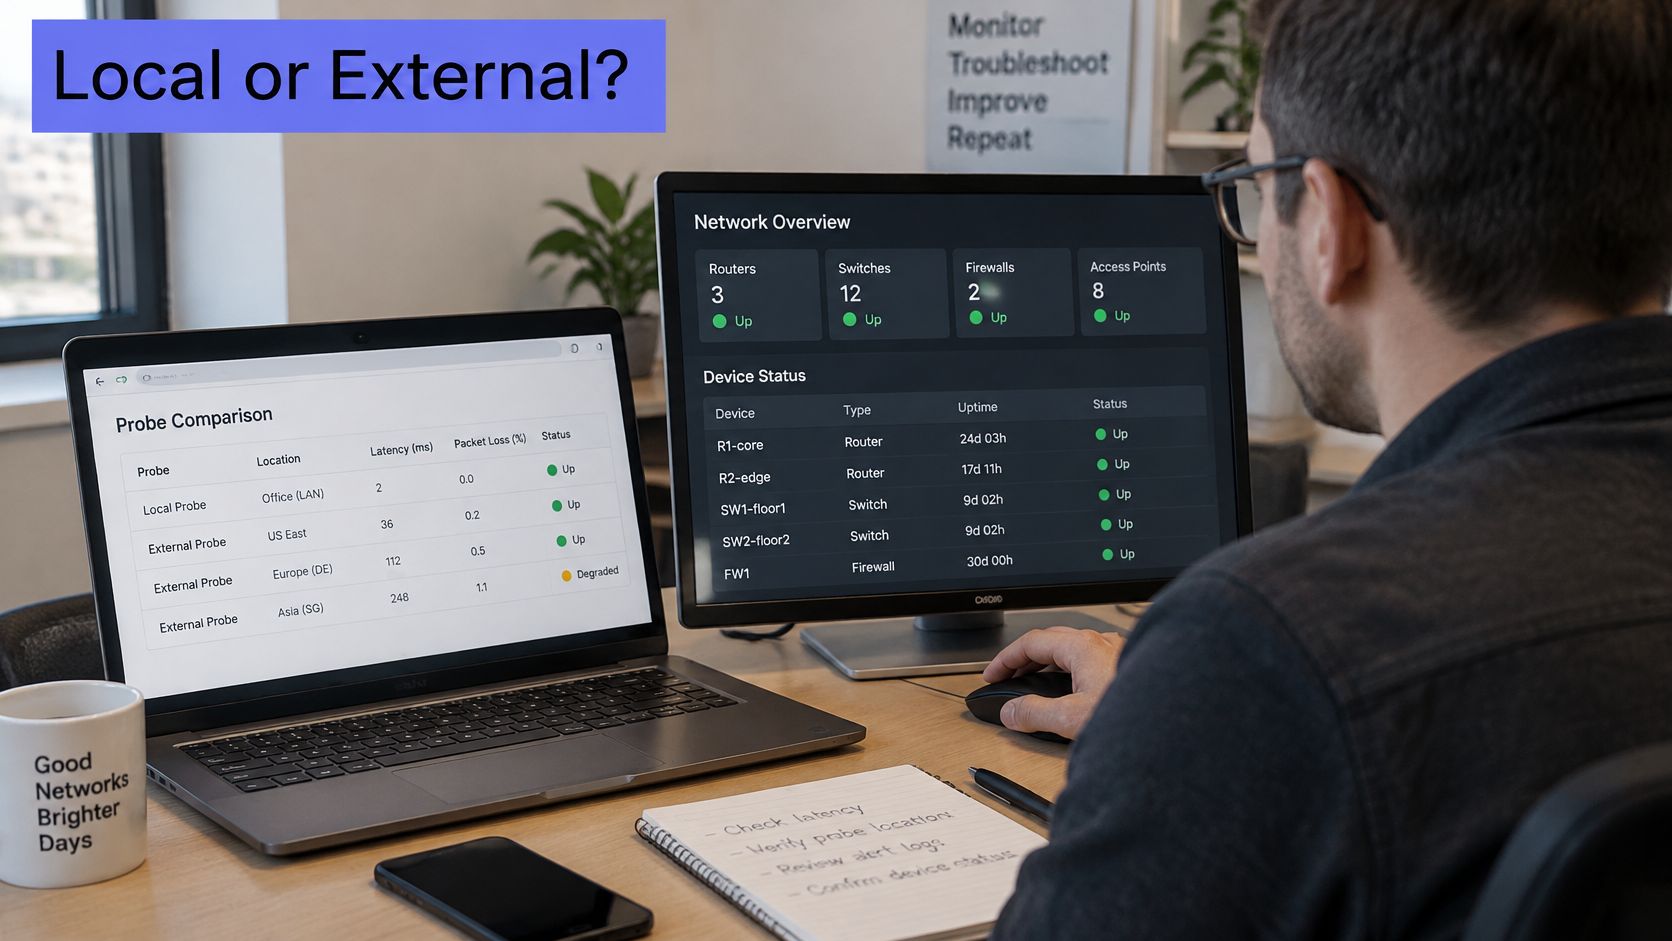
Networking and connectivity were the most frequently reported cause of IT-service outages in Uptime Institute's 2026 resiliency findings, accounting for 23% of incidents. Third-party provider failure was among the leading network-specific causes, alongside configuration and change-management failures and hardware failures, as Network World reports. Provider failures happen outside your racks, so internal telemetry alone cannot resolve them.
| Probe | What it proves | Run from | Typical use |
|---|---|---|---|
| HTTPS | Application reachable and responding | Three or more regions | Customer-facing uptime and page speed |
| TCP | Port open and handshake completes | Two or more regions | Databases, mail, custom services |
| ICMP | Host reachable, round-trip time and loss | Inside the network and outside it | Device and link reachability, confirmed with TCP if filtered |
| DNS | Resolver answers and how fast | Each region and each resolver in use | Resolution failures and slow lookups |
| SNMP interface polling | Traffic, errors and interface state | Agent host inside the network | Switches, routers and firewalls |
Compare results before paging. If one region fails while the others pass, investigate that region's path or provider. If all regions fail at once, check the origin and its dependencies before changing network equipment. If ICMP goes quiet, confirm with TCP before declaring a host down; some networks filter ICMP by policy.
In 2026 research summarized by Enterprise Management Associates, 31% of respondents said their network teams were completely successful at monitoring and managing networks, down from 42% in 2024. While 64.3% called deep packet inspection important or very important to observability, just 9.7% were using it, according to NetScout's summary of the EMA research. Collecting more signals does not resolve an incident by itself. Choose the least invasive probe that can distinguish an internal fault from an external one.
- Page: An HTTPS p95 breach confirmed from two regions across three consecutive checks.
- Open a ticket: Interface saturation sustained for half an hour without a latency breach.
- Log only: A single probe blip that the next check clears.
- Suppress: Dependent alerts when an upstream router fails, so one fault produces one incident.
Alert on what users feel, and investigate with what the network knows.
For the internal view, Fivenines Network Device Monitoring polls configured switches, routers and firewalls over SNMP v2c or v3 for interface traffic, errors and reachability. Each device must be added with its SNMP settings and credentials, using an agent host that can reach it. Pair this device-side polling with active and passive monitoring to compare observed network conditions with direct service checks.
Troubleshooting Playbook for Common Symptoms
Match the symptom to a row before opening a terminal. Most incidents announce themselves in one of six shapes.
| Symptom | Likely cause | First check |
|---|---|---|
| Slow for users in one region | Regional path or ISP | Compare probes from other regions |
| Timeouts from every region | Application or backend | Server load and connection counts |
| Intermittent packet loss on one link | Bad cable, duplex mismatch or failing port | Interface error counters over time |
| Latency rises only at peak hours | Link saturation | Utilization trend for the peak window |
| Slow name resolution | Slow resolver or its upstream | DNS probe against each resolver |
| Sudden drop after a change | Configuration change | Change log and rollback candidate |
Work the rows in order of frequency. A single degraded region is almost always that region's path, so check the other vantage points before you touch anything. Timeouts from everywhere point at the application or its backend, which means server load and connection counts come before packet captures. Intermittent loss on one link usually traces to physical causes: a failing cable, a duplex mismatch, or a port accumulating CRC errors, all of which interface polling records over time.
Latency that climbs only during business hours is saturation, so pull the utilization trend for that exact window. A sudden drop that follows a deployment belongs to the change log first.
A Berlin office reporting slow SaaS tools looks like a provider problem until probes from Frankfurt and Singapore come back clean and the Berlin check shows 8% packet loss. That single figure moves the fault onto the office link and saves an hour of provider tickets.
The first fifteen minutes
- Confirm the symptom with a fresh probe from the reporting region, so you're not debugging a cached complaint.
- Establish scope by comparing every region, which separates a path problem from an application one.
- Decide the owner before you escalate: an internal fix, a carrier ticket, or a status page update.
That order takes a few minutes and tells you which side of the boundary the fault sits on.
Planning Capacity From Baseline Trends
Capacity work is arithmetic on data you already collect, not forecasting. Export weekly p95 utilization for each important link, because the average masks the peaks that cause queuing. Calculate week-over-week growth, project the month when p95 crosses 70%, and schedule the upgrade with enough lead time for procurement and a change window. Then recheck monthly, since one new service can bend the slope.
A worked example makes it concrete. Say a 1 Gbps uplink sits at a p95 of 540 Mbps and grows 8% a month. The 70% line is 700 Mbps, and 540 growing at 8% reaches it in about 3.4 months. That puts the upgrade request in next quarter's plan rather than in the middle of an incident.
Keep the definitions honest with version control. Store monitor definitions and alert thresholds as code, review them each quarter against the latest baseline, and link every alert to its runbook so the person on call starts with the right probe. Route confirmed alerts into the on-call tool through a webhook, and include the probe name, region, threshold and runbook link in the message. Trend analysis over a few weeks of stored history is what turns those numbers into a date on the calendar.
Provider Escalation and Customer Status Decisions
Once the evidence points outside your infrastructure, the ticket itself decides how fast the fault gets fixed. Providers act on timestamps and failing checks, not on adjectives.
- Export the evidence package. Probe results for the affected region with timestamps, the failing check type (HTTPS, TCP or DNS), and the matching internal metrics showing your devices healthy.
- Open the ticket with that package and name the affected path plus the first failing hop if a traceroute was captured.
- Check shared dependencies. If other services or customers on the same provider show the same failure, you know whether this is one supplier or several before you write a word.
- Update the status page when user-facing probes fail in two or more regions for longer than your communication threshold, stating the region, the service, and that the cause is under investigation with a provider.
- Record both timestamps, when the provider confirmed the fault and when probes recovered, so the post-incident review shows the actual duration.
For MSPs and hosting providers, that record is the difference between "our outage" and "our supplier's outage", and customers ask for it. A written incident escalation process keeps the steps identical whether the person on call is a senior engineer or a solo operator covering a weekend.
The next step is small and this week: run the baseline procedure on your three most important paths, keep the results, and review your alert rules once you have two weeks of data.
Fivenines puts uptime checks and SNMP polling in one place, running HTTPS, TCP, ICMP and DNS probes from multiple regions with failure confirmation before anything pages, alongside interface traffic and error counters from your switches, routers and firewalls. It suits teams that want the baseline, the probe comparison and the alert routing in a single dashboard instead of three stitched-together tools. Start with your three most important paths and see what two weeks of data tells you at Fivenines.