Best System Monitoring Software for Small Teams (2026)

A three-person production team runs Linux hosts, a Proxmox cluster, several switches, and public APIs. The buying decision isn't only which dashboard looks clearest. It's which monitoring layers the team should buy, which it can maintain itself, and which gaps could leave an outage undetected.
There's no universal best system monitoring software. Netdata suits detailed host troubleshooting; Checkmk and PRTG deserve attention for network-heavy estates; Datadog and Grafana Cloud fit broader observability requirements. A hosted infrastructure platform can make more sense when the team needs server, VM, network, uptime, and scheduled-job coverage without maintaining another backend.
Fivenines publishes this roundup and is one of the vendors compared. The evaluation scope is consistent: server and VM metrics, SNMP devices, external availability checks, scheduled jobs, alerting, deployment effort, and billing basis. The scenario-based selection matrix and reproducible pilot checklist below help distinguish documented coverage from assumptions. For shared fundamentals, the system health monitoring guide explains the basics without turning this comparison into another introductory monitoring guide.
Table of Contents
- 1. Fivenines
- 2. Netdata
- 3. Checkmk
- 4. Site24x7
- 5. Paessler PRTG
- 6. Datadog
- 7. Grafana Cloud
- Tool comparison for small production teams
- Match the Tool to Your Coverage Gaps, Then Pilot One Host
1. Fivenines
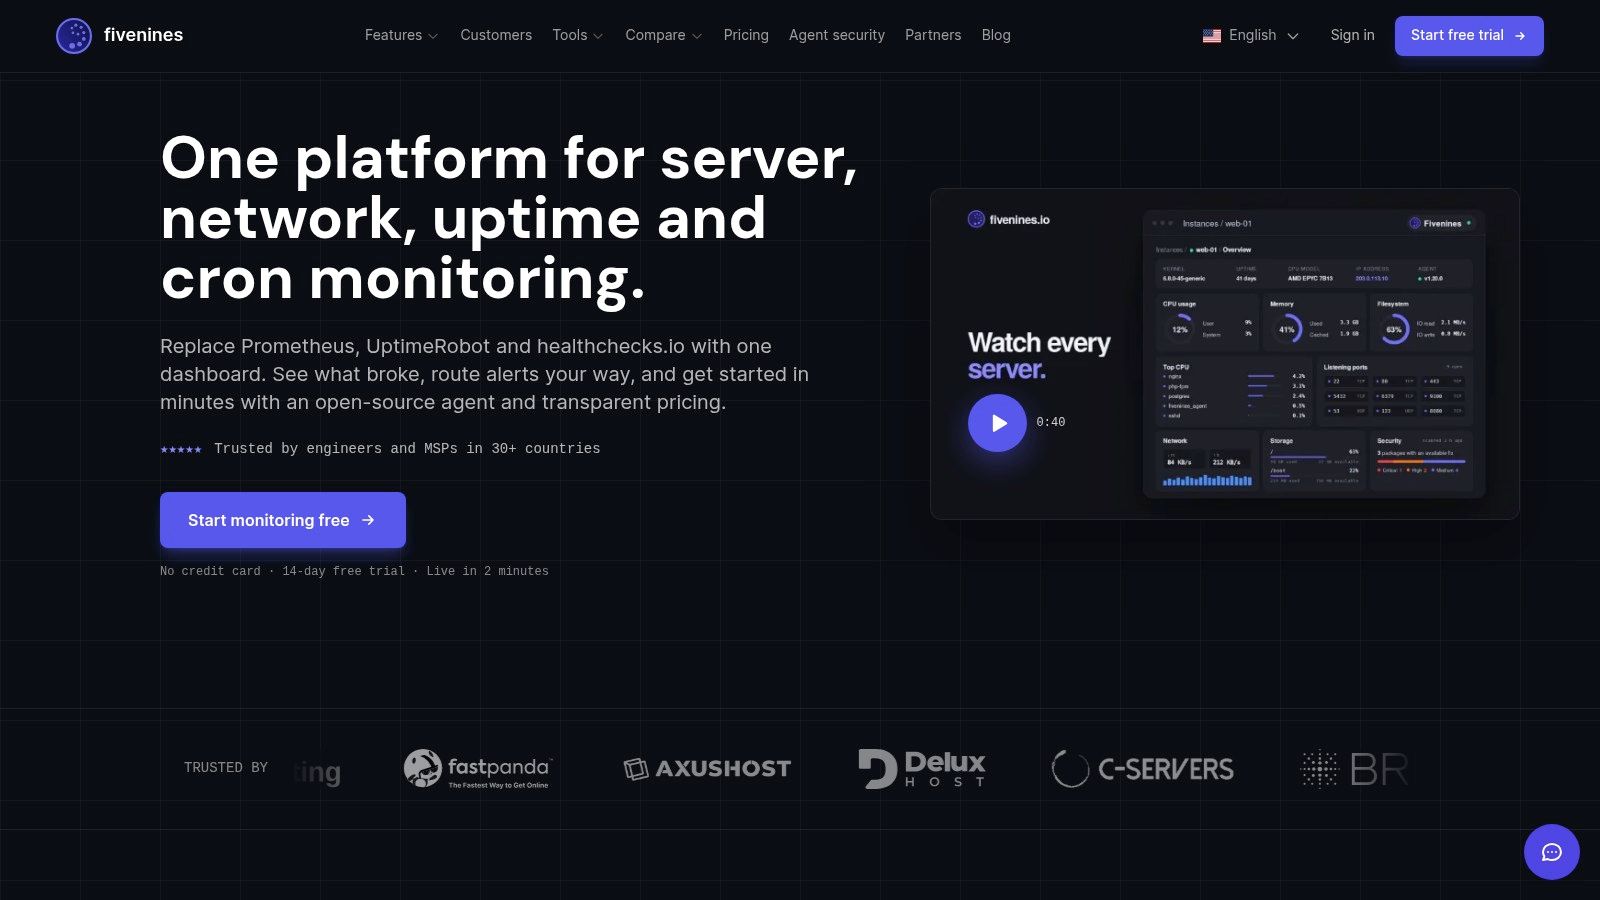
Best fit: small teams consolidating production infrastructure monitoring rather than building an observability backend. The hosted platform combines Linux and Windows server metrics with Proxmox, container, NVIDIA GPU, network-device, uptime, and scheduled-job monitoring.
Its open-source agent sends telemetry over outbound HTTPS. Operators enable optional modules with scoped access, rather than granting every integration unrestricted credentials. Proxmox visibility includes cluster, node, VM/LXC, and storage health, but a running guest doesn't establish application availability or successful backup restoration.
Where the Coverage Stops
Network monitoring polls explicitly configured SNMP v2c/v3 devices through a local agent host with separately installed net-snmp tools. It covers interface traffic, errors, reachability, and alerts. It doesn't discover devices by scanning subnets, receive SNMP traps, or chart device CPU, memory, and temperature.
- External checks: HTTPS, TCP, ICMP, and DNS checks cover reachability and response-time signals independently of host metrics.
- Scheduled work: Cron monitoring detects missed or failed work that a healthy server dashboard wouldn't expose.
- Incident handling: Workflows, notification channels, and status pages support response and communication, with availability depending on the plan.
- Automation: A REST API, Terraform provider, and MCP server support operational integration.
The main trade-off is SaaS-only operation. The open-source agent doesn't make the dashboard, storage, or alerting backend self-hostable. Selected-unit journald summaries provide incident context, not full log ingestion, indexing, or search; the platform also isn't full APM, distributed tracing, remote access, or patch management.
For an MSP already using an RMM, this is a complementary monitoring layer rather than a replacement. Teams requiring self-hosting should shortlist Checkmk instead, while application teams needing request-level diagnosis should consider Datadog or Grafana Cloud.
2. Netdata
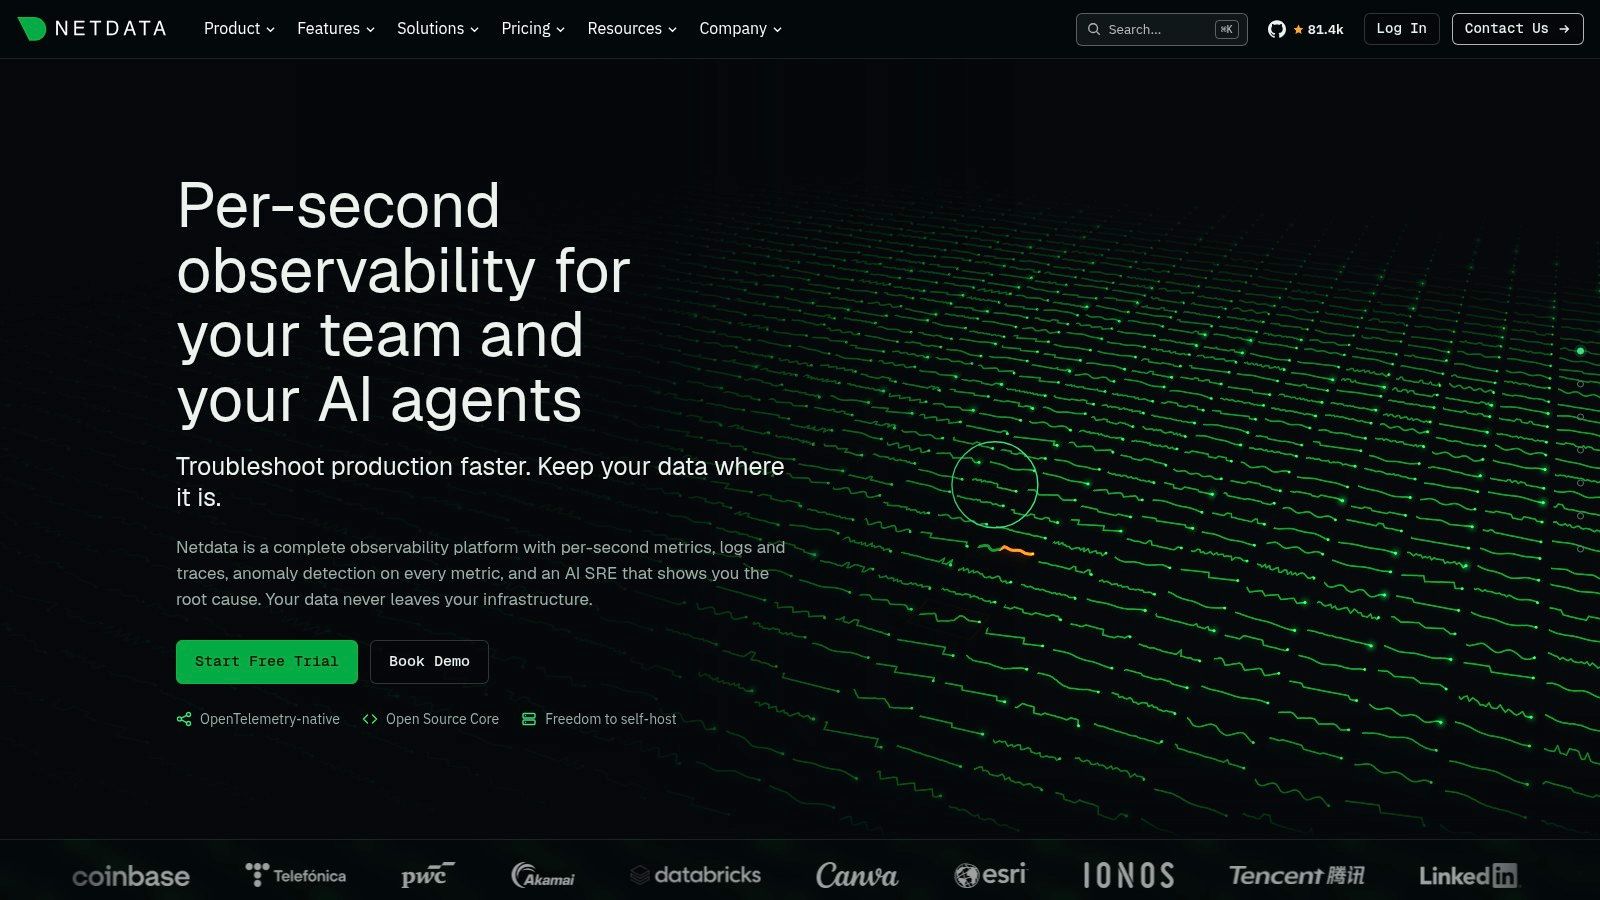
A Linux host can look healthy in an averaged chart while users experience intermittent stalls. Netdata is a strong shortlist candidate when detailed host behavior matters more than broad operational consolidation.
Netdata combines an open-source Agent with Cloud fleet views, dashboards, and alerts. Its infrastructure coverage includes servers, VMs, containers, and Kubernetes, making it relevant when operators need to investigate resource behavior across related workloads.
The practical attraction is the emphasis on high-resolution infrastructure metrics. During evaluation, operators should inspect whether charts expose the CPU, disk, memory, and network behavior needed to explain their actual workloads, rather than counting available dashboards.
Detailed host telemetry and complete service coverage are different requirements. Neither should be accepted as a substitute for the other.
Prefer It for Host Diagnosis
Netdata deserves particular consideration for Linux-heavy teams that want fast access to detailed host metrics. Its Agent also gives teams an entry point that doesn't require committing immediately to a broad application-observability platform.
The trade-off is that a dense interface can require deliberate dashboard selection and alert tuning. Teams should establish which views belong in an incident runbook and which are useful only during deeper investigation.
Billing is node-oriented, but the evaluation should also identify separately packaged capabilities and current plan conditions. External uptime, network-device monitoring, and missed-job detection should each receive their own acceptance test; an integration listing alone doesn't establish equivalent behavior across those layers.
For a team whose primary problem is explaining short-lived host contention, Netdata may fit better than a platform optimized around consolidated infrastructure workflows.
3. Checkmk
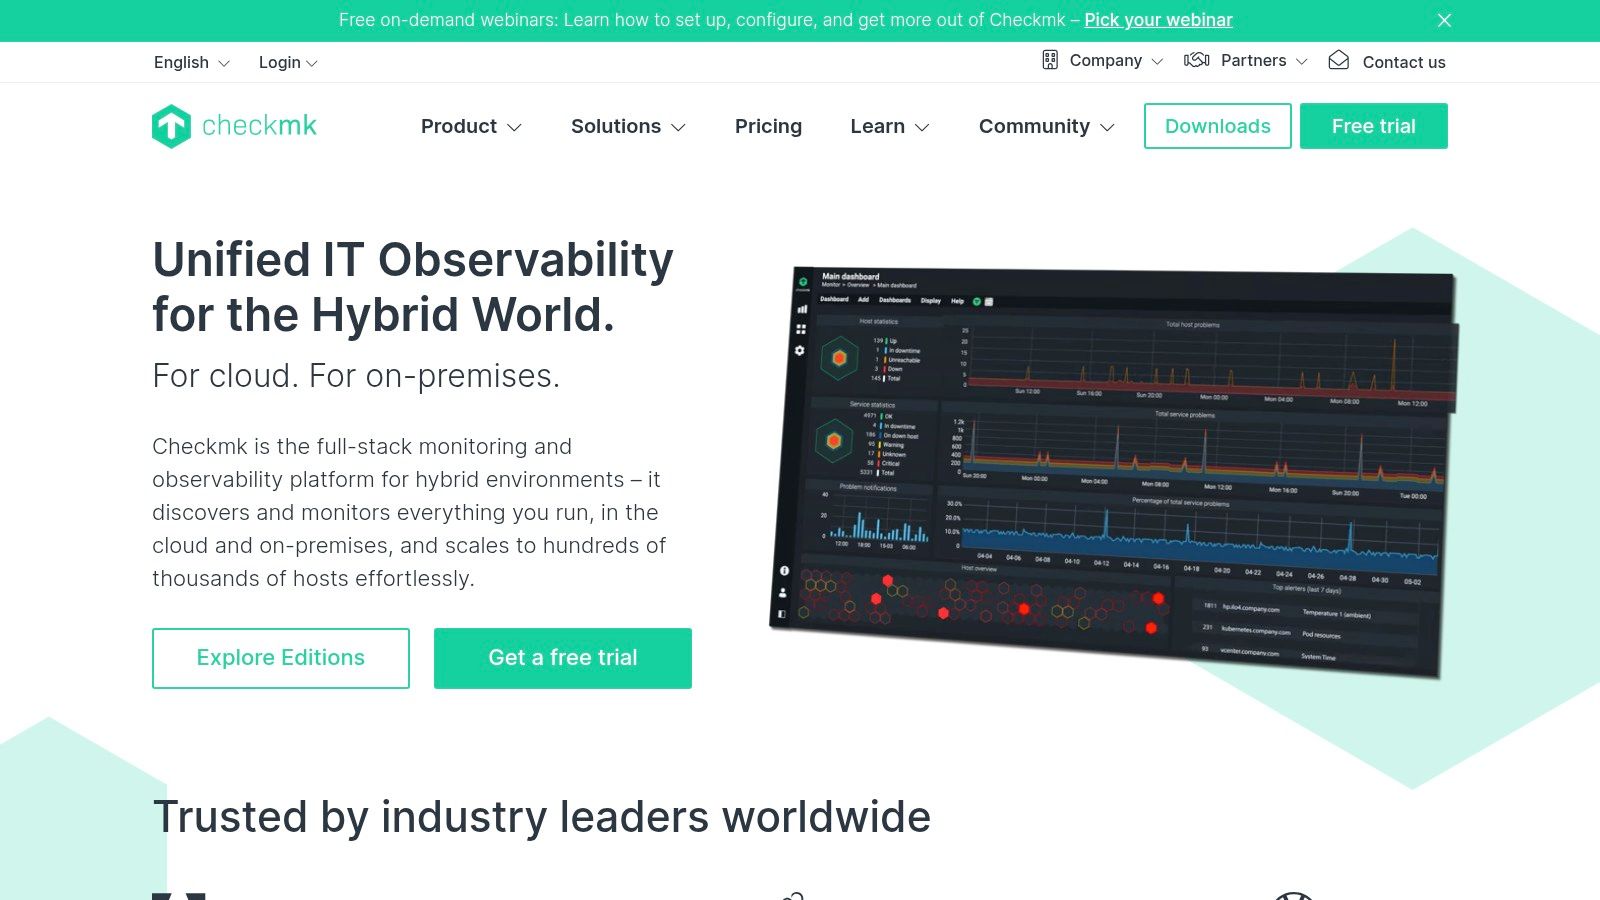
Self-hosting changes the shortlist. A team that must control the monitoring server, storage location, and upgrade schedule should evaluate Checkmk before treating hosted infrastructure platforms as interchangeable.
Checkmk combines agent-based infrastructure monitoring with SNMP coverage and offers both self-hosted and cloud deployment options. Its edition choices, including multi-tenancy options, make it relevant to MSPs that need more than a shared dashboard with customer names attached.
Count Services, Not Just Hosts
Checkmk's service-based billing requires a different estimate from host-based pricing. A server can contribute multiple monitored services, while a switch can contribute checks across interfaces and device components.
- Deployment control: Self-hosting provides operational control, but the team owns the monitoring system's availability, upgrades, backups, and capacity.
- Mixed infrastructure: Agent and SNMP monitoring suit estates containing servers, switches, and other infrastructure.
- Tenant requirements: MSPs should validate edition-specific customer separation, permissions, reporting, and notification behavior.
- Migration planning: Cloud and self-hosted editions shouldn't be assumed to have identical operating models or migration paths.
The server monitoring and alerting tools guide provides related context for separating collection coverage from incident-response requirements.
Checkmk fits teams willing to maintain monitoring infrastructure in exchange for deployment control and broad infrastructure coverage. It's less attractive when nobody can own backend maintenance.
A useful pilot should include both an agent-monitored server and an SNMP device. That exposes configuration effort and service-count growth more accurately than a server-only demonstration.
4. Site24x7
For a SaaS team, the decisive question may be whether customers can reach an API, not whether its VM is running. Site24x7 belongs on the shortlist when external availability and server monitoring need to sit together.
Site24x7 offers hosted monitoring across servers, websites, applications, and network components. Server monitoring uses agents on supported operating systems, including Windows and Linux, while website monitoring addresses the outside-in view.
Those signals should remain distinct during evaluation. A successful host heartbeat doesn't prove that DNS resolves correctly, TLS succeeds, or the public application returns the expected response.
Acceptance rule: An external check should validate the service boundary customers depend on, not merely an easy endpoint that stays healthy during application failures.
Evaluate the Included Allowances
Site24x7's packaged plans and add-ons require a coverage inventory before a meaningful cost comparison. Teams should identify which server monitors, website checks, network components, and application capabilities belong in the intended package.
Agent deployment can be automated, but automation doesn't remove ongoing agent ownership. Operators still need a process for credentials, upgrades, collection failures, and host retirement.
The website uptime monitoring software comparison helps distinguish uptime-focused requirements from broader infrastructure coverage.
This is a reasonable candidate when a small team wants hosted server and external availability monitoring under one vendor. A team needing only a narrow public-endpoint check may not need the broader suite, while one needing deep network investigation should compare PRTG directly.
5. Paessler PRTG
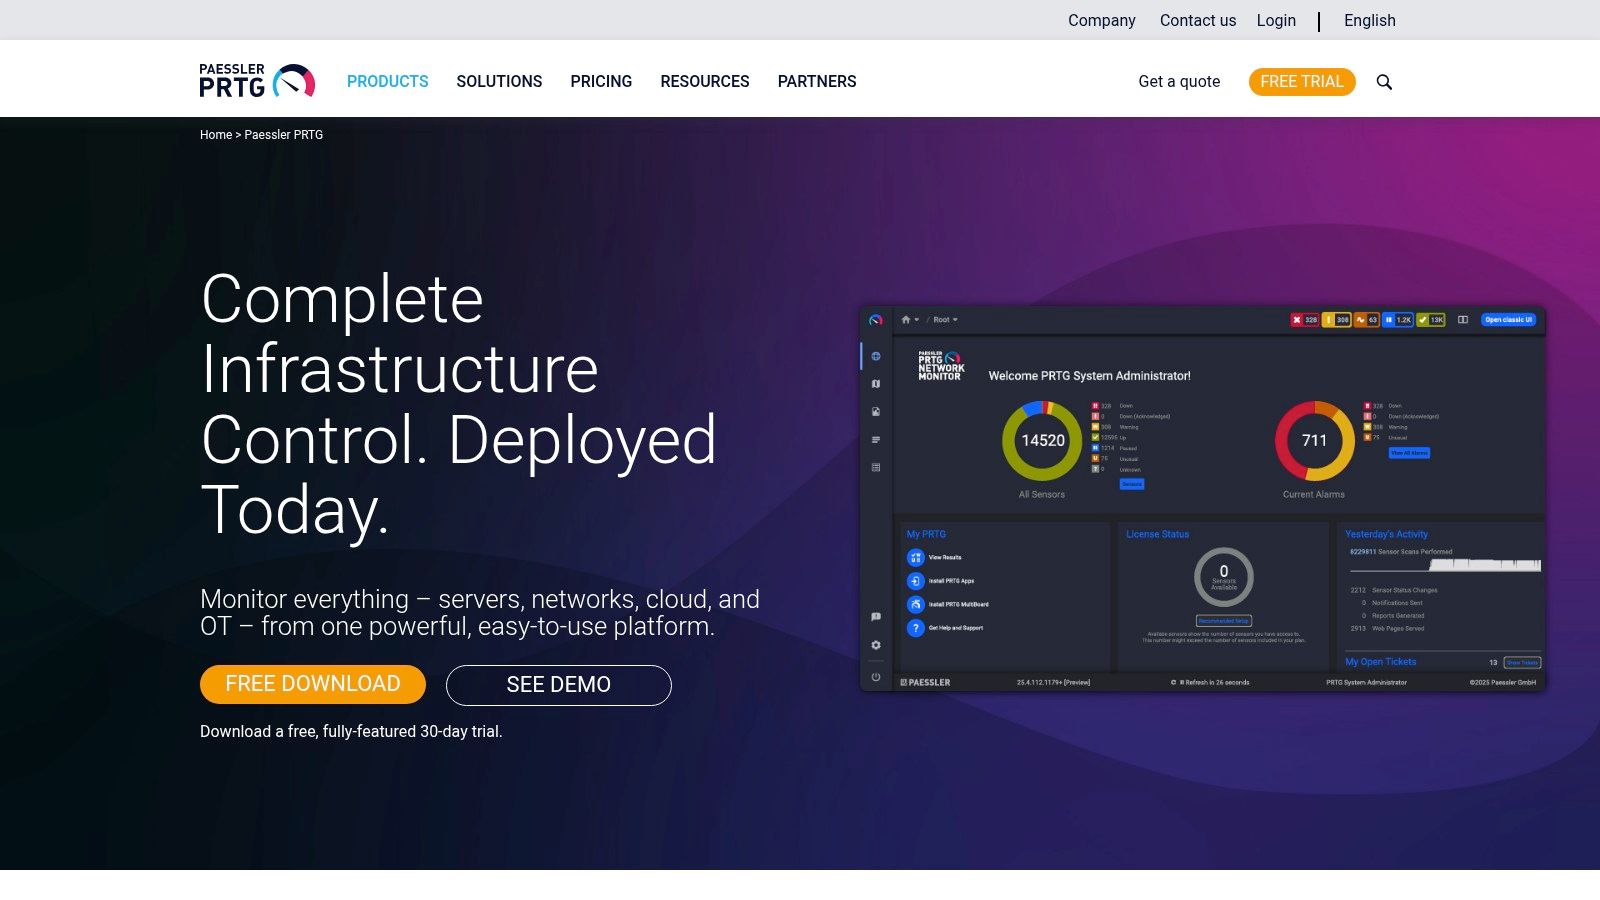
A network-heavy MSP needs more than a host agent and a reachability badge. PRTG is the stronger candidate when interface behavior, distributed sites, and flow visibility drive the monitoring requirement.
Paessler PRTG organizes monitoring around sensors, each representing an individual check or measurement. That model supports detailed device monitoring, but it also changes capacity planning: counting switches isn't enough.
PRTG offers self-managed Network Monitor and a hosted option. Its monitoring methods include SNMP, ICMP, WMI, and flow protocols, with remote probes supporting distributed environments.
Model a Representative Device
Before comparing subscriptions, operators should configure the checks a typical switch or server needs. Interface traffic, availability, hardware state, and application checks can consume separate monitoring capacity.
- Strength: Network-oriented collection and distributed probes suit multi-site IT operations.
- Maintenance: The self-managed Network Monitor core runs on Windows, which matters for Linux-first teams.
- Cost planning: Sensor capacity must reflect the intended checks, not merely device inventory.
- Boundary: Network breadth doesn't make the product a full application-tracing suite.
The SNMP and MIB guide explains the protocol concepts relevant to device polling and interpreting available measurements.
PRTG is an honest alternative when basic SNMP interface polling won't meet the requirement. Teams should validate device-specific sensors and probe placement before committing, especially where management networks are segmented.
For a small estate needing only server metrics, uptime checks, and basic network reachability, its network depth may introduce more configuration than the team needs.
6. Datadog
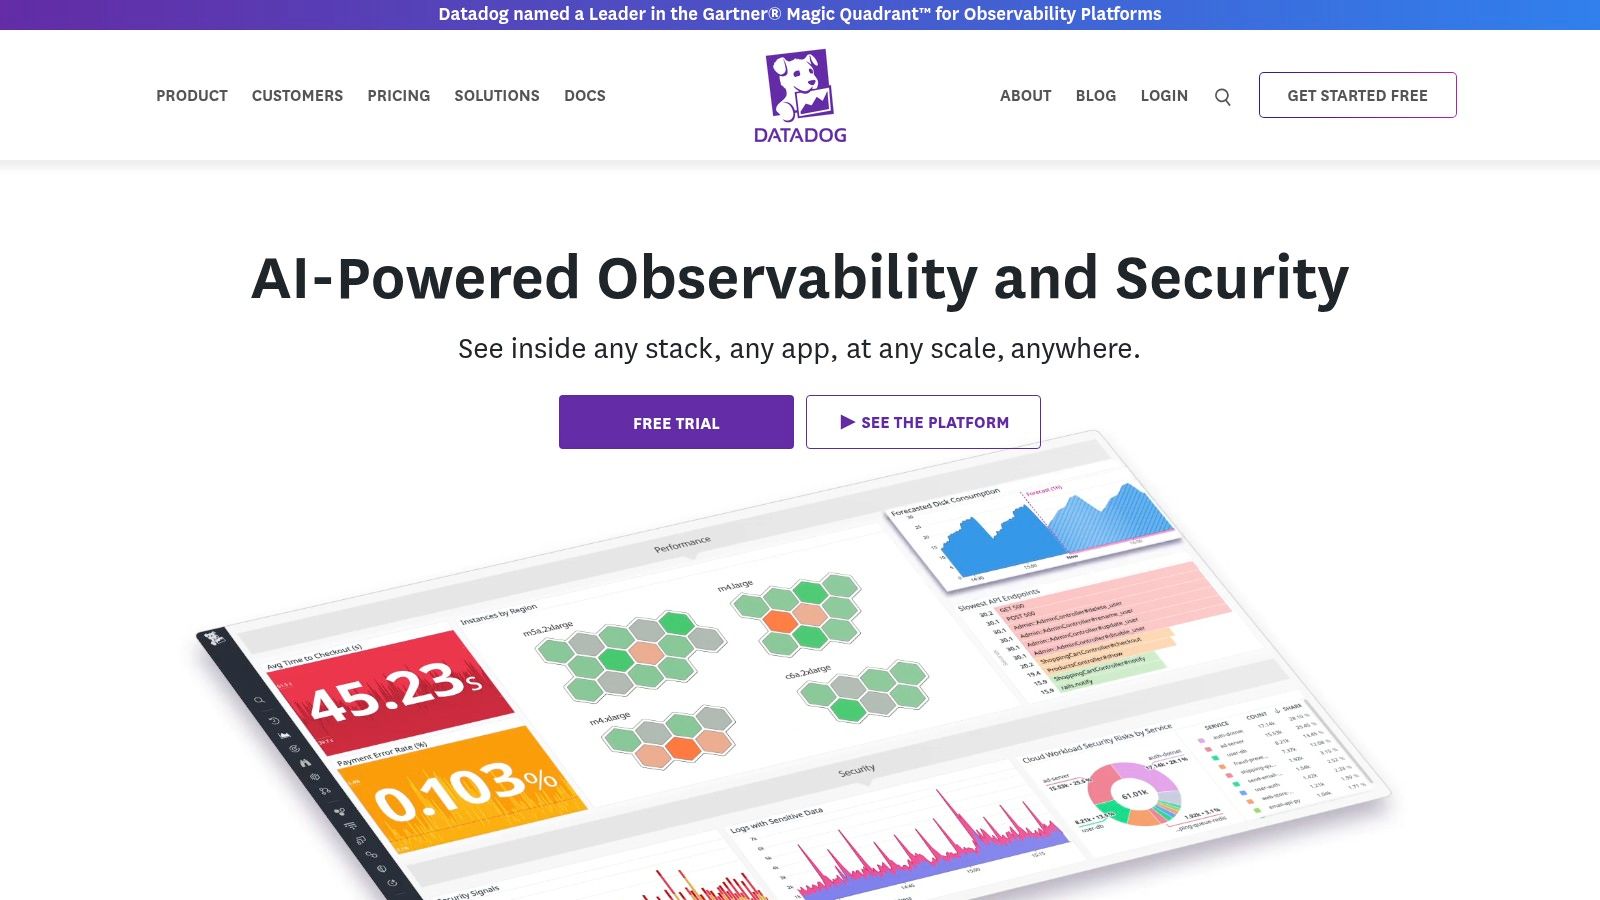
Datadog fits when the incident crosses from infrastructure into application execution. If operators need to connect a slow endpoint with service behavior, logs, and request traces, a server-only comparison understates the requirement.
Datadog combines infrastructure monitoring with separately scoped capabilities for applications, logs, networks, containers, and security. Its SaaS model suits teams that want a broad observability backend without operating that backend themselves.
The advantage is shared investigation context across telemetry types. The limitation is that useful correlation still depends on correct instrumentation, identifiers, tagging, and collection configuration.
Buy the Required Products, Not the Category
OpenTelemetry distinguishes metrics, logs, and traces as different signals in its observability primer. A host dashboard therefore shouldn't be treated as evidence that searchable logs or request tracing are included.
Datadog's modular billing makes that distinction commercially important. Infrastructure hosts are only part of the estimate; enabled products and usage can introduce additional meters.
- Good fit: Cloud or hybrid teams that need application and infrastructure investigation together.
- Potential excess: Small teams seeking only host health, public availability, and missed-job alerts.
- Pilot requirement: Instrument a representative service path and record which products the investigation requires.
A broad platform can be justified even for a small team when application diagnosis is central to the on-call workload. It's harder to justify when most of its instrumentation and analytical capabilities would remain unused.
7. Grafana Cloud
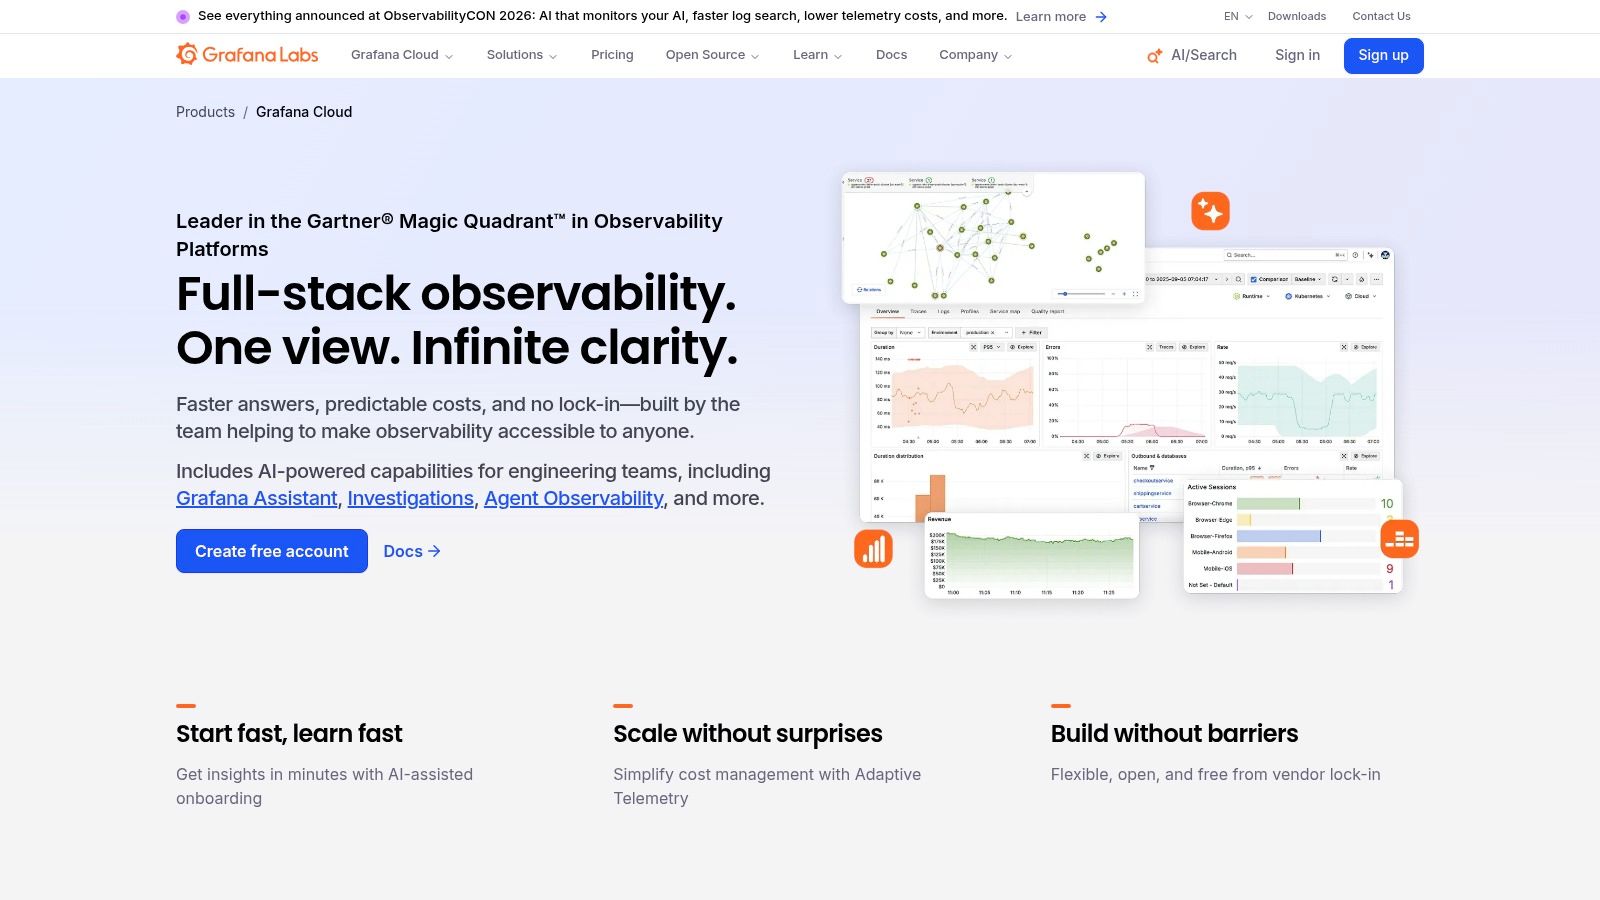
An observability-mature team may already have exporters, OpenTelemetry instrumentation, and established dashboard conventions. Grafana Cloud is a natural candidate when preserving that collection ecosystem matters more than adopting a narrowly packaged infrastructure workflow.
Grafana Cloud provides managed metrics, logs, traces, dashboards, and alerting, alongside services such as synthetic testing and Kubernetes monitoring. Its appeal is flexibility without requiring the team to operate every backend component.
That flexibility still leaves engineering work. Operators must choose collectors and integrations, maintain useful labels, establish dashboards, and decide which signals justify storage and alerting.
A managed backend removes backend maintenance. It doesn't remove responsibility for telemetry design.
Prefer It When Standards Already Matter
In Grafana's global observability survey, 71% of respondents' organizations used both Prometheus and OpenTelemetry in some capacity. For an already instrumented team, interoperability can be a more useful buying criterion than a long feature checklist.
Grafana Cloud's usage-oriented economics require teams to estimate telemetry volume and enabled services rather than counting hosts alone. A pilot should inspect label growth, collection frequency, retention requirements, and dashboard maintenance effort.
The unified observability platform guide provides related context for deciding whether consolidation should include application telemetry or remain infrastructure-focused.
Grafana Cloud can fit better than a turnkey infrastructure platform when engineers already understand their telemetry pipeline and need logs or traces alongside metrics. It's less compelling when a small operations team primarily wants predefined server, device, uptime, and job workflows with minimal configuration.
Tool comparison for small production teams
For a small team, the decisive columns are coverage scope and pricing basis: the first decides whether the tool fills your gap, the second decides how the bill grows. Under per-monitor billing, each server, uptime check, cron task, SNMP device, and MQTT topic counts toward the plan limit. Sensor-count and per-node models scale with how much hardware you poll, while usage-based platforms scale with telemetry volume instead.
| Tool | Best for | Coverage scope | Deployment model | Pricing basis | Free option |
|---|---|---|---|---|---|
| Fivenines (publisher) | MSPs, hosting providers, and DevOps/SRE teams | Server metrics, containers, Proxmox, GPUs, SNMP network devices, uptime, and cron jobs | Hosted SaaS with an open-source agent | Per-monitor self-serve plans | Free trial |
| Netdata | Teams needing high-resolution, near-real-time host metrics | Servers, VMs, containers, Kubernetes metrics, and alerts | Open-source agent with optional Netdata Cloud | Per node for paid infrastructure plans | Community plan |
| Checkmk | Teams needing broad infrastructure coverage or self-hosting | Servers, network devices, SNMP, and other infrastructure | Self-hosted editions or Checkmk Cloud | Monitored service count | Free Community edition |
| Site24x7 | Teams wanting hosted server and website monitoring together | Servers, websites, applications, and network components | Hosted service with monitoring agents | Tiered infrastructure subscriptions | Free uptime monitoring tier |
| Paessler PRTG | Network and IT operations teams monitoring devices and sites | Infrastructure, SNMP, flow data, and availability checks | Self-managed or hosted | Sensor capacity | Free edition with limited sensor count |
| Datadog | Cloud and hybrid teams seeking broad observability | Infrastructure, containers, applications, logs, networks, and security | SaaS platform | Host-based infrastructure pricing plus usage and other products | Free trial for evaluation |
| Grafana Cloud | Teams building a managed metrics, logs, and traces setup | Metrics, logs, traces, dashboards, alerts, and synthetic testing | Managed cloud platform | Usage-based paid plans | Always-free tier |
Match the Tool to Your Coverage Gaps, Then Pilot One Host
The best shortlist follows the missing coverage layer. The following scenario-based selection matrix is hypothetical, not a benchmark or ranking.
- Proxmox-heavy MSP: The publisher's hosted platform fits consolidated server, VM, uptime, and job coverage. Checkmk fits better when self-hosting and edition-specific multi-tenancy are decisive.
- Linux troubleshooting team: Netdata deserves priority when detailed, high-resolution host investigation dominates.
- Mixed SNMP network shop: PRTG fits deeper device and flow requirements; Checkmk suits broad infrastructure monitoring with deployment control.
- SaaS team needing external checks: Site24x7 suits combined website and server monitoring. The publisher's platform also fits infrastructure, uptime, and scheduled-job requirements.
- Observability-mature platform team: Datadog or Grafana Cloud fits full application, log, and trace requirements better than an infrastructure-focused product.
Reproducible Evaluation Checklist
Prerequisites: A representative noncritical host, an authorized monitoring installer, a test notification destination, and permission to read required metrics. Device and application credentials should be read-only where supported.
- Define coverage: Record required host, VM, SNMP, external-check, and job signals. Mark each as supported, unsupported, or unknown until validated.
- Verify deployment: Record agent versus agentless collection, execution location, required permissions, outbound connectivity, supported operating-system versions, and probe dependencies.
- Inspect expected signals: Compare timestamps, host identity, units, and service state with local read-only observations. Treat missing data as collection failure, not healthy operation.
- Test one safe alert: Use a dedicated test check or temporary rule, not a production outage. Record trigger, sustained evaluation window, routing, acknowledgement, and recovery; restore the original configuration afterward.
- Check economics and limits: Use current pricing pages to record billing basis, retention, required modules, plan restrictions, and maintenance ownership. Save results without inventing scores.
Fivenines is the publisher, and its platform remains SaaS-only, not full APM or a searchable log archive. Its no-credit-card trial lasts 14 days, according to the Linux Server Monitoring feature page. A suitable next step is a one-host pilot, useful readings reviewed for a week, and a safely tested alert before commitment.
Fivenines brings production server metrics, explicitly configured SNMP devices, uptime checks, and scheduled-job monitoring into one hosted platform. Teams comparing these coverage layers can visit Fivenines, connect an appropriate host or check, and validate readings and alert recovery before choosing a plan.