10 DevOps Monitoring Best Practices for 2026

Reliable monitoring doesn't begin with a larger dashboard. It begins with trustworthy detection. Collecting more CPU, memory, logs, traces, and application metrics can improve diagnosis, but it won't help if the monitoring system misses a customer-visible failure, pages the wrong team, or becomes too expensive and noisy to maintain.
The strongest DevOps monitoring best practices connect four operational questions: can customers use the service, can the team confirm the failure, can the right person act, and can the organization preserve enough context to recover? Google's SRE guidance treats monitoring as a foundation of production operations, with emphasis on meaningful service behavior, service-level indicators, service-level objectives, and evidence-based incident response. Google's practical alerting guidance supports alerting on symptoms and actionable objectives rather than every low-level event.
The ten practices below follow that reliability path, from independent failure detection through unified telemetry, secure collection, workload-specific visibility, automation, communication, and cost control. Teams migrating from Prometheus and Grafana shouldn't compare platforms by dashboard count alone. Signal quality, migration effort, security boundaries, alert ownership, retention, and total operating cost need to be evaluated together.
Table of Contents
- 1. Implement Multi-Region Uptime Monitoring with Failure Confirmation
- 2. Unify Metrics Collection Across Infrastructure Layers
- 3. Use Agent-Based Collection with a Push-Over-Pull Architecture
- 4. Design Alert Routing and Escalation Around Actionability
- 5. Monitor Containers and Orchestration-Native Workloads
- 6. Manage Monitoring as Code
- 7. Monitor Cron Jobs and Scheduled Tasks
- 8. Automate Status Pages and Customer Communication
- 9. Monitor GPUs, Networks, and Specialty Hardware
- 10. Choose Transparent Pricing and Predictable Cost Controls
- 10-Point DevOps Monitoring Comparison
- Turn Monitoring Principles into an Operating System
1. Implement Multi-Region Uptime Monitoring with Failure Confirmation
Internal metrics can look healthy while customers fail to load a site, reach an API, complete a login flow, or connect to a payment provider. External uptime monitoring supplies that missing perspective by testing the service from outside the infrastructure. A single probe, however, can mistake a temporary route problem or regional network interruption for a global outage.
Multi-region checks make the detection decision more credible. Probes should run from locations that reflect the actual user base, then require confirmation from more than one vantage point before paging. Failure confirmation reduces false positives without hiding a genuine incident, especially when a CDN, DNS provider, or upstream payment service behaves differently by region.
A practical rollout can follow this sequence:
- Choose representative regions: Place probes near major customer populations and important infrastructure dependencies.
- Use different probe types: HTTPS checks validate user-facing endpoints, TCP checks test service reachability, and ICMP checks help assess basic infrastructure availability.
- Confirm repeated failure: Require consecutive failures before paging, while allowing a lower-severity notification for an isolated probe failure.
- Track regional baselines: Compare latency by region instead of applying one global expectation to every network path.
- Test the checker itself: A monitoring outage mustn't look like a service outage or create a silent blind spot.
Practical rule: Page on confirmed customer impact, not on the first unexplained probe result.
For teams evaluating external checks during an AWS migration or consolidation, AWS site monitoring guidance provides a useful implementation reference. Fivenines combines HTTPS, TCP, ICMP, and DNS checks with regional confirmation, but a separate uptime service can still make sense when an organization needs a narrowly focused external probe layer.
A payment API outage illustrates the value. Internal application servers may report normal CPU and memory, yet a transaction path can fail because an external gateway is unavailable. A synthetic transaction or endpoint check exposes that customer-visible failure faster than infrastructure telemetry alone.
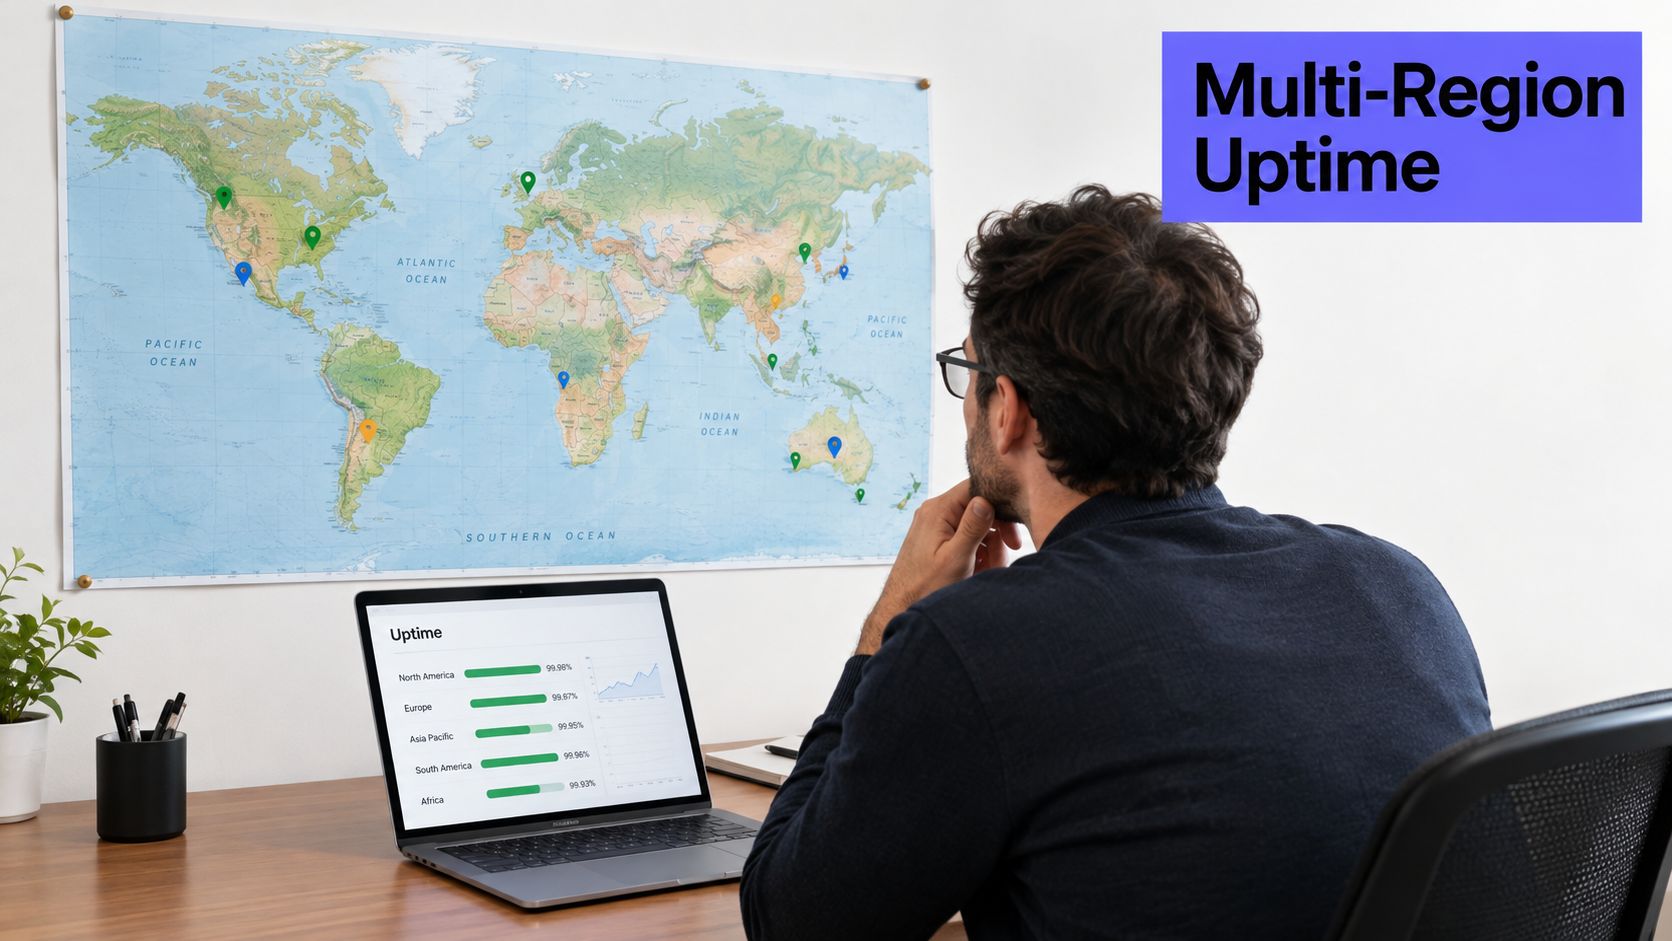
A short demonstration of multi-region uptime checks can help teams compare probe behavior, confirmation logic, and notification timing before production rollout.
2. Unify Metrics Collection Across Infrastructure Layers
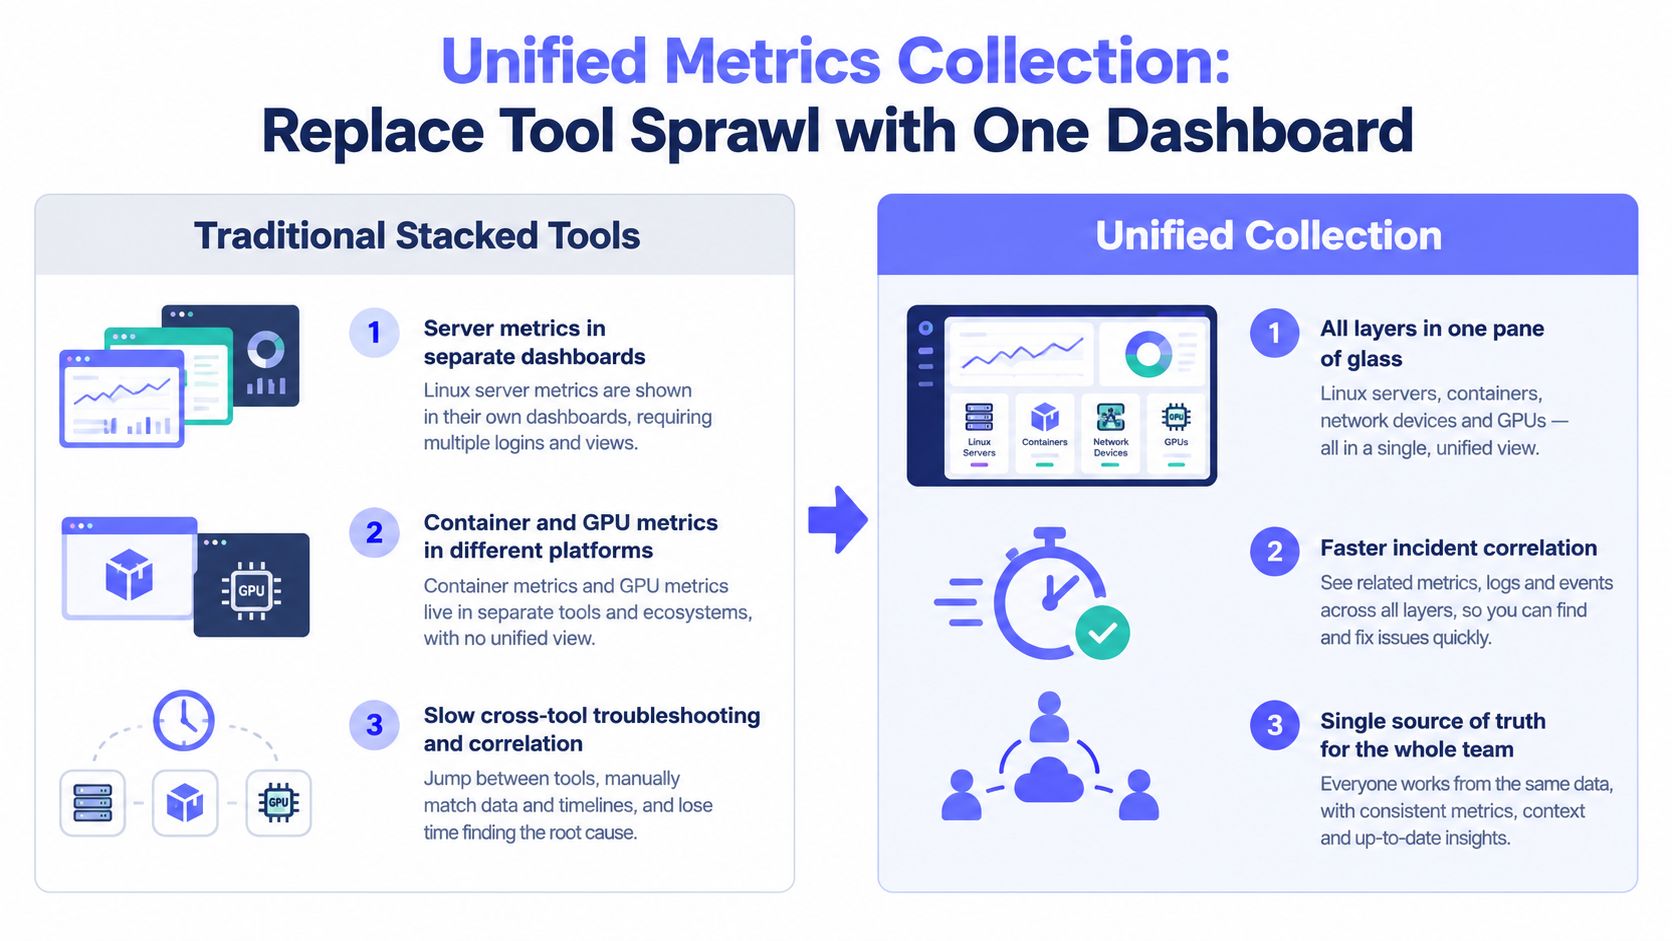
A monitoring platform becomes useful when an engineer can move from a customer-facing symptom to the responsible host, container, network path, or application process without reconstructing context across unrelated dashboards. Server metrics, hypervisor data, network interfaces, application health, and specialty hardware shouldn't live in isolated views unless there's a clear operational reason.
Centralization doesn't mean collecting every available metric. It means defining a common model for ownership, labels, naming, retention, and access before dashboards multiply. The unified observability platform guide describes the consolidation problem teams face when Prometheus, Grafana, device dashboards, and separate uptime tools each carry part of the operational picture.
Standardize before building dashboards
A migration from Prometheus and Grafana should begin with an inventory, not a visual redesign. Record each existing metric, alert, dashboard, exporter, label, retention requirement, and owner. Remove unused panels and duplicate alerts before transferring them, or the new platform will inherit the same operational debt.
The collector should be tested against representative infrastructure in staging. A hosting provider might validate Linux servers, Proxmox nodes, containers, switches, and GPU hosts before enrolling a full fleet. An MSP should also separate client data through tags, permissions, and dashboard views rather than relying on naming conventions alone.
A unified design typically includes:
- Shared identity fields: Use service, environment, team, region, host, and version consistently.
- Role-based views: Give on-call engineers detailed diagnostics while exposing service health and trends to stakeholders.
- Retention tiers: Preserve high-value history for capacity and incident analysis without keeping every raw signal indefinitely.
- Collector health: Track missing telemetry, delayed samples, and disconnected agents as first-class conditions.
Google Cloud's DORA research reported that 70% of organizations used monitoring and observability in 2023, while 84% used at least one DevOps practice, compared with 63% in 2018. The DORA figures and measurement framework reinforce monitoring's role in the delivery operating model, including deployment frequency, lead time, change failure rate, and restoration performance. Unified telemetry matters when it connects those delivery outcomes to service health, not when it merely creates another aggregation layer.
3. Use Agent-Based Collection with a Push-Over-Pull Architecture
Pull-based monitoring works well when a central collector can reliably reach every target and authenticate to every endpoint. That assumption breaks down across customer networks, private subnets, strict firewalls, cloud security groups, and isolated homelabs. Opening inbound ports or maintaining remote command paths expands the security and maintenance surface.
A lightweight agent that pushes telemetry over outbound HTTPS reverses the connection model. The monitored host initiates communication, so teams can avoid inbound firewall rules and VPN dependencies for basic collection. This architecture is especially practical for MSPs monitoring isolated customer environments or cloud workloads where security groups shouldn't expose monitoring endpoints.
The agent still needs operational safeguards. A disconnected agent can create the same blindness as a failed service, so the backend should receive heartbeats and distinguish “no data because the host is idle” from “no data because collection stopped.” Agents should use TLS, scoped credentials, configuration management, and controlled update channels.
Make the agent dependable
Container images can simplify deployment across operating-system versions, but a containerized collector still requires access to the host data it needs. Configuration belongs in Terraform, Ansible, or another infrastructure-as-code system. Exponential backoff prevents a backend outage from causing every agent to reconnect simultaneously, while local buffering can protect short interruptions if the product supports it.
A Raspberry Pi homelab offers a simple test case. Devices may sit behind a household router, yet each can securely publish CPU, disk, network, and availability data to a central endpoint. An enterprise can apply the same pattern across restricted production segments, provided certificates, credentials, and egress policies are managed deliberately.
Security boundary: Outbound HTTPS reduces exposure, but it doesn't replace least privilege, certificate validation, secret rotation, or agent integrity controls.
Push architecture isn't automatically superior. Pull remains valuable for systems that already expose well-managed Prometheus endpoints, for tightly controlled internal networks, and for teams that need collector-side discovery. A migration should preserve useful exporters where they provide unique coverage, then decide whether a unified agent or gateway can reduce the surrounding operational work.
4. Design Alert Routing and Escalation Around Actionability
A page earns its place when someone can act on it. Route each alert with the affected service, likely customer or operational impact, responsible team, runbook, and escalation rule. Without that context, accurate detection still produces delay.
Set severity from the response required, not from the monitor that generated the event. A confirmed checkout failure may page the platform or commerce team. A rising disk trend may create a ticket or asynchronous message. During business hours, Slack or Microsoft Teams may be sufficient. Critical after-hours incidents need SMS, phone, or another channel that requires acknowledgment. The policy matters more than the channel.
Workflow automation for monitoring can manage delays, retries, deduplication, acknowledgments, and escalation paths. Introduce those controls in stages. Start with a short routing tree, test it with simulated incidents, then add schedules and exceptions only when the team has evidence that they are needed. Teams migrating from Prometheus and Grafana should map existing alert labels to ownership and severity before changing notification tooling.
Measure human cost, not notification volume
The 2026 State of SRE Operations report found that 63% of surveyed teams said fewer than half of their alerts were actionable, while only 16% said more than three-quarters were actionable. Alert quality therefore belongs in reliability reviews. Adding monitors cannot fix pages for conditions that operators cannot address.
Use a policy with clear boundaries:
- Paging criteria: Reserve pages for credible user impact or imminent service risk.
- Asynchronous routing: Send diagnostic and capacity information to tickets, chat, or email.
- Ownership metadata: Include team, service, environment, runbook, and escalation details.
- Acknowledgment handling: Stop duplicate escalation after a responsible operator accepts the incident.
- Review cadence: Check repeat alerts, missed acknowledgments, escalation frequency, and false positives after incidents.
The discussion of how scanners cause burnout applies beyond security tooling. People stop trusting notifications that rarely require action. Remove noisy conditions, tune thresholds against service objectives, and review pages with the teams that receive them. A unified platform can reduce routing maintenance, but consolidation does not replace clear ownership or disciplined alert design.
5. Monitor Containers and Orchestration-Native Workloads
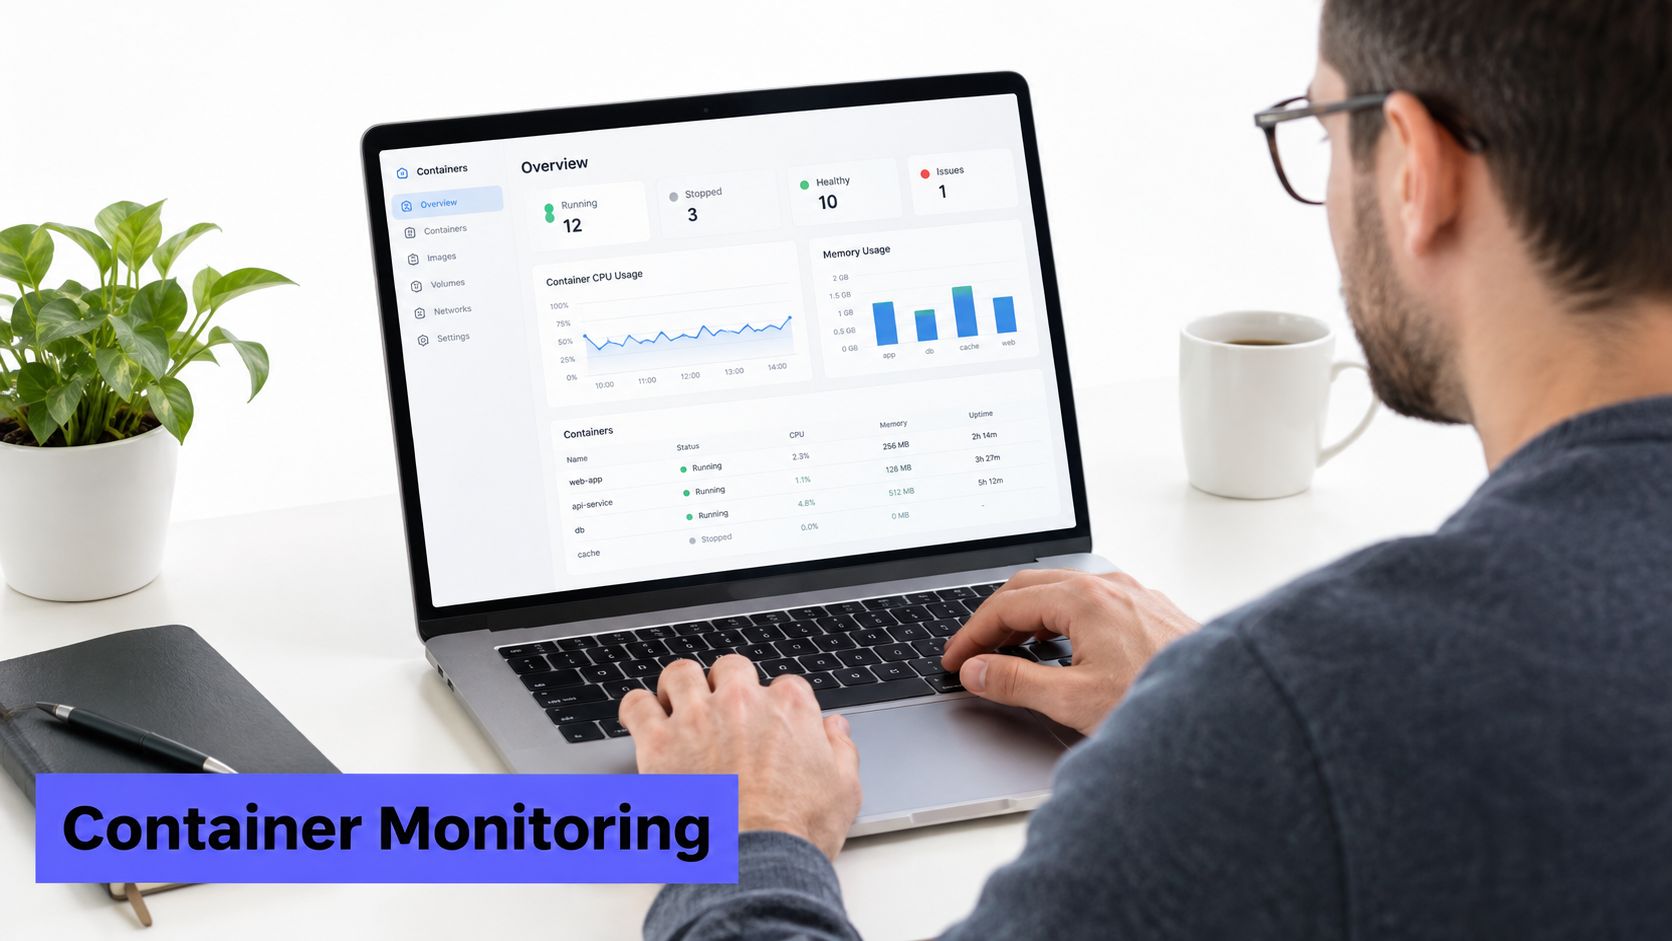
A healthy host can conceal a failing production workload. Pods may restart, hit CPU throttling, fail readiness checks, lose access to images, or compete for pressured node resources. Container monitoring must combine resource usage, workload health, identity, and orchestration events so responders can trace an application symptom to its placement and lifecycle.
Collect container CPU and memory, throttling, restarts, OOM events, readiness and liveness results, image pull failures, task placement, node pressure, and deployment changes. Attach bounded labels such as namespace, service, environment, team, version, and, where justified, customer or tenant. Avoid request IDs, session IDs, and other unbounded values that create excessive time series. OpenTelemetry adoption is growing, but production rollout remains uneven, so migrate instrumentation in stages. Define resource attributes, sampling, retention, and cardinality limits before enabling broad collection.
Correlate lifecycle events with service symptoms
Alert on relationships, not isolated utilization changes. A sustained resource limit or repeated restart should connect to a user-facing symptom, deployment event, or capacity risk. A SaaS platform can track per-tenant consumption without paging for every fluctuation. Proxmox teams need the same view across containers and hypervisor nodes, since shared host resources can cause a guest-level failure.
During a Prometheus migration, retain useful Kubernetes exporters and recording rules first. Map their labels, dashboards, and alert semantics into the consolidated platform, then remove overlapping collectors after the new views produce equivalent decisions. Verify that engineers can trace a slow endpoint to its workload and node without changing tools or losing context. A unified platform such as Fivenines can reduce collector and dashboard maintenance, but teams should keep specialized components when they provide needed Kubernetes or infrastructure detail.
6. Manage Monitoring as Code
Monitoring configuration should follow the same review and deployment process as infrastructure. Alert thresholds, dashboards, notification routes, maintenance windows, recording rules, and synthetic checks all affect production behavior. Manual edits in a web interface make changes harder to review, reproduce, and roll back.
Version monitor definitions in Git, then apply them through Terraform or a GitOps pipeline. Reusable modules can cover a Linux host, service availability check, or MSP client baseline. Separate variables or workspaces for staging and production, and keep credentials in a secret manager rather than repository files.
Define a monitoring contract
Each service module should expose its name, owner, environment, endpoint, severity, notification policy, and retention settings. Keep alert logic visible enough for responders to review. Provider resources also need examples and validation, because a successful deployment can still create an unusable route or incomplete coverage.
Use Monitoring automation guidance when standardizing enrollment across MSP clients. Shared modules can enforce baseline coverage while allowing client-specific endpoints and escalation policies. Internal platform teams can apply the same approach to production services. Fivenines may reduce collector and configuration maintenance during consolidation, but specialized tools can remain where they provide better control or service-specific behavior.
A practical rollout sequence is:
- Review monitor changes: Require peer approval for alert logic, thresholds, and routing.
- Validate in staging: Apply definitions to test services and confirm provider behavior.
- Test failure paths: Verify firing, routing, escalation, notification, and recovery.
- Record ownership: Store runbook links and responsible teams with each definition.
- Handle deletion: Remove retired monitors, dashboards, and routes through reviewed changes.
Codify stable signals, not every experiment. During an incident, engineers can prototype a dashboard or threshold, then commit it after confirming that the signal supports a clear response. This preserves incident speed while keeping durable production policy visible, reproducible, and reversible. Teams migrating from Prometheus and Grafana should also compare alert behavior and dashboard outputs before removing the original definitions.
7. Monitor Cron Jobs and Scheduled Tasks
Scheduled work often fails without affecting a continuously exposed endpoint. A backup can exit with an error, a data synchronization task can stop running, or a report generator can exceed its delivery window while the host reports normal resource usage. Traditional host monitoring sees the machine, not whether the job fulfilled its business purpose.
Each important job should report execution status, exit code, duration, output, and expected completion window. A heartbeat endpoint is a simple pattern: the job sends a success signal only after the meaningful work completes. The monitoring system then alerts when the signal is missing, late, or accompanied by a failure result.
Detect absence as well as failure
A job that runs for too long deserves attention even if it eventually exits successfully. Duration baselines help distinguish a normal slow run from a regression caused by data growth, a locked database, insufficient disk space, or a dependency outage. Alerting only on non-zero exit codes misses missed schedules and hung processes.
Database backups make the distinction clear. A backup monitor should confirm that the job started, completed, produced the expected artifact, and didn't exceed its operational window. A cleanup task should expose disk-space conditions and log output centrally rather than relying on a local email that may never be read.
Systemd timers can offer clearer service status and journal integration than traditional cron, but they still need outcome monitoring. Retry logic should use controlled backoff, and retries shouldn't conceal repeated failure. The alert should show the last successful execution, the current run state, duration history, exit code, and the next expected run.
For small teams, dedicated cron monitoring can be more valuable than another broad dashboard. It covers a blind spot with little instrumentation and gives responders a direct answer to a common incident question: did the background process finish?
8. Automate Status Pages and Customer Communication
Incident response has two audiences. Operators need technical evidence and ownership, while customers need a clear statement about affected components, current impact, and the next update. A public or internal status page gives both groups a shared reference and reduces repeated requests to the on-call team.
Automation should update component state from trusted monitors where the relationship is unambiguous. A failed API health check might change the API component to degraded, but a single ambiguous probe shouldn't publish a global outage. Human review remains appropriate for complex incidents, security events, and situations where automated wording could mislead customers.
Separate technical detail from useful explanation
Customer-facing messages should describe impact in plain language. “Some users may be unable to complete payments” is more useful than exposing an internal database alert name. Internal status views can retain deployment identifiers, dependency details, and investigation notes.
A SaaS provider might publish separate components for web access, API requests, background processing, and customer notifications. An MSP may need isolated pages for each client, with shared infrastructure incidents reflected only where they affect that client. Subscriber lists should support maintenance notices, while incident history should preserve updates and the final root-cause explanation.
Status automation also needs testing. Teams should exercise a low-risk monitor, verify that component changes appear correctly, check subscriber notifications, and confirm that resolution updates close the incident cleanly. A status page that remains green during an outage damages trust, while one that changes on every transient check creates unnecessary concern.
Communication belongs in the reliability design, not at the end of an incident. The status page, escalation workflow, runbook, and post-incident review should agree about service names, component ownership, and the language used to describe impact.
9. Monitor GPUs, Networks, and Specialty Hardware
Standard server metrics rarely explain a GPU workload that has slowed because memory is fragmented, a network device that is approaching management-plane exhaustion, or a rendering node that is thermal throttling. Specialty hardware requires vendor-aware collection and dashboards designed around its failure modes.
ML platforms should distinguish GPU utilization from GPU memory allocation, process ownership, temperature, errors, and throttling. Video rendering services need visibility into per-process allocation and queue behavior. Network teams need interface traffic, errors, reachability, device CPU, memory, temperature, and control-plane health. The right signals depend on the workload, so a generic “hardware healthy” status isn't enough.
Use separate operational views
A network engineer shouldn't have to filter through application panels to investigate a switch port. An ML engineer needs a GPU view that connects device behavior to the job, node, image, and model workload. Separate dashboards can improve focus while a common telemetry model preserves cross-layer correlation.
Thresholds should reflect hardware limits and workload baselines rather than copied defaults. A thermal alert may need early warning and critical states, with automated throttling detection where the hardware and driver expose it. GPU memory fragmentation can indicate a kernel or process lifecycle problem even when average utilization appears acceptable.
Specialty monitoring also affects migration scope. Prometheus exporters may provide excellent NVIDIA or SNMP coverage, and replacing them immediately can create avoidable gaps. A safer approach is to inventory collector capabilities, run the existing and target systems in parallel for representative workloads, compare signal completeness, and retire components only after alerts and dashboards have equivalent operational meaning.
Fivenines includes Linux, network, Proxmox, and NVIDIA GPU visibility in its unified monitoring scope, but a specialized platform can remain appropriate for deep GPU profiling, packet analysis, or vendor-specific diagnostics. Consolidation should reduce context switching without erasing the detail specialist teams require.
10. Choose Transparent Pricing and Predictable Cost Controls
A monitoring bill rarely reflects the full operating cost. Storage, ingestion, cardinality, egress, dashboard upkeep, exporter maintenance, incident response, and engineering time all affect the total. Pricing based on metric volume, retention, query usage, or custom dimensions can make a low starting price difficult to forecast.
Compare equivalent operating models before choosing a platform. A Prometheus and Grafana stack may avoid a traditional license fee, but the team still owns storage, upgrades, alert routing, backups, access control, and integrations. A commercial service may reduce that maintenance while charging by host, monitor, user, data volume, or feature tier. Neither approach is automatically cheaper.
Measure observability efficiency
The 2024 Grafana observability survey reported 76% centralized observability among surveyed organizations. More than two-thirds used at least four observability technologies, and respondents collectively reported more than 60 tools in active use. Centralization produced time or cost savings for 79% of respondents with centralized observability, but those findings do not guarantee a return from every consolidation project. Savings depend on the tools removed, workflows simplified, and coverage retained.
The survey also reported widespread open-source use, with 98% of respondents using open-source observability tools, alongside adoption of Prometheus and OpenTelemetry. Open source can provide control and ecosystem depth. A unified service can reduce maintenance and integration work. During migration, run both systems long enough to compare alert coverage, retention, query performance, and operator effort before retiring Prometheus or Grafana components.
Use a cost review that includes:
- Telemetry cost per service: Count storage, ingestion, licensing, and operational overhead.
- Unused signal rate: Remove metrics, logs, and dashboards that no responder uses.
- Alert cost: Track pages, escalations, and investigation time, not only notification volume.
- Retention value: Keep history that supports incident analysis, capacity planning, and compliance.
- Migration overlap: Budget for the period when old and new platforms run together.
Fivenines' publisher information states transparent pricing starting at €9 per month. Verify current plans, limits, coverage, retention, users, API access, and notification options before budgeting. A unified platform may reduce overhead for a small operator or MSP, while a self-managed stack can remain preferable when the team needs maximum control over data placement and custom integrations.
10-Point DevOps Monitoring Comparison
| Practice | Implementation complexity | Resource requirements | Expected outcomes | Ideal use cases | Key advantages |
|---|---|---|---|---|---|
| Implement Multi-Region Uptime Monitoring with Failure Confirmation | Moderate, deploy probes + tune confirmation thresholds | Distributed probe capacity, regional endpoints, modest cost increase | Fewer false positives; reliable outage confirmation; regional visibility | Global web services, CDNs, e-commerce, SaaS with distributed users | Reduces alert fatigue; distinguishes regional vs global issues |
| Unified Metrics Collection Across Infrastructure Layers | High, standardize collectors and data schemas | Central storage, agents across servers/containers/network, higher storage/compute | Holistic visibility; faster correlation and troubleshooting | MSPs, large enterprises, teams consolidating tool sprawl | Single pane of glass; cross-layer correlation; lower ops overhead |
| Agent-Based Collection with Push-Over-Pull Architecture | Moderate, deploy and manage agents at scale | Agent CPU/disk/memory, egress bandwidth, agent lifecycle tooling | Reliable metric delivery in restrictive networks; improved security posture | Environments with strict firewalls, NAT, edge, isolated networks | No inbound ports; secure push; reliable in restricted networks |
| Intelligent Alert Routing and Escalation Workflows | Moderate–High, design rules, schedules, escalation policies | On-call schedules, multi-channel integrations, routing maintenance | Targeted notifications; reduced noise; reliable escalations | Organizations with on-call rotations, multiple teams, MSPs | Ensures right people alerted; reduces alert storms; audit trails |
| Container and Orchestration-Native Monitoring | High, handle dynamic labels, high cardinality, orchestration APIs | High metric volume, cluster agents, storage and query capacity | Per-container visibility; better autoscaling and contention detection | Kubernetes/Proxmox operators, multi-tenant SaaS, cloud-native apps | Precise resource accountability; detects noisy neighbors early |
| Monitor-as-Code and Infrastructure-as-Code Integration | Moderate–High, author and test monitor definitions as code | VCS, CI/CD pipelines, Terraform/provider knowledge | Reproducible, auditable monitoring; repeatable deployments | Teams practicing IaC/GitOps, MSPs, regulated environments | Versioned changes, testable configs, env parity |
| Cron Job and Scheduled Task Monitoring | Low–Moderate, instrument or wrap scheduled jobs | Lightweight wrappers/agents, centralized logging, alerting | Detect missed executions, timeouts, and performance regressions | Backup/data pipelines, scheduled reports, ETL jobs | Catches silent failures; monitors duration and success rates |
| Status Page and Customer Communication Automation | Low–Moderate, integrate monitoring with status tooling | Status hosting, subscriber notifications, branding assets | Reduced support load; transparent incident communication | SaaS platforms, MSPs, hosting providers, internal ops | Automates customer updates; improves trust and reduces calls |
| Specialization-Aware Monitoring (GPU, Network, Specialty Hardware) | High, vendor APIs, drivers, domain-specific metrics | Vendor tools/agents, specialized collectors, expert interpretation | Early hardware fault detection; optimized specialty resource use | ML/AI clusters, GPU workloads, data centers, network ops | Prevents hardware failures; enables ML optimization and chargeback |
| Transparent Pricing and Cost Predictability Models | Low, select/prioritize vendors with clear pricing | Cost estimation tools, usage monitoring, finance coordination | Predictable budgeting; fewer surprise bills; easier ROI | Startups, MSPs, finance-sensitive teams, scaling organizations | Predictable billing; simpler capacity planning; cost certainty |
Turn Monitoring Principles into an Operating System
A reliable monitoring program is an operating system for production decisions. It tells teams what customers experience, which service owns the risk, how urgently someone must act, what evidence supports diagnosis, and whether the organization can afford to preserve that visibility as infrastructure changes.
The rollout should start with service inventory and ownership. List user-facing applications, APIs, dependencies, scheduled jobs, hosts, containers, network devices, hypervisors, GPUs, and external providers. Assign a responsible team to each critical component, then document which paths are genuinely customer-facing. A monitor without an owner is only an unattended data source.
Next, define meaningful availability and performance targets. Google's SRE model recommends service-level indicators and objectives that measure whether a service meets its goals, rather than treating every infrastructure fluctuation as an incident. Google's SRE monitoring principles support connecting technical telemetry to user-relevant service behavior. The target might involve availability, latency, successful transactions, or completion of an important background process.
Instrument the highest-risk paths first. A checkout, authentication flow, tenant provisioning process, backup, or data synchronization task usually deserves more attention than a low-impact internal utility. Combine external checks with infrastructure metrics, logs, traces, and deployment context. Independent probes, synthetic transactions, and multi-region confirmation help expose failures that internal telemetry can miss.
The 2026 production reliability survey found that 78% of more than 1,000 surveyed SRE, DevOps, and IT operations professionals had experienced an incident where customers found the problem first because no alert fired, while 44% experienced an outage linked to suppressed or ignored alerts. The survey's findings on detection blind spots show why incident reviews should examine missing detection separately from false positives. A noisy alert and an absent alert are different failures requiring different fixes.
A practical operating checklist should cover:
- Signal selection: Confirm that each monitor represents customer impact, service health, diagnosis, or a defined capacity risk.
- Alert quality: Record actionable-alert rate, missed-detection rate, repeat alerts, acknowledgment time, and escalation frequency.
- Agent health: Monitor heartbeats, delayed telemetry, failed updates, certificate status, and configuration drift.
- Container coverage: Include pod or task health, restarts, resource pressure, image pulls, labels, and orchestration events.
- Specialty hardware: Validate GPU, SNMP, Proxmox, temperature, interface, and vendor-specific signals where applicable.
- Scheduled work: Track cron or systemd execution, exit status, duration, expected completion, and missing heartbeats.
- Status communication: Define component ownership, customer language, update responsibility, maintenance notices, and incident history.
- GDPR-aware handling: Minimize personal data in logs and labels, restrict access, document retention, and review regional hosting requirements.
- Migration validation: Compare coverage, alert behavior, routing, historical context, dashboards, API workflows, and failure recovery before retiring Prometheus, Grafana, Zabbix, UptimeRobot, or healthchecks.io.
OpenTelemetry deserves a staged treatment rather than a rushed mandate. The 2024 Elastic survey reported that 87% of respondents expected OpenTelemetry to become the observability-data standard within five years, and that respondents most commonly adopted or considered logs, metrics, and traces. The OpenTelemetry survey data supports beginning with one high-value transaction path, defining resource attributes such as service, environment, version, region, and trace identifiers, then validating correlation before broadening the rollout.
Consolidation can reduce operational overhead, but it isn't a universal answer. Some teams need Prometheus for deep ecosystem integrations, Grafana for flexible exploratory analysis, or specialist tools for packet inspection and GPU profiling. Others benefit from a unified platform that combines Linux, network, uptime, cron, container, Proxmox, and NVIDIA GPU visibility, with alert workflows and infrastructure automation in one place.
Fivenines is one option for that consolidation model. Its publisher information describes an open-source Linux agent that pushes telemetry over HTTPS, multi-region uptime checks with failure confirmation, white-label status pages, workflow automation, a REST API, and a Terraform provider. Teams should validate those capabilities against their architecture, data-retention needs, access model, compliance requirements, and existing exporter coverage. Broader infrastructure modernization work, such as DataLunix digital transformation, also benefits from treating monitoring as part of the operating model rather than as an isolated tooling purchase.
The most dependable sequence is straightforward: inventory services, define owners, set meaningful targets, instrument critical paths, add independent checks, route alerts by urgency, codify durable configuration, validate failure scenarios, and review noise, retention, access, and cost on a regular basis. That process produces better outcomes than adding dashboards until every system has a graph.
Fivenines brings Linux server metrics, network health, uptime checks, cron monitoring, container visibility, Proxmox and NVIDIA GPU insights, alert workflows, REST API automation, and Terraform management into one monitoring platform. Teams evaluating a Prometheus and Grafana migration or a fragmented uptime stack can visit Fivenines to compare its coverage and consolidation model with their production requirements.