Monitoring Data Quality for SRE Teams

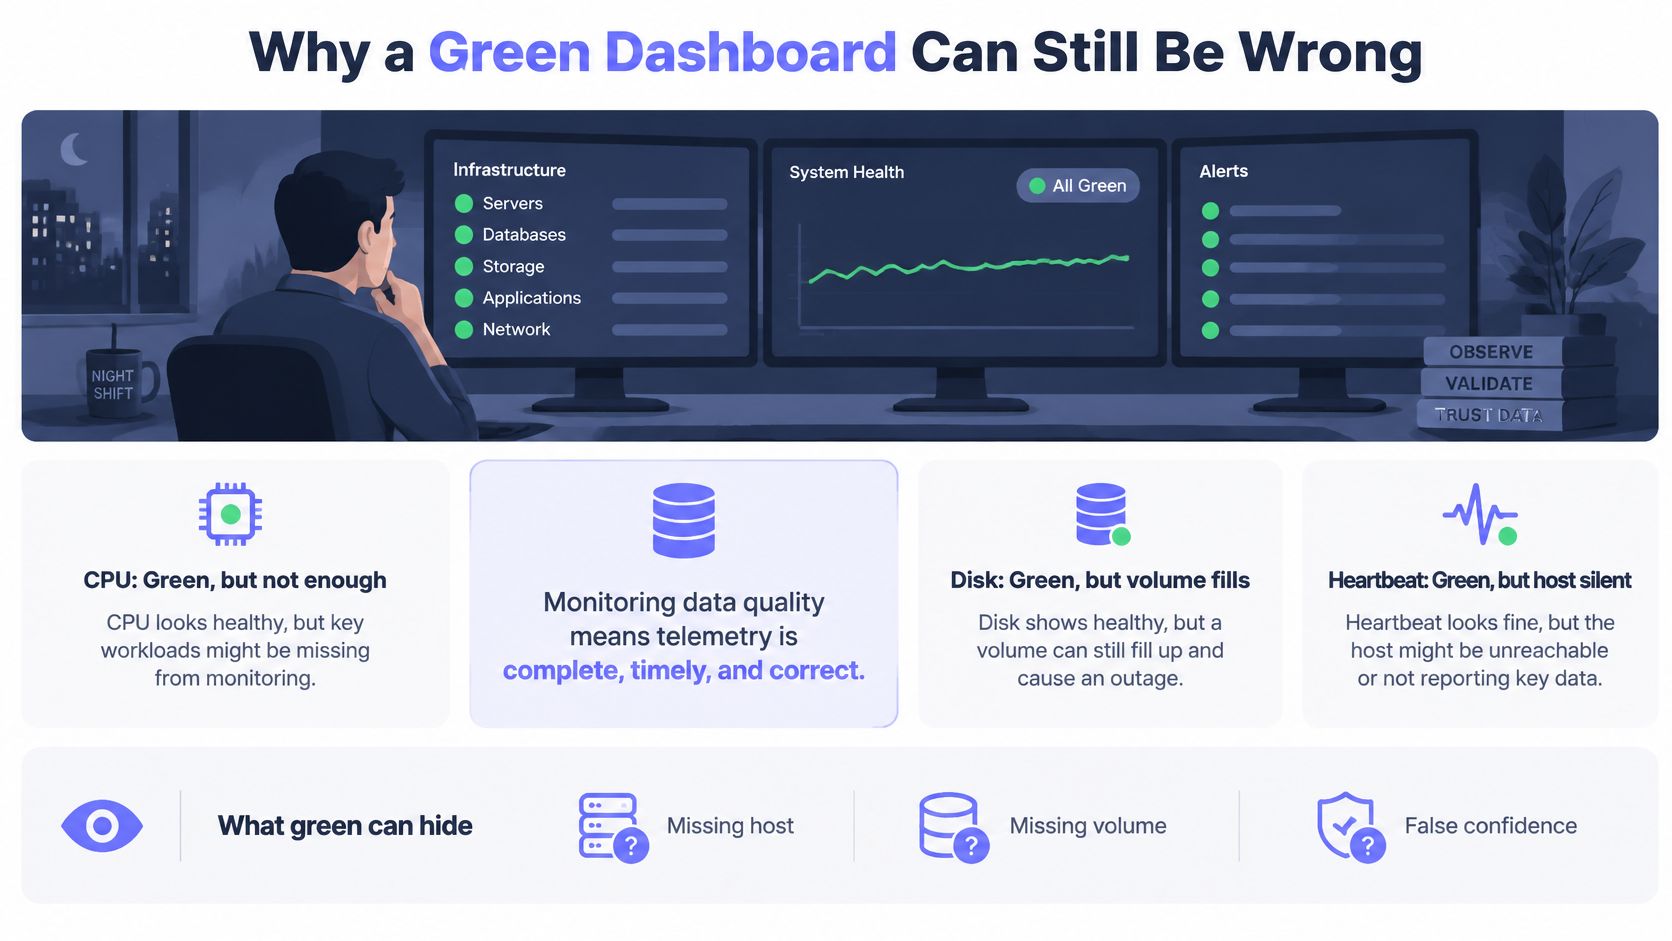
Collecting more telemetry and adding more alerts won't make monitoring trustworthy. On a night shift, CPU, disk, and heartbeat panels can stay green while a host stops reporting and its volume fills. Before an on-call team trusts the color, it needs proof that the measurements behind it are present, fresh, valid, and safe to use.
Table of Contents
- Why a Green Dashboard Can Still Be Wrong
- Quality Dimensions You Can Score Today
- Five Defects That Break Telemetry
- How to Instrument for Trustworthy Metrics
- When to Page on Telemetry Integrity
- A Remediation Loop Teams Can Run
- Prove the Next Green Dashboard Is Real
Why a Green Dashboard Can Still Be Wrong
Say a production host loses its agent connection while an application keeps writing to disk. The dashboard holds the last CPU reading, excludes the missing volume from an aggregate, and displays the last successful heartbeat. Nothing in that view proves the host is healthy.
Monitoring data quality means infrastructure telemetry is complete, valid, timely, consistent, and unique enough to support operational decisions. Those decisions include paging an engineer, closing an incident, updating a status page, or restarting a service. A measurement that can't support its intended decision shouldn't be treated as authoritative.
Continuous signals need continuous checks
Customer-record cleansing can repair a stored dataset. Metrics, logs, uptime checks, and cron results arrive continuously, so yesterday's cleanup doesn't validate today's stream. A bad timestamp or missing series can affect a dashboard, an alert evaluation, and the incident history used during the next investigation.
The recurring cost matters. In 2017, MIT Sloan Management Review reported that bad data typically costs companies 15% to 25% of revenue, a cross-industry benchmark rather than a telemetry-specific estimate. For operations teams, the practical costs include investigating false pages, reconciling contradictory panels, and discovering that a suppressed incident never entered the alert queue.
The illustration captures the distinction between green panels and verified health.
Green needs an evidence trail
Five defects deserve explicit controls: missing, noisy, delayed, duplicate, and label-drifted telemetry. Each can leave a technically functioning collection pipeline producing operationally misleading results.
API monitoring needs the same distinction. An integration owner can use Akinda's documentation to find screening API errors, then distinguish an explicit API error from an absent, malformed, or delayed monitoring result. A successful transport response alone doesn't establish that the intended operation succeeded.
The same reasoning applies to monitoring silent failures: absence must have a defined meaning rather than inheriting a healthy display state.
Proof test: A green dashboard is credible only when the team can establish that the expected systems supplied usable evidence for the displayed time window.
Quality Dimensions You Can Score Today
A useful scorecard connects each measurement to a pass condition and an operational consequence. Separate dimension scores work better than a blended health grade, because excellent validity can't compensate for missing production hosts.
Monitoring data quality scorecard
| Dimension | Formula | Pass test | If ignored |
|---|---|---|---|
| Completeness | Received expected series or fields / expected series or fields | Critical hosts report inside the collection window against the asset inventory | Risk is underestimated and nulls look like healthy zeros |
| Validity | Valid samples / total samples | Type, syntax, and range match the metric contract | Out-of-range values page or automate the wrong action |
| Timeliness | Event-to-ingestion and event-to-query latency at p95 and p99 | Delay fits the use case, short for outage detection and longer for capacity | Stale data hides a current failure |
| Consistency | Matching identity, unit, and label checks / total consistency checks | One identity and one unit from agent to dashboard | Conflicting panels and broken joins |
| Uniqueness | Duplicate events / total events on a stable dedup key | Each real event becomes a single stored record | Inflated counts and flapping alerts |
| Schema stability | Unexpected fields, renames, and label-cardinality change versus the accepted schema | Cardinality and field names stay inside the budget | Queries, dashboards, and alert rules silently break |
| Sampling bias | Events dropped or sampled per cohort / expected events, compared with sampling policy | Drop rates match policy in every cohort | Rare failures vanish from samples and look like health |
NIST's qDAR guidance defines validity through expected syntax, type, and range; completeness through captured versus potential information; and timeliness through the delay between an event and its documentation. These definitions give teams concrete contracts to test rather than subjective confidence scores.
Make the denominator explicit
Completeness starts with the expected set, not whatever happens to arrive. If an inventory lists a host but its series never appears, a query over received series alone can't reveal that omission. Missing required fields should fail their completeness check rather than disappearing from the validity denominator.
Validity should catch a string in a numeric gauge, an impossible negative disk-free value, or a timestamp outside the accepted clock tolerance. It doesn't prove factual accuracy: a plausible but incorrectly measured value can pass syntax and range checks. Synthetic inputs and comparison with an independent measurement help test that separate concern.
Consistency checks should follow a signal through transformations. A network throughput metric must retain its host identity and declared unit from collection through query, even when an intermediary changes field names.
Score the window and the cohort
Tail latency matters because intermittent queue stalls can disappear inside a calm average. NIST's operational approach supports measuring event-to-ingestion and event-to-query delay at p95 and p99, with thresholds appropriate to each monitor's purpose.
Production hosts warrant stricter missing-data controls than disposable development machines. Segment scores by agent version, region, tenant, device class, and collection method so a healthy fleet average can't conceal a broken cohort.
Presentation should make the failing slice accessible. Teams designing data scorecards with PlotStudio AI can use that structure to connect each score to its threshold, owner, and affected signals, while metrics and dashboards should place those checks beside the service measurements they qualify.
A monitor is trustworthy only while its relevant quality dimensions remain inside their thresholds for the same window its alert evaluates.
Five Defects That Break Telemetry
Missing data creates the most dangerous false confidence because the dashboard may have nothing visibly wrong to plot. A stopped agent, filtered network interface, or paused cron job can disappear from a query without producing an application error. The first check is the expected inventory, not the chart legend.
Telemetry defects, first checks, and traps
| Defect | How it shows up | First check | Do not |
|---|---|---|---|
| Missing | Gap versus inventory or absent heartbeat | Monitored assets / assets in source of truth | Convert null to zero |
| Noisy | Spikes, flaps, or cardinality explosions | Agent version and collection configuration | Page on every blip |
| Delayed | p99 ingestion lag with a calm average | Timestamp chain from event to query | Trust mean latency alone |
| Duplicate | Double counts or replayed events | Dedup key and retry behavior | Count both copies in an SLO |
| Label drift | Renamed fields, unit changes, new labels | Schema diff by agent version and tenant | Let drift rewrite alert rules |
Diagnose the defect before changing sensitivity
Noisy telemetry often warrants a collection review before an alert-rule change. Debug tags, container identifiers, and unbounded user input can create unexpected label combinations. Compare agent versions and scrape or push configuration before adding a longer alert delay that might also hide a genuine outage.
Delayed data requires a timestamp chain. Compare event occurrence, collection, transmission, ingestion, and query availability to identify whether the delay starts at the device clock, agent, transport, or processing stage. A backend that answers queries quickly can still serve old measurements.
Duplicates need inspection at the event boundary. Retries, replayed batches, and overlapping collectors can produce records that look individually valid but describe the same occurrence. Counters and incident calculations should consume deduplicated events, not raw delivery attempts.
Treat structural changes as operational changes
Label drift can preserve successful HTTP responses while breaking the queries behind a panel. A renamed field may stop matching an alert selector; a changed unit may leave a graph looking plausible at the wrong scale. Schema diffs should therefore compare meaning as well as field presence.
Cribl's discussion of operationalizing data integrity identifies near-duplicate events, bloated payloads, inconsistent field names, and schema drift as practical problems; it also reports that 29% of surveyed leaders identified inability to measure data quality as their biggest obstacle. That measurement gap is a reason to expose defect rates directly, not a reason to collect indiscriminately.
Quarantine the affected signal slice, not the whole fleet. Unaffected cohorts should continue evaluating while responders investigate the defective input.
Quarantine must preserve evidence for debugging. It should remove the signal's authority to drive an action, not delete the records that explain its failure.
How to Instrument for Trustworthy Metrics
Instrumentation should make failures attributable. An existing fleet rarely needs a complete monitoring replacement before it can expose expected coverage, source identity, timestamp boundaries, and rejected samples.
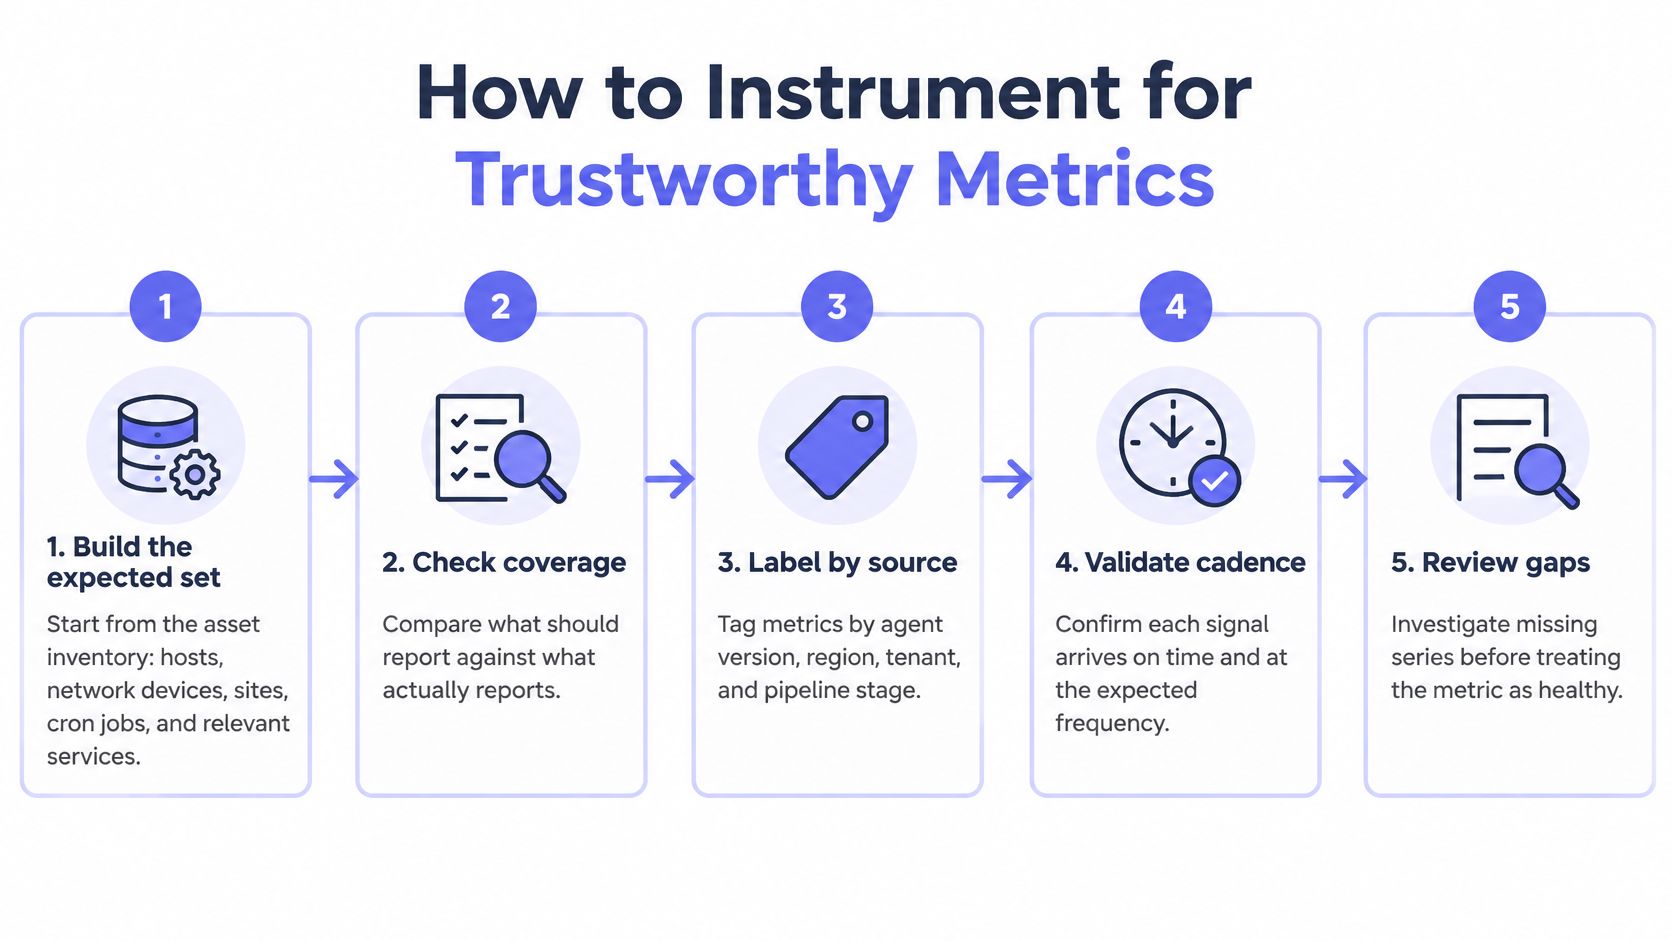
The collection routine starts with an explicit expected set.
Establish the collection contract
Build the expected set. Import hosts, network devices, sites, and cron jobs from the authoritative inventory. Include containers, hypervisors, and GPUs where their lifecycle and operational importance justify independent monitoring.
Define each signal's contract. Record its name, unit, type, required fields, label allow-list, and collection interval. Version the contract so a rename is an intentional migration rather than a surprise parser change.
Make delivery identifiable. An agent pushing over HTTPS avoids dependence on inbound monitoring ports or remote command paths. Attach agent version and source identity to each sample, and expose rejected payloads, queue pressure, and transport failures separately.
Preserve timestamp boundaries. Record event, collection, transmission, ingestion, and query-availability times where the pipeline supports them. Keep the original event timestamp through retries rather than replacing it with arrival time.
Deduplicate before durable aggregation. Use a stable key based on source, signal identity, and logical event or collection interval. Retention for deduplication state must cover the pipeline's supported replay behavior.
Spend fidelity where diagnosis needs it
- Assign fidelity by purpose. Keep infrastructure health signals and security-relevant events at high fidelity, aggregate repetitive logs, and sample routine traces with explicit policy. Preserve anomaly exemplars and the context needed to connect them to surrounding activity.
Cost pressure is real: TechInformed's reporting on monitoring surveys states that 57% of respondents said telemetry costs exceeded the infrastructure costs of the systems being monitored, while another survey found organizations actively used only 13% of collected telemetry on average. Neither finding justifies deleting rare-failure evidence; the useful distinction is between repetitive volume and diagnostic value.
Enforce cardinality budgets at the edge. Reject unbounded labels such as raw request identifiers from metric dimensions. Keep detailed identifiers in appropriately controlled event records instead.
Gate rollouts on quality. Recompute completeness, validity, and cardinality for the canary cohort before expanding an agent release. Store contracts and checks alongside monitoring as code so reviewers can inspect changes together.
A visual walkthrough can complement the rollout procedure.
The acceptance condition isn't that the new agent starts successfully. Its cohort must remain inside the declared quality thresholds, without losing the evidence needed to investigate unusual failures.
When to Page on Telemetry Integrity
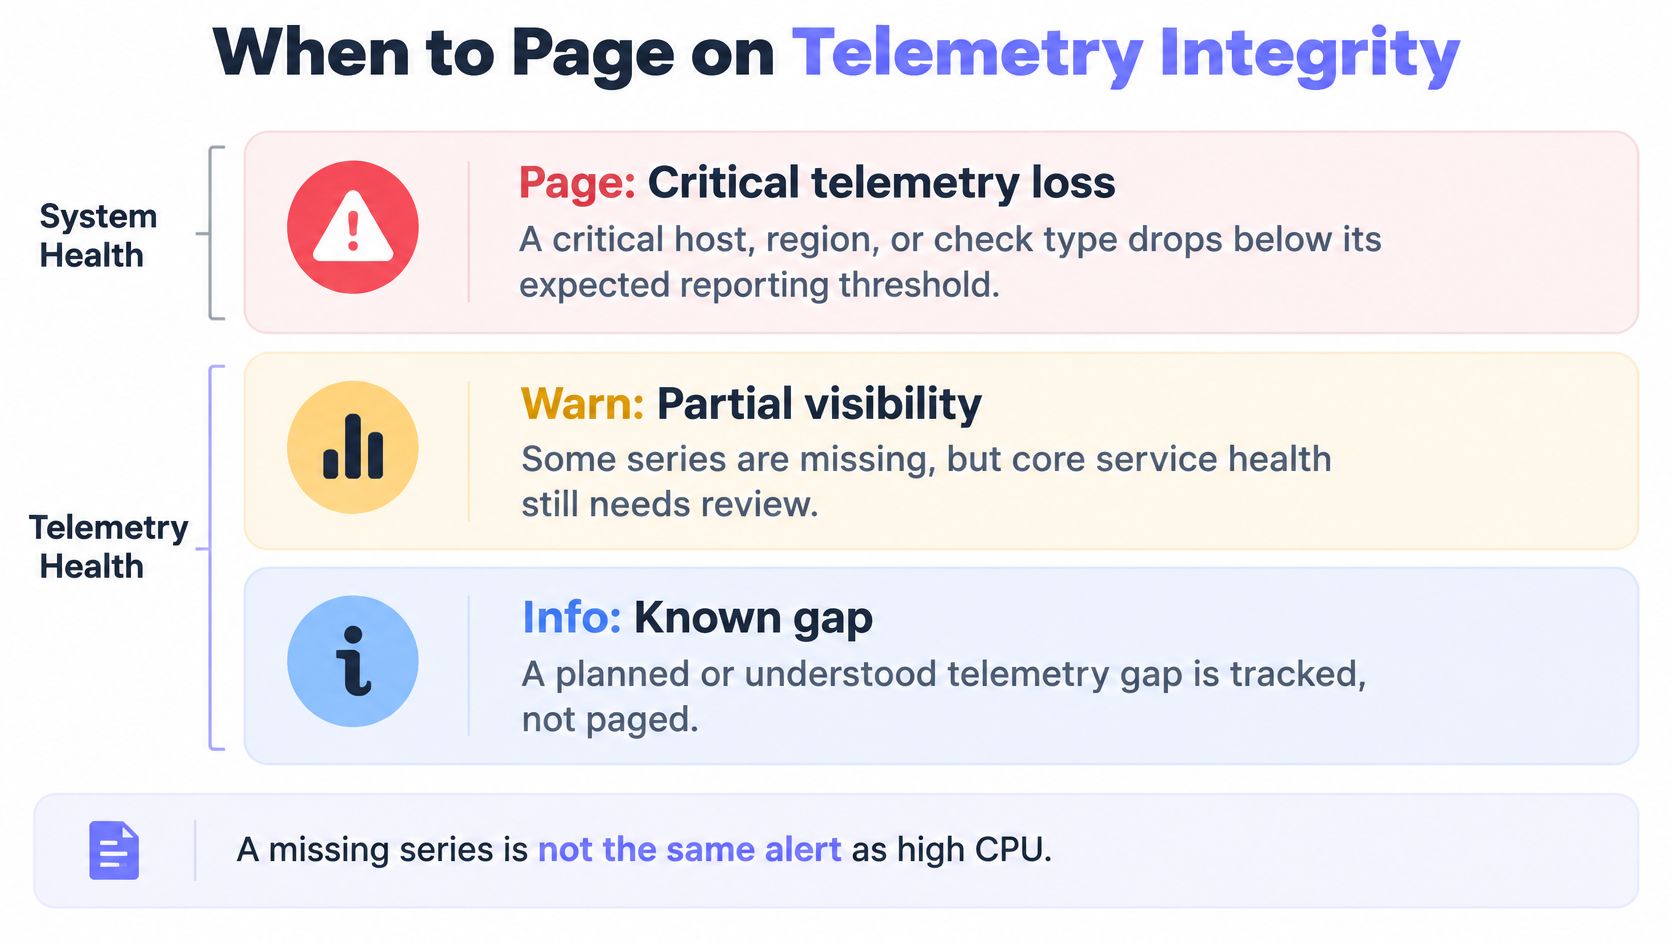
Page on lost operational visibility; quarantine inputs that can't safely drive decisions. A missing series isn't the same alert as high CPU, and responders need different runbooks for those conditions.
NIST's continuous-testing guidance explains that inadequate completeness can underestimate risk, while stale measurements can miss current nonconformance. No alert isn't evidence of health when the system responsible for producing or evaluating that alert lacks usable inputs.
Route by impact on the decision
Telemetry integrity severity lookup
| Failure | Signal | Severity | Action |
|---|---|---|---|
| Critical host, region, or check type below completeness threshold | Completeness | Page | Open a telemetry-integrity incident with its own runbook |
| Freshness beyond the outage-detection budget | Timeliness at p95 and p99 | Page | Route to the integrity policy and check the timestamp chain |
| Alert evaluation not covering the expected rule set | Rule evaluation coverage | Page | Restore rule evaluation before trusting any quiet panel |
| Uptime check fails from one probe only | Multi-vantage confirmation | Hold | Page after independent-vantage confirmation or persistent failure across consecutive windows |
| Validity drops or duplicates rise while the host still reports | Validity and uniqueness | Warn and hold automation | Quarantine the affected slice from status pages and automation |
| Cardinality climbs while the host still reports | Schema stability | Warn and hold automation | Downgrade the signal and review the label budget |
| Late data from a low-priority dev cohort | Timeliness | Record only | Review in the weekly quality report |
For uptime-style checks, confirmation should come from an independent vantage or repeated collection windows before paging. That policy trades some detection speed for protection against probe-local failures; critical services may justify parallel confirmation rather than waiting for another interval.
Multi-region HTTPS, TCP, ICMP, and DNS checks need freshness budgets tied to outage response. Capacity reporting can tolerate a longer delay because it supports a different decision.
The severity split should be visible to operators before an incident starts.
Keep uncertainty out of automated actions
Integrity incidents can use the same chat, SMS, and webhook destinations as production alerts, but their titles should identify the monitoring failure. A responder should start with collection and evaluation health, not application profiling.
The real-time alerting policy should also define what quarantined signals cannot do. They shouldn't close an existing incident, flip a public status page, or trigger auto-remediation; an explicit unknown state is safer than an unsupported healthy state.
The operational coverage view should expose expected hosts reporting within the window, metric freshness, missing-field rate, and the share of expected alert rules that evaluated. Otherwise, a functioning notification channel can conceal a broken detection path.
A Remediation Loop Teams Can Run
The remediation loop is detect, localize, contain, fix, and remeasure. Each incident should retain its original failing quality check as the closure criterion. A quiet dashboard isn't sufficient evidence that the defect has gone away.
An agent rollout removes a cohort
Suppose an agent upgrade causes production hosts in its canary cohort to stop reporting. Completeness falls for that version while neighboring versions remain steady. That comparison narrows the investigation before responders spend time debugging every host's application.
The release owner pauses expansion and quarantines the cohort's affected signals from automated health decisions. After rollback or a collection fix, the owner restores the cohort only when its reporting rate meets the host policy over the required observation window. Restarting the agent process alone doesn't close the incident.
A shared review should examine the failing cohort and the evidence used to approve recovery.

A unit migration creates contradictory disk panels
Consider a disk-free migration that sends bytes under the old name and a percentage under a renamed field. A dashboard joins both streams as though they represent the same measurement. The immediate task is to stop the affected rule from making decisions while preserving both payloads for inspection.
The pipeline owner introduces an explicit compatibility mapping and distinct unit semantics. The schema contract rejects ambiguous combinations, and the dashboard query is tested against old and new payload fixtures. Closure requires the consistency and schema checks to pass, not merely a visually plausible disk panel.
Retries make heartbeat state flap
A retry storm can replay heartbeat events out of order, causing status automation to alternate between stale and current interpretations. The owner blocks that input from status automation, then inspects retry handling and event ordering.
Deduplication should use host identity plus the logical heartbeat interval, retaining an authoritative record according to the contract. Recovery also requires a replay test: delayed copies must not overwrite newer health state.
Closure rule: The same quality indicator that detected the defect must demonstrate recovery before the affected signal regains operational authority.
The audit trail should retain affected hosts, pipeline stages, rejected records, deployment changes, and recovery evidence. During a weekly review, responders should also inspect incidents where sampling removed useful context; when a missing span would have explained the failure, that signal class merits higher fidelity. This turns the review into a collection-policy change rather than another reminder to investigate more carefully.
Prove the Next Green Dashboard Is Real
A practical adoption plan fits into a working week without replacing the monitoring stack. The first deliverable is a defensible view of coverage, not a new collection architecture.
Make the first week produce evidence
- Opening day. Export the asset inventory and reconcile hosts, external checks, and cron jobs with what the monitoring backend receives. Assign an owner to unexplained gaps.
- Next day. Place freshness and validity indicators beside CPU and uptime panels. Break them down by agent version, region, and tenant so responders can identify a failed cohort without writing an emergency query.
- Midweek. Enable integrity paging for critical completeness and freshness failures. Quarantine invalid or duplicated streams from status changes and automated remediation.
- Before the next rollout. Canary the agent or pipeline change against declared completeness, validity, and cardinality thresholds. Reject the rollout when the quality gate fails, even if the process remains running.
- At the week's review. Revisit an incident and inspect whether sampling removed explanatory evidence. Promote the relevant signal class when diagnosis depended on information the collection policy discarded.
Choose a platform by its failure behavior
A credible platform should distinguish heartbeats from resource metrics, confirm external-check failures, and expose collection changes for review. It should also let operators manage monitors as code rather than reconstructing configuration after an incident.
Teams migrating from Prometheus, Alertmanager, and separate uptime tools should evaluate those behaviors before moving collection. A consolidated dashboard isn't an improvement if it replaces visible gaps with an unexplained green state.
The immediate decision is straightforward: apply the scorecard to the current stack, establish quarantine rules, and test a deliberately interrupted signal. A platform change becomes justified when missing-data detection, failure confirmation, and routing still require fragile manual coordination.
Fivenines combines infrastructure metrics, multi-region uptime checks with failure confirmation, and alert routing to chat, SMS, and webhooks, with an open-source agent that pushes telemetry over HTTPS. Teams assessing collection and paging together can visit Fivenines and evaluate it against the same coverage, freshness, and rollout acceptance checks used for their current stack.