Best Network Monitoring Software 2026: 10 Tools Compared

Say a three-person operations team gets a client's outage call at two in the morning. The servers look healthy, the uptime dashboard is mostly green, and nobody received a useful alert. A switch dropped, but the monitoring stack covered hosts rather than the network connecting them.
That gap isn't unusual in a stack assembled around immediate needs. Prometheus handles application metrics, an uptime service checks the homepage, and someone checks switch counters manually when customers complain. Each tool works, but nobody owns the coverage between them.
Network visibility deserves explicit ownership. Uptime Institute's Annual Outage Analysis identifies network issues as the largest single cause of IT-service outages, while distinguishing those disruptions from serious physical data-center outages, where power problems lead.
The best network monitoring software depends on deployment model, team skills, and billing structure. A self-hosted platform can suit an infrastructure team with database and Linux expertise. Hosted SNMP monitoring can suit an MSP that needs client visibility without maintaining another central server. Neither choice automatically provides application-level diagnosis.
The tools below are grouped by their practical fit rather than feature count. Each assessment considers deployment ownership, useful network coverage, the pricing unit that matters as fleets grow, and migration from Prometheus, Zabbix, or uptime-only services. Discovery, actionable alerts, and sustainable operating costs matter more than an impressive dashboard during a demonstration.
Table of Contents
- 1. Fivenines
- 2. Paessler PRTG Network Monitor
- 3. SolarWinds Network Performance Monitor (NPM)
- 4. Zabbix
- 5. Datadog Network Monitoring
- 6. ManageEngine OpManager
- 7. Auvik
- 8. LogicMonitor
- 9. LibreNMS
- 10. OpenNMS
- How the leading network monitoring tools differ on deployment, published pricing and best fit
- Matching Your Monitoring Tool to Your Team, Budget and Migration Path
1. Fivenines
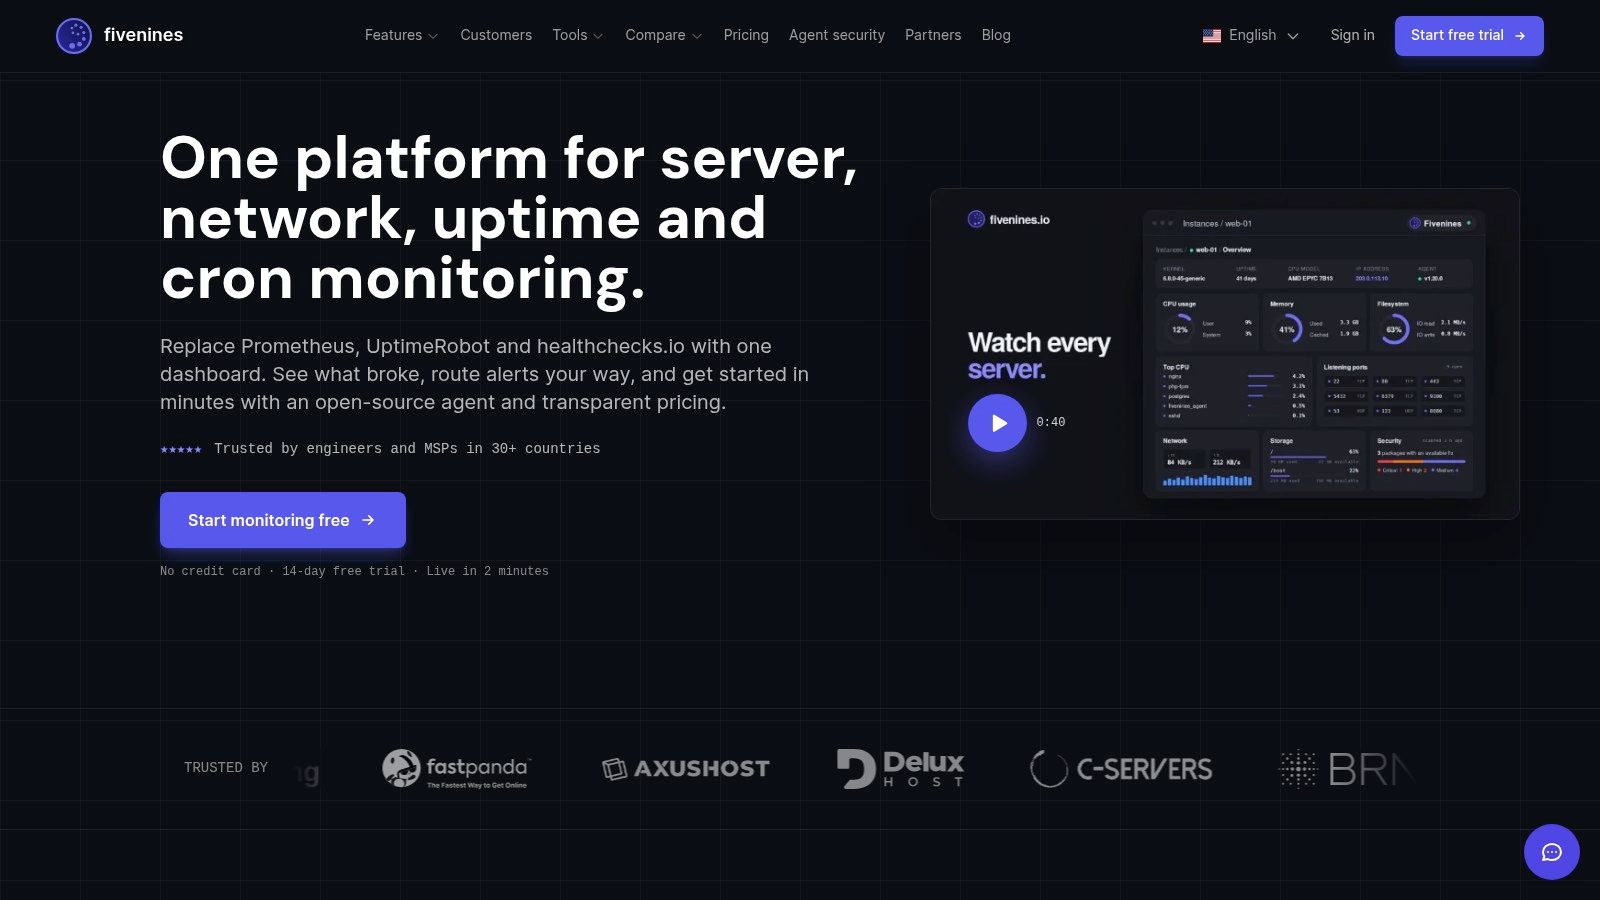
Fivenines suits DevOps teams, hosting providers, and MSPs that want hosted infrastructure monitoring without maintaining separate tools for servers, network devices, uptime, and cron jobs. Its strength is bringing these checks into one dashboard, rather than offering specialized network-management depth.
The platform combines Linux and Windows server metrics with SNMP device monitoring, Docker, Proxmox, GPU, and external service checks. Its open-source agent sends server telemetry over HTTPS. Network device monitoring uses SNMP, so teams need suitable connectivity and credentials.
Switches, routers, and firewalls must be added explicitly. Polling covers interface traffic, errors, reachability, and alerts. Server and device metrics appear in the same tool, but teams should configure the devices they need monitored.
Migration and practical limitations
Prometheus users should assess whether hosted collection, dashboards, and alert workflows cover their infrastructure needs. Application-specific instrumentation and custom queries still need a separate coverage review. Fivenines can monitor an existing Prometheus or VictoriaMetrics server, but this does not import every metric and rule.
For Zabbix migrations, map templates and triggers to the device checks you need before retiring the existing setup. Teams moving from uptime-only services can add host and SNMP context, alongside HTTPS, TCP, ICMP, DNS, and cron monitoring.
- Operational strength: Group servers, monitors, and network devices by client to keep each customer's fleet, alert stream, and status page together. Terraform support lets teams define monitoring resources alongside infrastructure code.
- Pricing unit: Each server, uptime check, cron task, SNMP device, and MQTT topic monitor counts toward the plan's monitor limit. Estimate the total from the full fleet, not just its server count.
- Limitations: The server metrics agent is open source, while the dashboard, storage, and alerting backend are hosted in the EU. Teams should confirm that this hosted model fits their data-location and operating requirements.
Best fit: Operations teams that prefer unified incident visibility to maintaining a customizable monitoring backend. Teams that need to operate the entire monitoring stack themselves should assess that trade-off before migrating.
2. Paessler PRTG Network Monitor
A switch isn't a useful unit for estimating a PRTG deployment. Sensors are. A team monitoring availability, interface traffic, hardware health, and services will consume capacity differently from a team collecting only reachability.
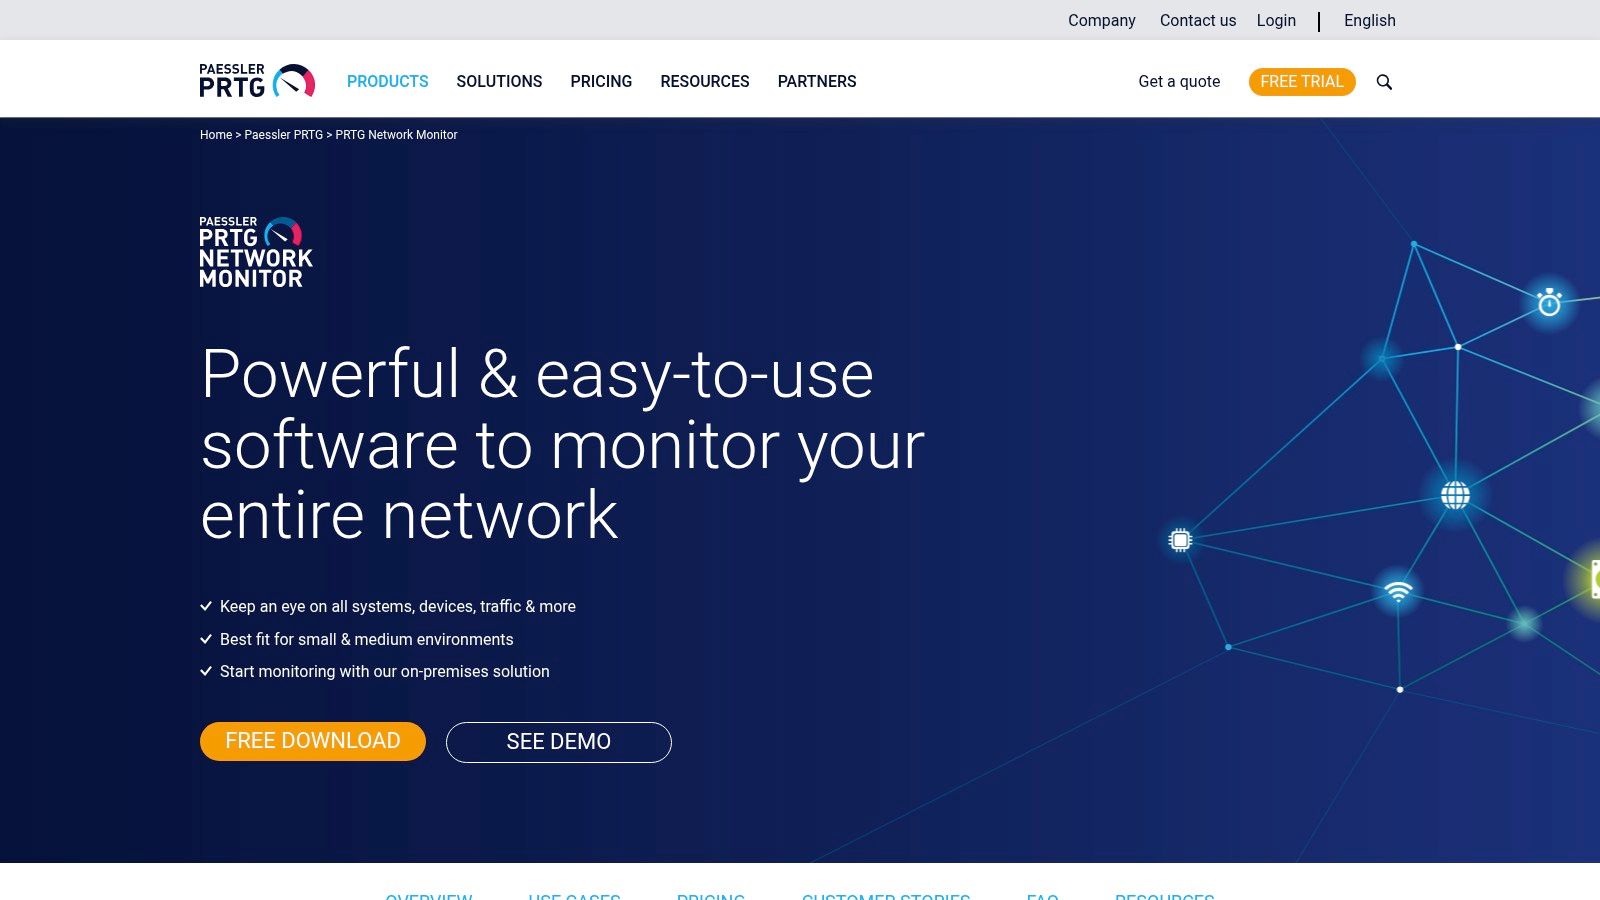
Paessler PRTG Network Monitor fits Windows-oriented IT teams that want broad device discovery, predefined monitoring types, maps, and reporting. The main self-hosted product runs on Windows, while hosted options address teams that don't want to operate the central server.
Remote probes make distributed-site coverage practical. The important design work is deciding which interfaces and services deserve monitoring rather than accepting every discovered measurement indefinitely.
Sizing rule: Estimate licensing from a representative device configuration, not from the asset register alone.
Migration and limitations
Prometheus users should expect to rebuild exporter-based coverage as sensors rather than translate queries directly. Zabbix users need to map items, triggers, and discovery rules to PRTG's sensor and notification model. Uptime-only users can add internal device visibility, but should preserve external service checks during the transition.
- Strength: Broad infrastructure coverage reduces the need for custom scripts when common monitoring types already exist.
- Cost pressure: Sensor-based licensing becomes harder to forecast as interface coverage and service checks expand.
- Limitation: The configuration breadth can burden teams that only need straightforward availability alerts.
The PRTG comparison helps frame the choice between sensor-oriented monitoring and a hosted consolidated platform. Best fit: Generalist IT teams that prefer predefined monitoring over building an exporter stack.
3. SolarWinds Network Performance Monitor (NPM)
SolarWinds NPM belongs on a dedicated network team's shortlist, not automatically on a small DevOps team's shopping list. Its appeal is detailed investigation across traditional enterprise networks.
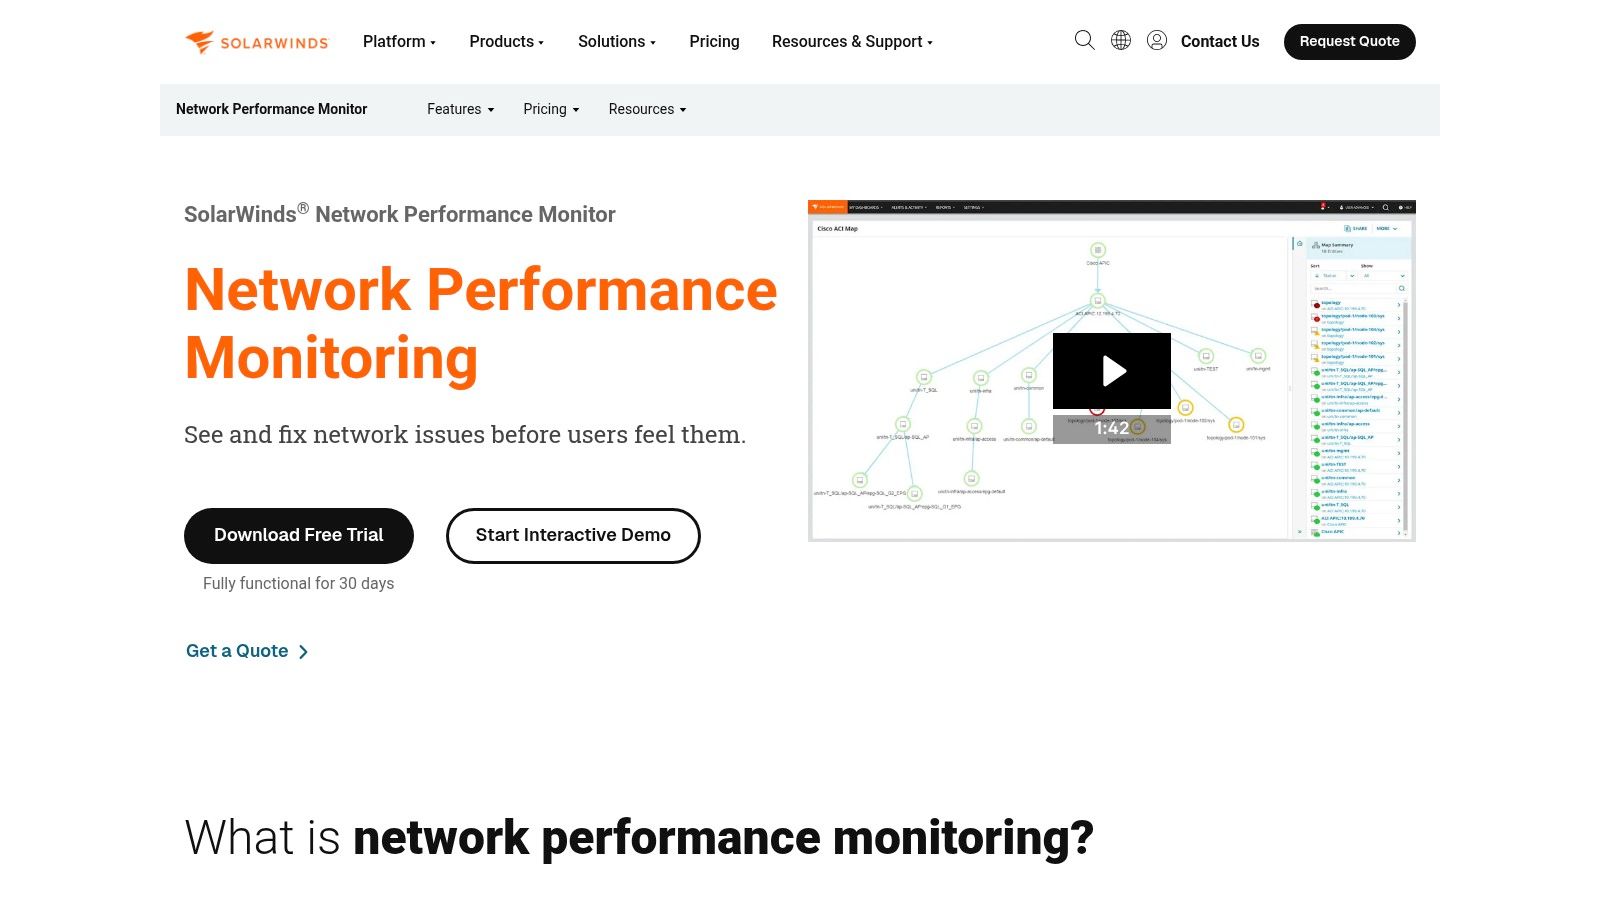
SolarWinds Network Performance Monitor combines multi-vendor device monitoring, topology, interface performance, and availability. NetPath adds hop-by-hop investigation, while correlation tools help operators compare network symptoms with related infrastructure conditions.
That depth matters when an incident requires more than proving that a device stopped answering. A network operator may need to distinguish a congested interface from an upstream path problem and understand which services depend on the affected equipment.
Ownership, migration, and limitations
The platform is self-hosted. Someone must own the monitoring infrastructure, capacity planning, upgrades, and alert tuning alongside the network itself.
For teams leaving Prometheus, NPM is most compelling when dedicated network investigation is missing. It shouldn't be treated as a replacement for application instrumentation. Zabbix users should rebuild dependencies and escalation behavior deliberately, while uptime-only users should retain outside-in checks until equivalent coverage is demonstrated.
- Strength: Detailed network troubleshooting suits large, heterogeneous estates with named operational owners.
- Pricing consideration: Licensing scope needs to match the proposed monitored estate and any adjacent capabilities. Device count alone isn't a sufficient procurement specification.
- Limitation: Implementation effort and platform upkeep can outweigh the benefit for a small network.
Best fit: A network operations team prepared to maintain a substantial platform and use its diagnostic depth, rather than merely collect green availability indicators.
4. Zabbix
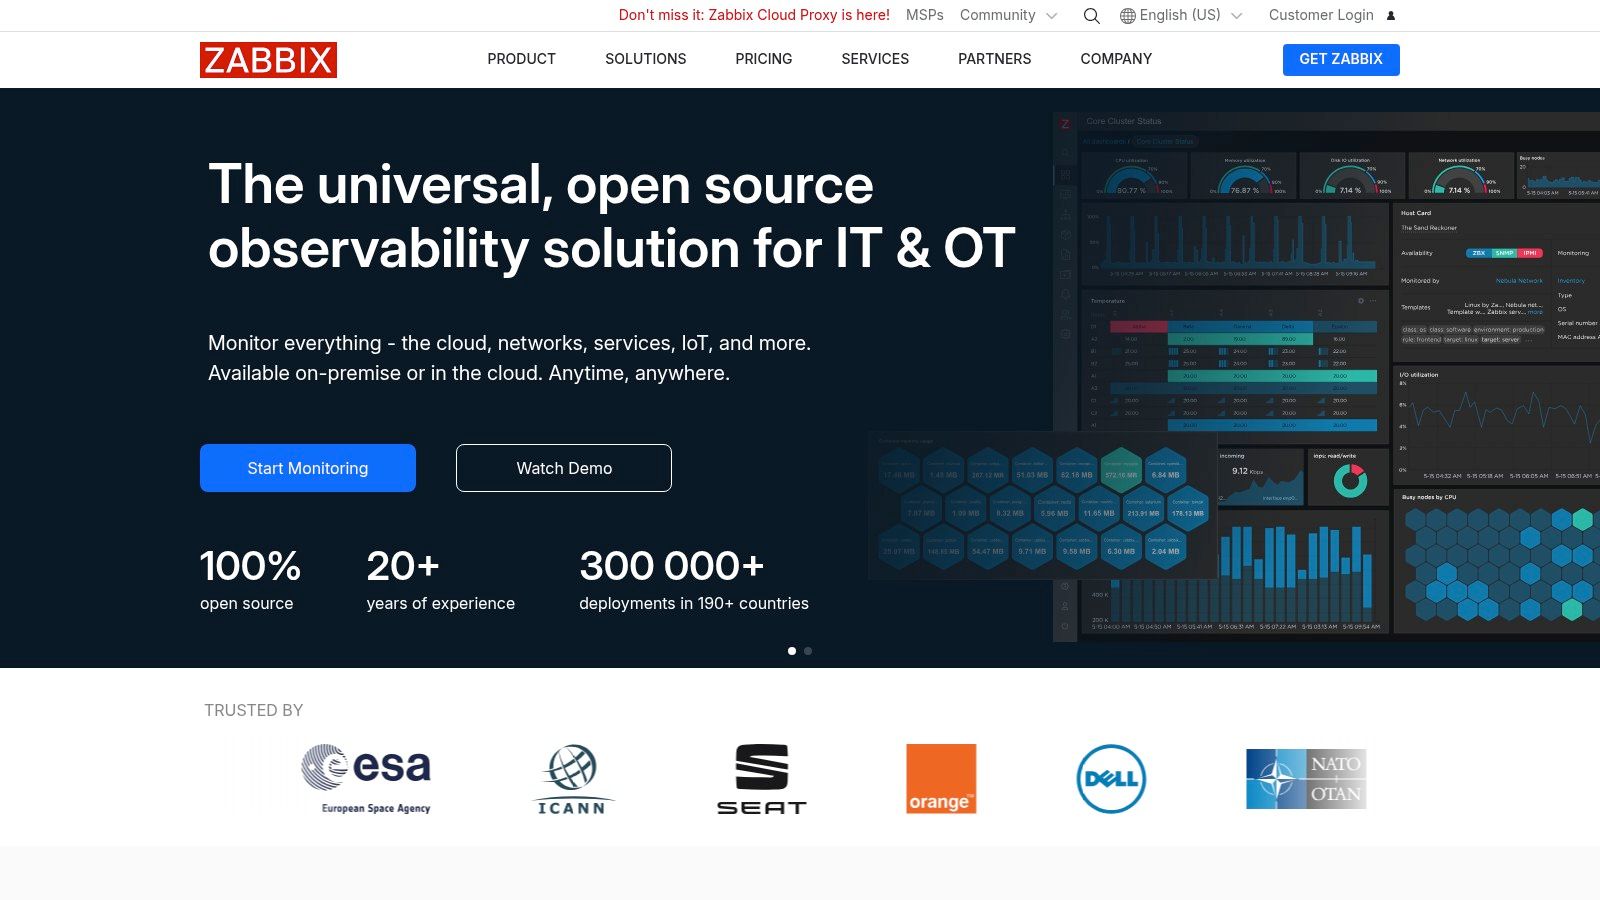
Zabbix makes sense when control matters more than outsourcing operations. Its self-hosted, open-source model avoids device-based software licensing, but the team still operates the database, collection infrastructure, upgrades, and alert configuration.
SNMP polling and traps cover network equipment, while agents extend visibility into servers and services. Discovery and templates reduce repetitive onboarding work, provided the templates match the hardware and the team understands what they create.
The difficult work is rarely drawing the first graph. It's keeping discovered items relevant, trigger expressions understandable, and historical storage under control as the estate changes.
A free software license removes a procurement cost. It doesn't assign an owner for database growth, failed polling, or broken templates.
Migration and limitations
Prometheus users should expect a different configuration model built around items, templates, and triggers rather than scrape targets and query expressions. Existing Zabbix teams should consider whether template cleanup, better discovery rules, or support would solve their problems before committing to replacement.
Uptime-only users gain much deeper infrastructure coverage, but should budget for learning how collection, triggers, dependencies, and notifications interact.
- Strength: Network and server monitoring can share a self-managed platform with extensive customization.
- Cost structure: Infrastructure, staff time, and optional commercial services replace per-device license growth.
- Limitation: Flexibility creates ongoing configuration responsibility. Poorly governed discovery can produce more data and alerts than operators need.
Best fit: Linux-capable infrastructure teams, technically engaged hosting providers, and homelab operators willing to maintain monitoring as a production service.
5. Datadog Network Monitoring
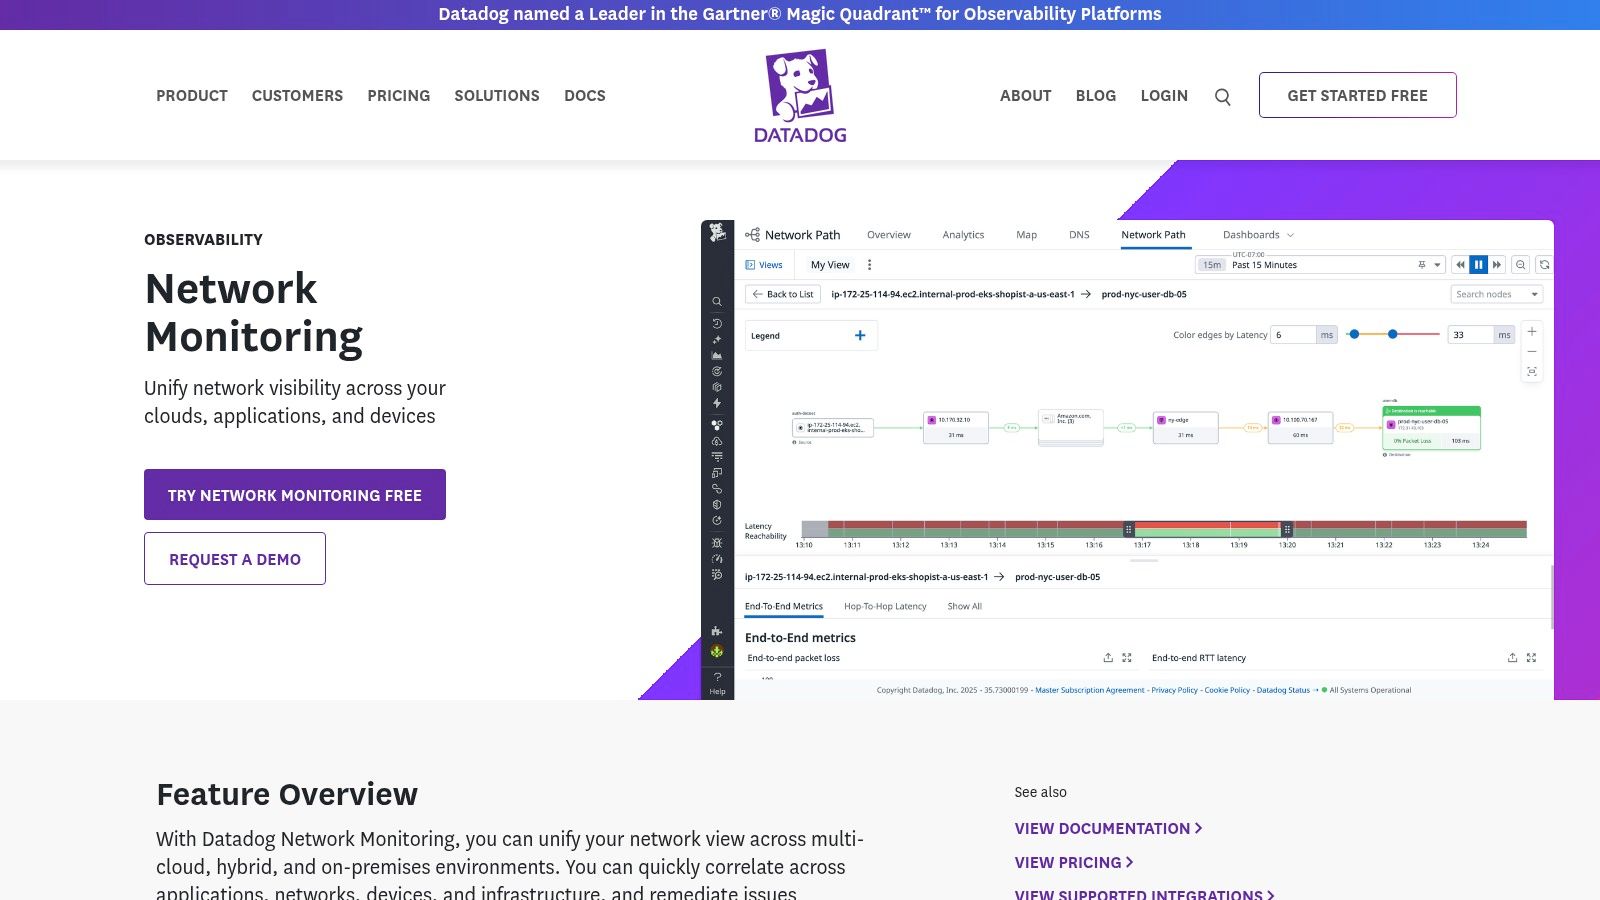
A cloud team investigating service-to-service latency has different needs from an operator troubleshooting a switch uplink. Datadog Network Monitoring addresses those environments through distinct network products inside a broader observability platform.
Its strongest fit is a team that benefits from network context beside application and infrastructure telemetry. Cloud traffic analysis, SNMP device monitoring, and network-path views answer related but different questions.
The buying decision should follow those questions. Physical device health doesn't establish that a cloud service communicates correctly, and traffic visibility doesn't replace every device-management capability.
Migration and billing boundaries
Prometheus migrations require an inventory of custom metrics, labels, dashboards, and alert expressions. Some workloads may remain better served by existing instrumentation even when network investigations move into Datadog.
Zabbix users should validate device profiles and operational alerts against representative hardware. Uptime-only users need to distinguish external synthetic coverage from internal network telemetry rather than assume either replaces the other.
- Strength: Operators can investigate network symptoms in the context of the wider application stack.
- Pricing unit: Device monitoring, cloud network monitoring, and path testing use different billing units. Forecast the combined product mix rather than multiplying a single headline rate.
- Limitation: A broad commercial platform can be excessive for basic SNMP health checks or a small, stable network.
Best fit: Cloud-native and hybrid teams already committed to Datadog, or teams whose incidents repeatedly require correlation across network and application boundaries. Dedicated network management requirements still deserve their own evaluation.
6. ManageEngine OpManager
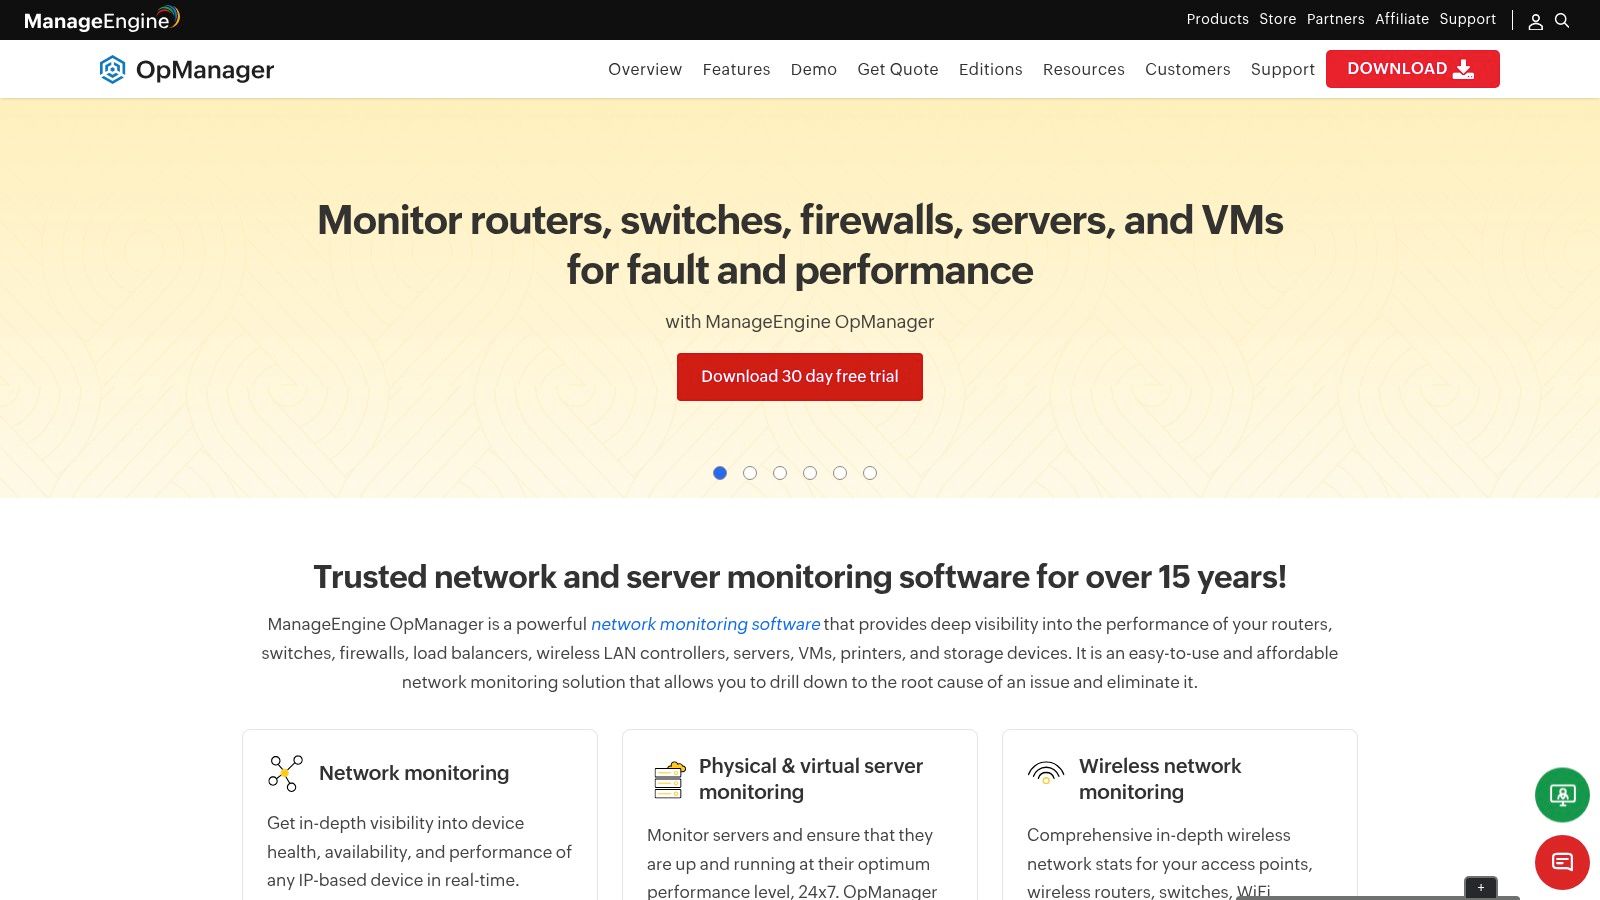
OpManager is worth considering when device-based licensing matches the estate better than sensor-based licensing. A network with many useful measurements per device deserves a different cost calculation from a fleet dominated by lightly monitored endpoints.
ManageEngine OpManager is a self-hosted platform for routers, switches, firewalls, servers, and virtual infrastructure. Discovery, interface monitoring, dashboards, reports, and workflow automation address general IT operations rather than only application-centric observability.
Its edition structure matters. A central installation and a distributed deployment have different operational requirements, and advanced management functions may involve separate add-ons.
Practical fit and migration
For Prometheus users, OpManager can take responsibility for traditional device monitoring while application metrics remain in the existing stack. Zabbix users should compare device templates, trigger behavior, and distributed polling arrangements before moving production alerts.
Uptime-only migrations need both internal device checks and service-level tests. A reachable router doesn't establish that the application behind it works.
- Strength: Device-oriented licensing makes the commercial unit easier to relate to an equipment inventory.
- Cost pressure: Additional devices increase the licensed estate, while add-ons can change the total even when device count stays stable.
- Limitation: Flow analysis, configuration management, and other advanced requirements need explicit edition and add-on review.
Best fit: Small-to-midmarket IT teams that want a conventional network monitoring console and can operate it internally. It's less attractive when the main objective is eliminating monitoring-server maintenance or preserving a highly customized metrics-as-code workflow.
7. Auvik
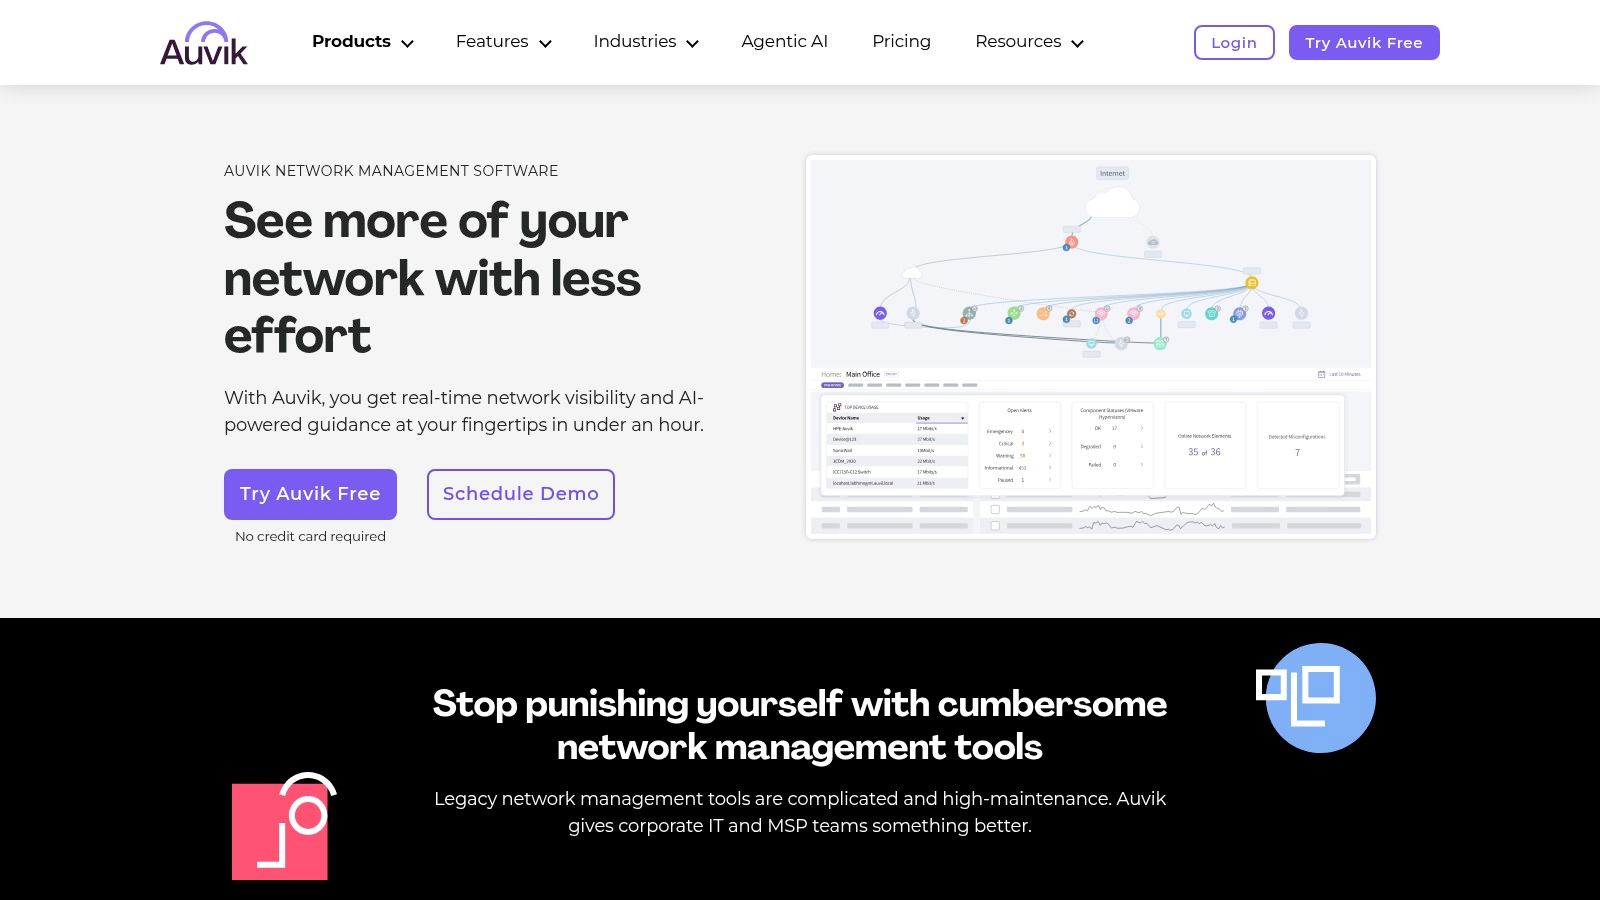
For an MSP inheriting an unfamiliar customer network, discovery and a current topology map can matter more than a highly customizable dashboard. Auvik centers its cloud-managed approach on discovering network equipment and maintaining useful network context.
A local collector gathers information while the hosted platform provides centralized visibility. That suits teams managing separate customer sites without operating a central monitoring application themselves.
Performance and traffic visibility help turn the map into an operational tool. The map alone isn't the outcome; operators still need usable credentials, meaningful alert rules, and a clear escalation owner for each site.
Migration and limitations
Before onboarding, classify the network devices that need monitoring. Switches, routers, firewalls, and general endpoints don't necessarily have the same monitoring requirements or billing treatment.
Prometheus teams can move device discovery and network investigations into Auvik while retaining application metrics. Zabbix teams should compare discovered coverage and alert ownership rather than attempt a literal template translation. Uptime-only teams gain internal network context, but still need to assess server and application coverage separately.
- Strength: Cloud management and multi-site visibility align well with MSP operating models.
- Pricing unit: Billable devices drive custom pricing. The quote should distinguish billable equipment from discovered categories that aren't charged.
- Limitation: Network management focus doesn't make Auvik a complete replacement for server metrics, application observability, or external uptime monitoring.
Best fit: MSPs and distributed IT teams that prioritize discovery, topology, and customer-site visibility over a fully self-hosted console.
8. LogicMonitor
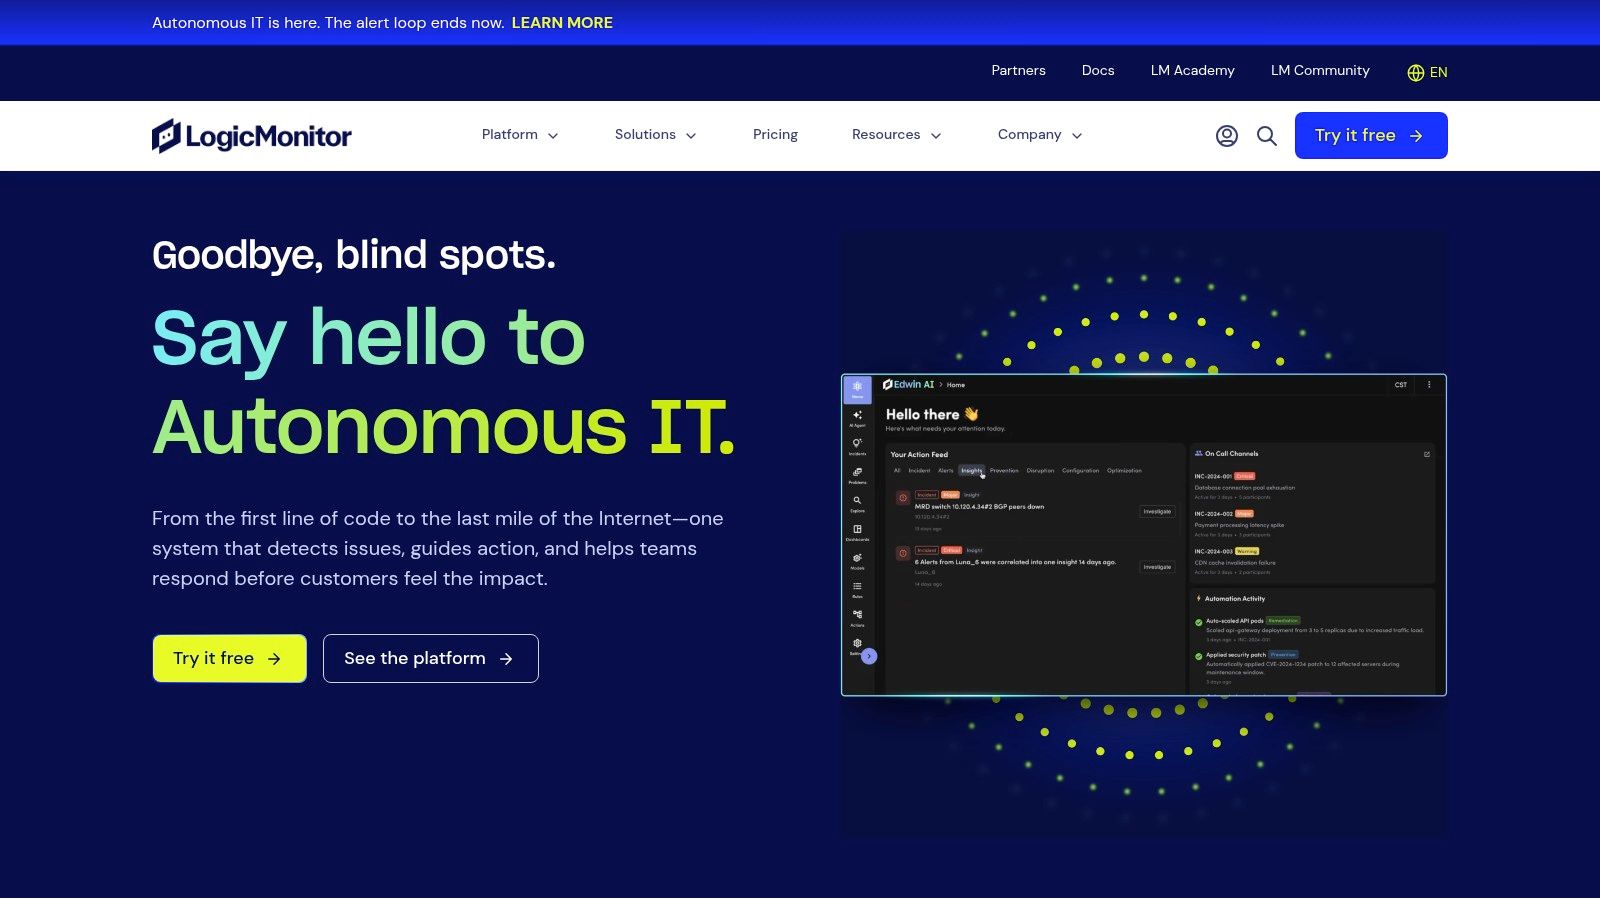
LogicMonitor targets the awkward middle ground between traditional network monitoring and hybrid infrastructure observability. It suits teams with meaningful on-premises and cloud estates that don't want to operate the central monitoring server.
Collectors and automated discovery gather telemetry, while the hosted platform centralizes dashboards and broader infrastructure context. That deployment model removes central-server administration, not every local operational responsibility.
Hybrid visibility is a real selection problem. EMA network-monitoring survey analysis reports that 42.0% of network teams find monitoring or observability tools struggle with public-cloud environments, supporting a pilot that includes cloud resources rather than only familiar switches.
Migration and capacity planning
For Prometheus users, separate infrastructure coverage from custom application metrics before planning consolidation. Zabbix migrations need equivalent discovery, thresholds, ownership, and historical context. Uptime-only users should verify outside-in service checks independently of device collection.
- Strength: A hosted platform can provide a shared operational view across heterogeneous infrastructure.
- Pricing unit: Hybrid Units vary by resource type. Capacity planning needs a resource-by-resource model rather than a simple device total.
- Limitation: Package boundaries, capacity allocation, and additional capabilities can complicate comparisons with narrower monitoring tools.
The practical cloud-based network monitoring question is where collection runs and who maintains each component. Best fit: Established hybrid operations teams that want centralized observability and can invest in collector design, onboarding standards, and commercial capacity planning.
9. LibreNMS
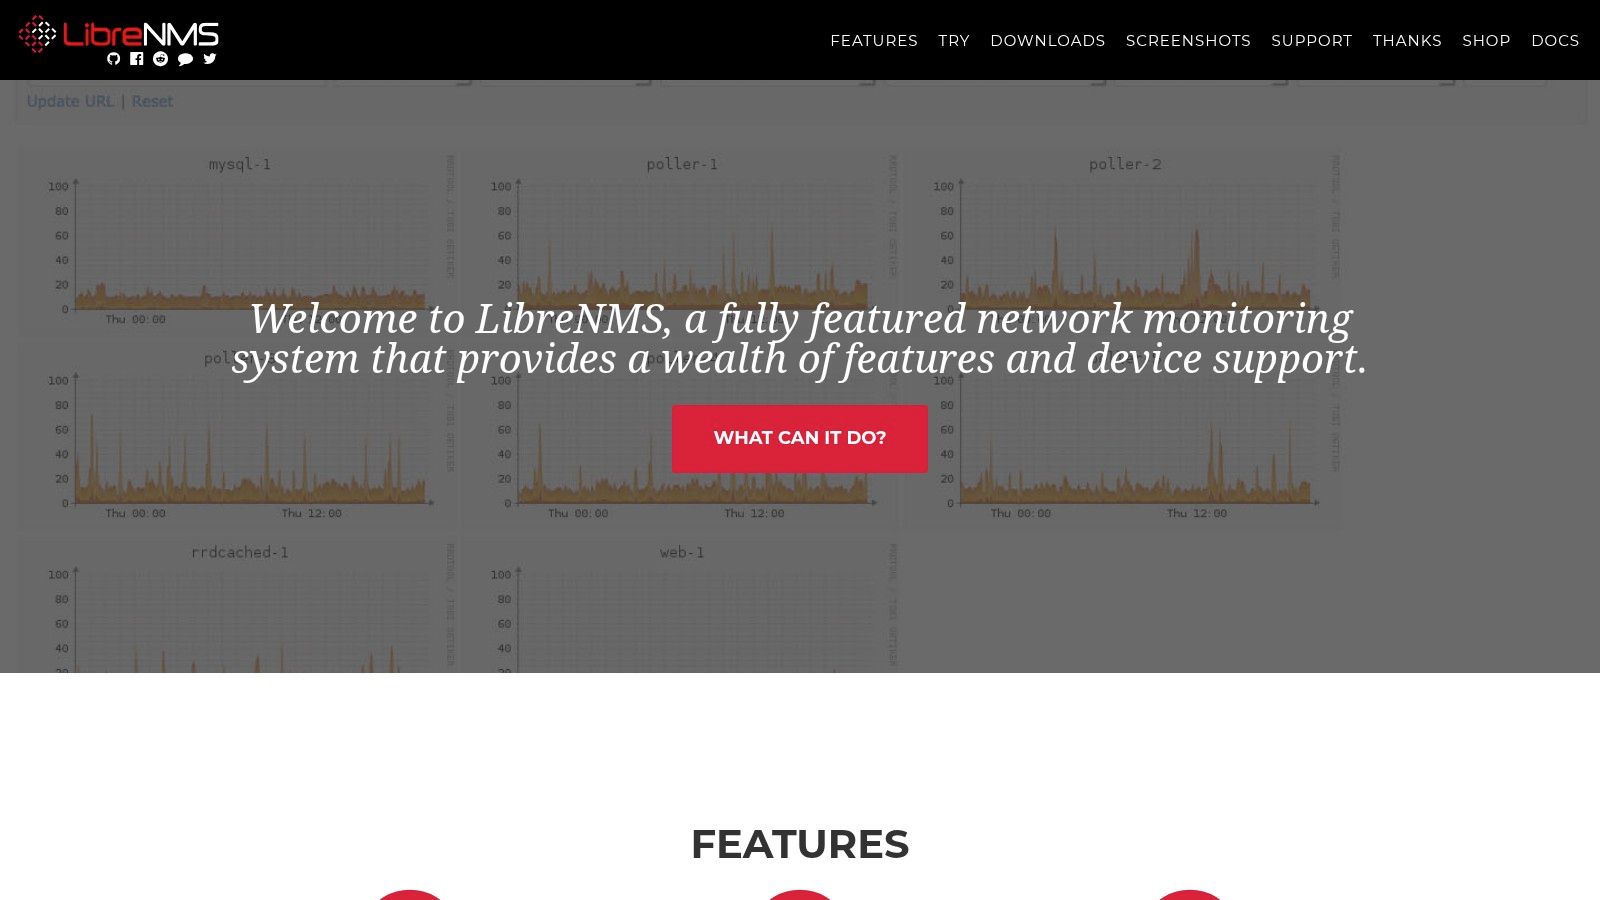
LibreNMS is a focused choice for self-hosted SNMP visibility without a commercial device license. It's particularly appealing when a network operator wants device discovery and interface history rather than a bundled enterprise observability platform.
LibreNMS is community-developed and supports a broad range of network hardware and operating systems. Its network-centric scope makes the deployment decision relatively clear: operate the platform internally and add other tools where deeper application or cloud context is required.
The important preparation is understanding SNMP and MIBs. Device reachability, permissions, and available counters determine the quality of collected information before dashboard preferences become relevant.
The useful graph is the one that includes the failing uplink, not the one with the most attractive dashboard layout.
Migration and limitations
Prometheus users can delegate device polling to LibreNMS while retaining their existing application metrics stack. That's a deliberate division of responsibility, not necessarily failed consolidation.
Zabbix users should identify server checks, scripts, and service monitoring that won't move naturally into a network-focused tool. Uptime-only users should retain public service checks while adding internal interface and device-health monitoring.
- Strength: Focused device monitoring avoids buying a broader commercial platform for an SNMP-first requirement.
- Cost structure: Hosting, storage, upgrades, and operator time replace vendor device-license charges.
- Limitation: Deployment assistance and troubleshooting depend substantially on documentation, community resources, and internal expertise.
Best fit: Network engineers, capable homelab operators, and infrastructure teams comfortable owning a self-hosted monitoring service.
10. OpenNMS
OpenNMS deserves attention when event and alarm management matter as much as device graphs. It's a candidate for technically capable teams managing larger or distributed networks, rather than a shortcut to lightweight uptime checks.
OpenNMS combines network discovery, monitoring, and event handling with open-source deployment options and commercial services. Its appeal is the ability to build a self-managed operational system around network events, with vendor involvement available where required.
That flexibility needs clear requirements. A team should define what constitutes an event, when it becomes an actionable alarm, and who owns the response before configuring a large deployment.
Migration and operational limits
Prometheus users should translate operational intent rather than copy alert expressions mechanically. Event-oriented workflows and time-series alert rules aren't interchangeable models.
Zabbix teams need a deliberate mapping of discovery, monitoring, dependencies, and notifications. Uptime-only teams should establish whether they need this level of event management at all; a demanding platform won't automatically improve a simple availability workflow.
- Strength: Self-management and customization suit organizations with established monitoring engineering capacity.
- Cost structure: Community software avoids a license charge, but commercial services, infrastructure, and internal engineering affect overall cost.
- Limitation: Setup and ongoing operation can be demanding. Feature and support requirements must match the selected offering.
Best fit: Large or distributed network teams prepared to invest in configuration, event design, and platform ownership. A small team seeking immediate visibility without maintenance has a stronger reason to choose hosted software.
How the leading network monitoring tools differ on deployment, published pricing and best fit
Deployment and pricing models shape the work a monitoring tool demands. This comparison shows which tools are self-managed, which are hosted, and the teams each option suits.
| Item | Deployment | Published pricing | Free option | Best fit |
|---|---|---|---|---|
| Fivenines | Hosted SaaS with an open-source agent | Starts at €9/month | Trial available, no credit card required | Teams combining server metrics, SNMP network monitoring, uptime checks, and cron tracking |
| Paessler PRTG Network Monitor | Self-hosted or hosted | Sensor-based pricing | Free edition for up to 100 sensors | Teams needing broad monitoring and device discovery |
| SolarWinds Network Performance Monitor (NPM) | Self-hosted | Quote-based or license pricing | Fully functional trial | Enterprise network operations and troubleshooting |
| Zabbix | Self-hosted; cloud service also available | Free self-hosted software | Free, with no monitored-device limit | Technical teams seeking customizable network and server monitoring |
| Datadog Network Monitoring | Cloud-based observability platform | Usage-based, with host, test, and device pricing | Product-suite trial | Teams correlating network, infrastructure, and application telemetry |
| ManageEngine OpManager | Self-hosted | Device-based pricing | Free edition for up to 3 devices | Teams seeking device-based network and infrastructure monitoring |
| Auvik | Cloud-managed | Custom pricing based on billable devices | Full-feature trial | IT teams and MSPs managing multiple networks |
| LogicMonitor | SaaS with collectors | Hybrid Unit-based pricing | No free option specified | Teams monitoring hybrid infrastructure and networks |
| LibreNMS | Self-hosted | Free | Free and open source | Teams seeking community-supported, SNMP-focused network monitoring |
| OpenNMS | Self-managed; commercial services available | Community software is free; commercial pricing is quote-based | Free community software | Technically capable teams monitoring large or distributed networks |
Fivenines starts at €9 per month and offers a trial without requiring a credit card. Its hosted platform brings server metrics, SNMP device monitoring, uptime checks, and cron tracking into one dashboard. Teams moving from Prometheus can consolidate those monitoring tasks, while those leaving an uptime-only service can add server and network visibility. The trade-off is a hosted model rather than self-managed infrastructure.
PRTG's sensor-based model makes the number of monitored checks relevant to cost as coverage grows. Datadog and LogicMonitor also tie pricing to usage units, while Auvik uses billable devices. Zabbix and LibreNMS avoid software license costs for self-managed deployments, but teams take on platform operation. Migration effort depends on how much existing configuration and alerting needs to be recreated.
Matching Your Monitoring Tool to Your Team, Budget and Migration Path
The best network monitoring software is the platform a team can operate reliably, afford as coverage expands, and trust during an incident. Deployment ownership should narrow the shortlist before dashboard preferences or specialized features enter the discussion.
Self-hosted open-source tools fit teams with spare operations capacity. Zabbix offers broad infrastructure monitoring, LibreNMS emphasizes network-device visibility, and OpenNMS supports more involved event-driven operations. Their license models don't remove responsibility for storage, upgrades, backups, or monitoring the monitoring system.
Hosted SaaS fits teams that want less central-platform maintenance. Auvik emphasizes network discovery and multi-site operations, LogicMonitor addresses broader hybrid estates, and Datadog is compelling when application correlation matters. Hosted deployment alone doesn't guarantee predictable costs; the bill still depends on devices, hosts, checks, or resource units.
Choose the operating model before the feature bundle
- Lean DevOps or hosting team: Favor consolidated server, SNMP, uptime, and cron visibility when maintaining separate tools consumes engineering attention.
- Windows-oriented IT department: Evaluate PRTG's sensor model against OpManager's device-oriented licensing using actual monitoring configurations.
- Dedicated enterprise network team: Consider SolarWinds NPM or OpenNMS when diagnostic depth, event handling, and customization justify platform ownership.
- Existing observability customer: Test whether adding network coverage to the incumbent platform is operationally simpler than introducing another console.
Consolidation needs measurable benefits. Enterprise Management Associates' network-observability study found that 87% of enterprises use multiple network-observability tools, while only 43% report being completely successful with them. A replacement should retire duplicate collectors, dashboards, or alert routes without creating new blind spots.
Alert quality deserves equal weight. Network World's reporting on network operations cites findings that only 37% of alerts generated by network-monitoring tools indicate a real problem. A pilot should therefore record false alarms, duplicate notifications, useful recovery messages, and whether operators can identify the affected service.
Make migration a coverage exercise
ManageEngine's State of Observability study found 50.2% of organizations were still in the early stages of observability maturity. Dependable collection and actionable thresholds deserve priority over advanced features that the team isn't ready to operate.
The concrete next step is an inventory of current monitors, SNMP device types, custom metrics, notification routes, and retention requirements. From that inventory, shortlist tools that match the deployment model and test controlled device, DNS, HTTP, and scheduled-job failures. Retire the old platform only after collection, paging, ownership, and rollback have been demonstrated.
Fivenines brings server metrics, SNMP network visibility, website uptime, and cron monitoring into a hosted dashboard, with an open-source server agent and automation support. Teams replacing fragmented infrastructure monitoring can visit Fivenines to evaluate their fleet's coverage and start a trial without a credit card.