Cloud Based Network Monitoring Guide

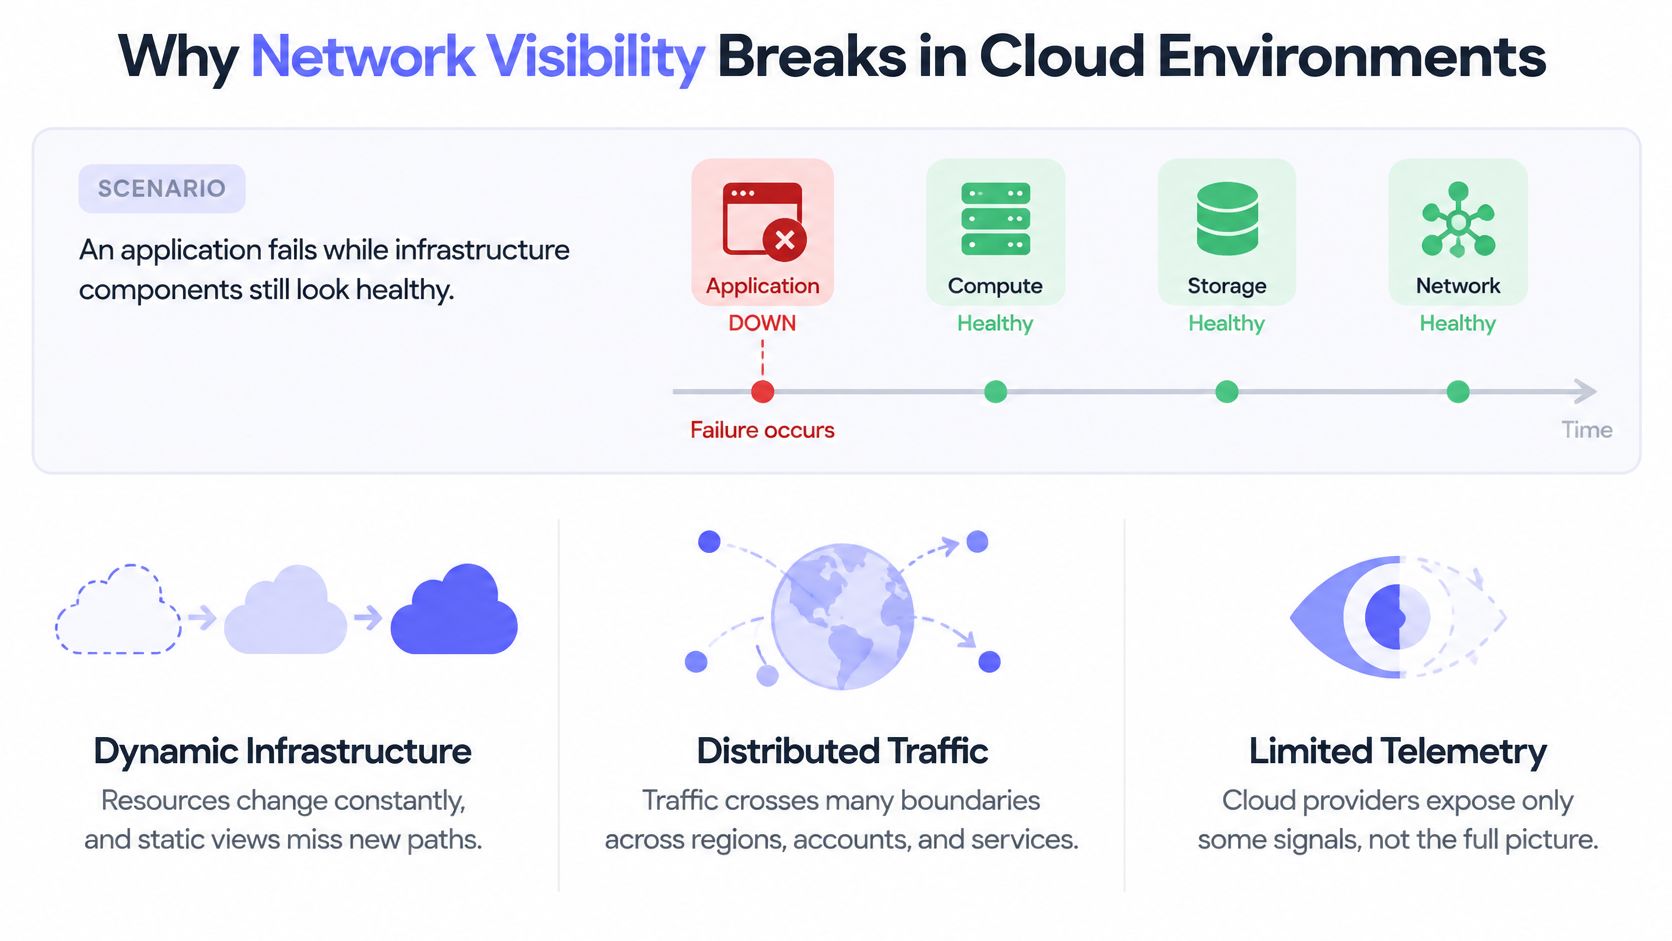
The application is unavailable, customers are opening support tickets, and the infrastructure dashboard is still green. The on-call engineer can see healthy servers, but can't tell whether the failure sits in DNS, a regional network path, a cloud dependency, or the application itself. Another dashboard won't necessarily answer that question.
Cloud based network monitoring should function as an operational decision system. Its value lies in helping operators decide what failed, which services are affected, who should respond, and what evidence supports the next action.
Table of Contents
- Why Network Visibility Breaks in Cloud Environments
- Understanding Cloud Based Network Monitoring
- How Monitoring Architectures Collect and Correlate Signals
- Selecting Signals and Alerting for Real Operations
- Comparing Cloud Deployment Models
- Cloud and On-Premises Monitoring Compared
- Protecting Telemetry and Meeting GDPR Expectations
- Evaluating Vendors and Planning Adoption
Why Network Visibility Breaks in Cloud Environments
Consider a hypothetical checkout service that stops responding for customers in a particular region. Its servers remain reachable from the internal network, and their CPU and memory charts look ordinary. An external availability probe fails, while an endpoint agent records connection errors to a downstream service.
Each observation answers a different question. Server health describes the machine's condition. Network reachability establishes whether a connection succeeds from a particular location. Application behavior describes whether the service completes useful work, while provider context helps operators assess whether a shared cloud dependency deserves investigation.
The distinction matters because a healthy machine isn't proof of a usable service.
Different views of the same incident
In this scenario, flow records might show attempted connections to the dependency, while probes from unaffected locations continue succeeding. Those observations would justify investigating a regional path or dependency before restarting healthy application servers. They wouldn't, by themselves, prove the root cause.
The visibility problem spans changing resources, distributed paths, and incomplete observations.
A 2025 SANS multicloud survey announcement reported that 76% of enterprises operate multicloud environments, nearly half lack centralized visibility and control, 63% identify complexity as their primary challenge, and 80% use third-party tools to compensate for native-service gaps.
Those findings don't establish that another tool automatically solves the problem. A shared screen can still contain disconnected evidence.
A unified dashboard is a presentation choice. Unified visibility requires comparable evidence and a shared incident context.
For an operations team, the useful distinction is between collecting symptoms and supporting decisions. A monitoring design should help distinguish a local connection failure from a service-wide incident, identify the responsible owner, and preserve enough evidence to test a diagnosis. Without that foundation, engineers can spend an incident comparing green and red tiles that describe different things.
Understanding Cloud Based Network Monitoring
A useful analogy is a control room. Operators need instruments, but they also need an agreed view of the environment, reliable communications, and procedures for responding when observations disagree.
Cloud based network monitoring combines those functions for connectivity and service delivery. The term can describe a cloud-hosted monitoring platform, monitoring of cloud-connected environments, or both. Those meanings shouldn't be confused: the location of the dashboard doesn't determine which network paths it can observe.
The complete monitoring loop
The operating model begins with identifying important assets and dependencies. A service record should connect its endpoint to the systems it relies on and the team responsible for restoring it. Collectors then gather observations, transport them to an analysis layer, and retain the context needed for investigation.
The control-room model makes that loop explicit.
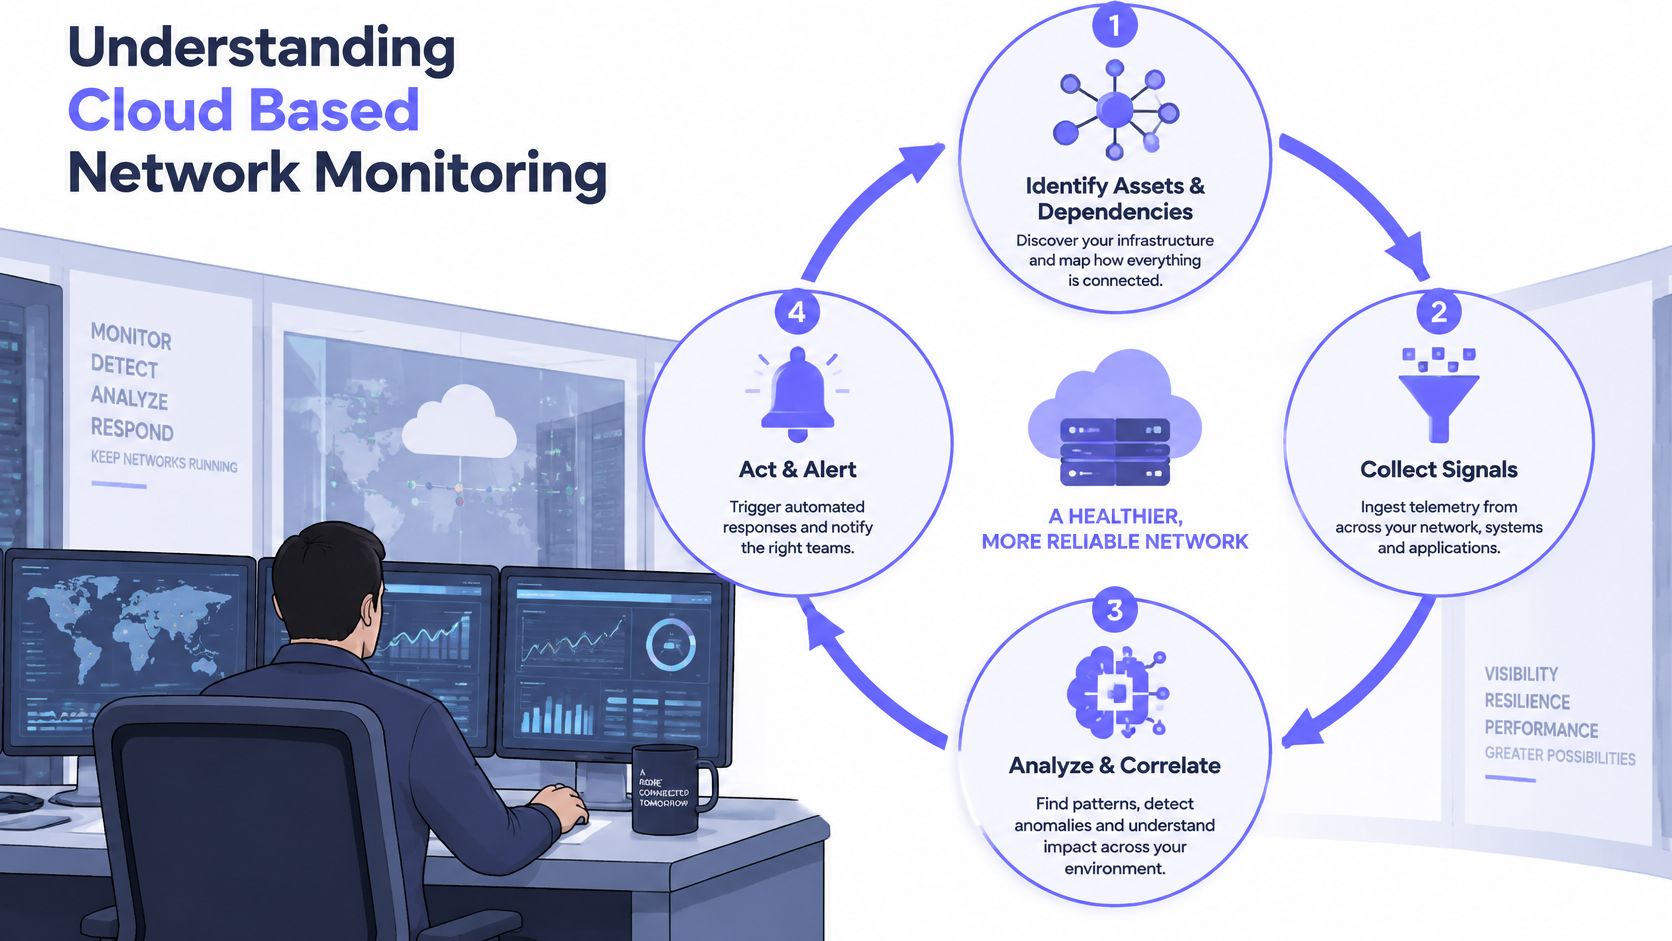
The essential activities are connected, rather than independent features:
- Identify dependencies: Record which connections support a business service, including external services outside the team's direct control.
- Collect observations: Gather enough evidence to assess those connections without assuming every instrument sees the same conditions.
- Interpret results: Compare observations with service expectations and confirm whether an abnormal result requires action.
- Route and resolve: Notify the responsible owner, attach diagnostic context, and verify recovery after intervention.
An alert without an owner leaves the control room with a ringing telephone and nobody assigned to answer it.
Distinguishing the components
A hosted platform provides the remote analysis and operating interface. A collector gathers observations near the monitored resources. Provider telemetry supplies measurements or records generated within a cloud environment. A hybrid arrangement combines local collection with remote processing.
This separation helps teams discuss architecture precisely. “Cloud monitoring” shouldn't become shorthand for assuming that every component lives outside the customer's network.
The transition has also been incremental. A 2020 Enterprise Management Associates study found that 71% of enterprises were interested in collecting streaming network telemetry, generally as an enhancement to SNMP rather than an immediate replacement.
For broader context, NZ Apps' discussion of the benefits of cloud networking offers a companion perspective on the networking choices that monitoring must support. The practical requirement remains narrower: operators need a complete observation-to-response loop, not a hosted view of infrastructure.
How Monitoring Architectures Collect and Correlate Signals
A useful architecture separates signal generation, collection and transport, and interpretation. This separation lets engineers investigate whether a missing measurement represents a failed service or a failed monitoring path.
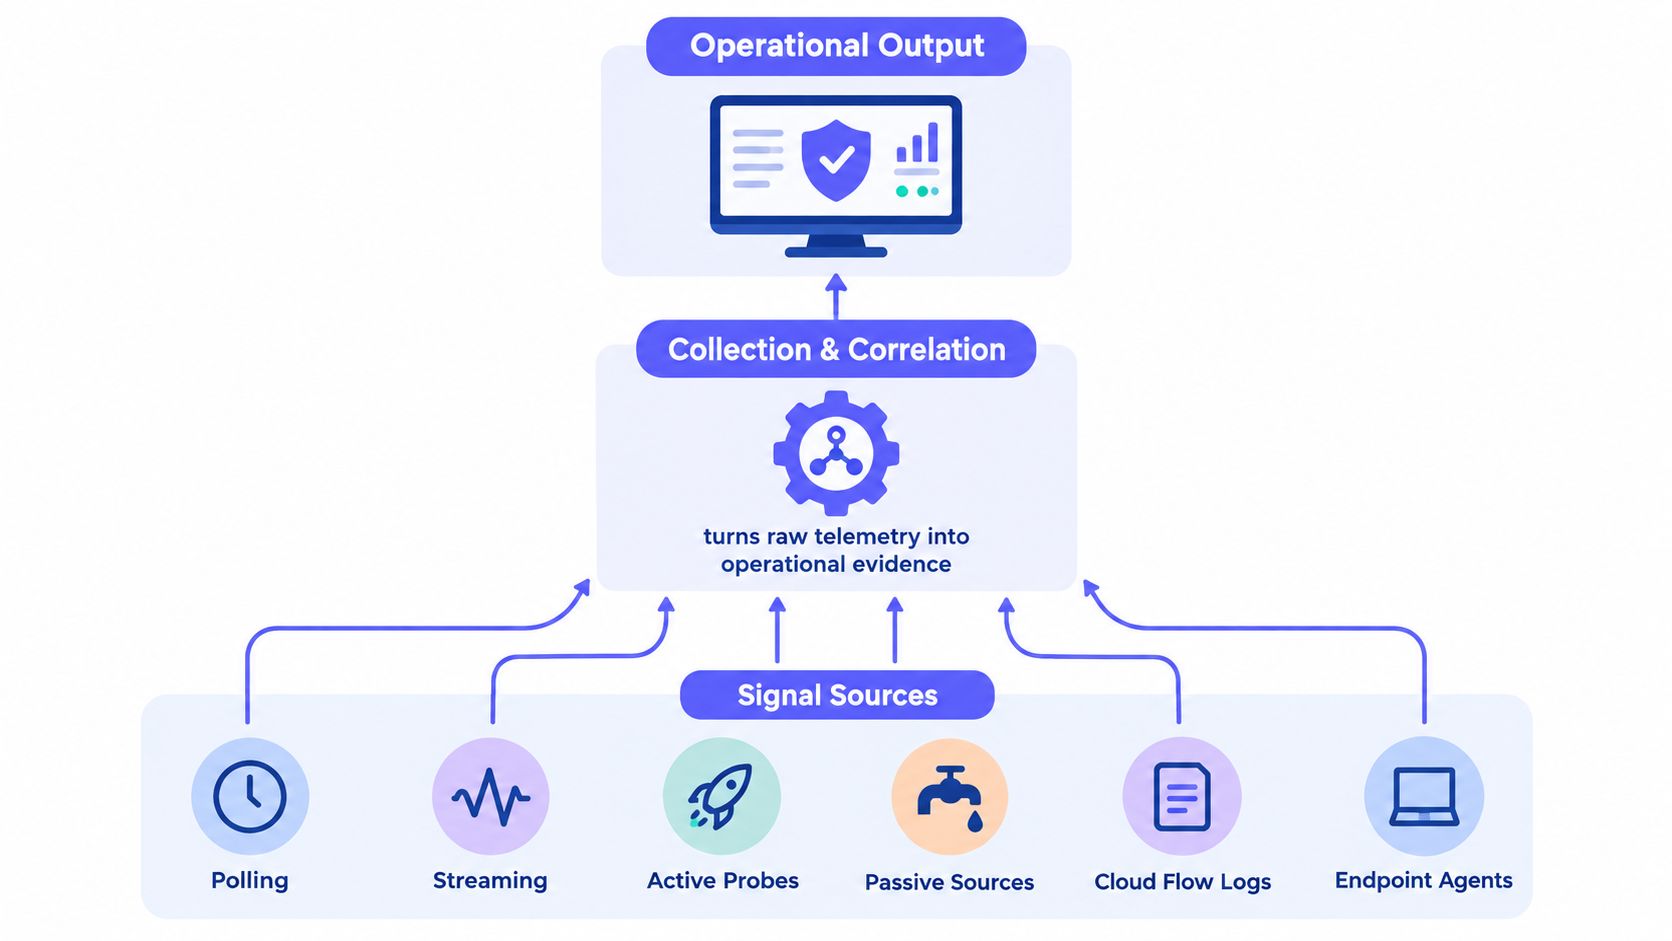
The architecture below groups the collection methods before showing their operational output.
Matching collection methods to questions
Polling asks a device for measurements at intervals. Streaming telemetry lets devices publish measurements through mechanisms such as NETCONF/YANG Push or gRPC, rather than waiting for repeated requests. Both can contribute to the same design; collection method alone doesn't establish diagnostic quality.
The remaining sources provide different perspectives:
- Active probes: Deliberately test a connection or service operation from a known location.
- Passive sources and flow records: Describe observed communications rather than generating a test transaction.
- Endpoint agents: Supply observations from the workload's side of a connection, including conditions that external checks can't directly inspect.
Event notifications also need a place in the architecture. An explanation of how an SNMP trap works helps distinguish device-originated notifications from measurements collected on request. Engineers should preserve that distinction when interpreting event timing.
Normalization before correlation
Combining AWS, Azure, Google Cloud, and private infrastructure requires more than matching chart labels. A common data model should preserve service identity, account, region, resource identity, measurement units, observation time, and collection method. Missing data must remain distinguishable from a measured zero.
Otherwise, engineers might compare a regional average with a host-level measurement and mistake the difference for a fault. Dependency context matters just as much: observations become useful when operators can associate them with the same service path.
The cross-domain topic of water operations data integration from WaterJobsIntel.com offers a useful parallel for thinking about data handoffs. In network operations, teams should likewise define the meaning of incoming records before combining them.
Selective collection and failure evidence
A University of Melbourne cloud-monitoring study found that deeper collection or higher sampling frequency can improve visibility while increasing overhead and reducing scalability. Its findings support treating collection depth as an engineering trade-off, not a setting that should always be maximized.
For example, a failed regional probe accompanied by successful probes elsewhere supports a different investigation from widespread failures with matching endpoint errors. If unrelated measurements all stop arriving together, engineers should investigate the collection pipeline before declaring every service unavailable.
The accompanying video provides an additional visual reference for monitoring architecture.
Selecting Signals and Alerting for Real Operations
Start with the decisions an operator must make during an incident. Can customers reach the service? Is the underlying infrastructure under pressure? Which connection or dependency deserves investigation? Each retained signal should help answer a named question.
NIST's network-monitoring guidance connects network visibility with detecting adverse events, unauthorized connections, attacks, and performance degradation. It also explains why network data must augment logs from devices that log poorly or not at all.
A minimum viable signal set
A practical baseline combines infrastructure measurements, independent availability tests, and passive or endpoint-derived connection evidence. These categories establish a starting point for platform evaluation without making full packet capture a prerequisite.
The signal checklist should connect each observation to an operating rule.
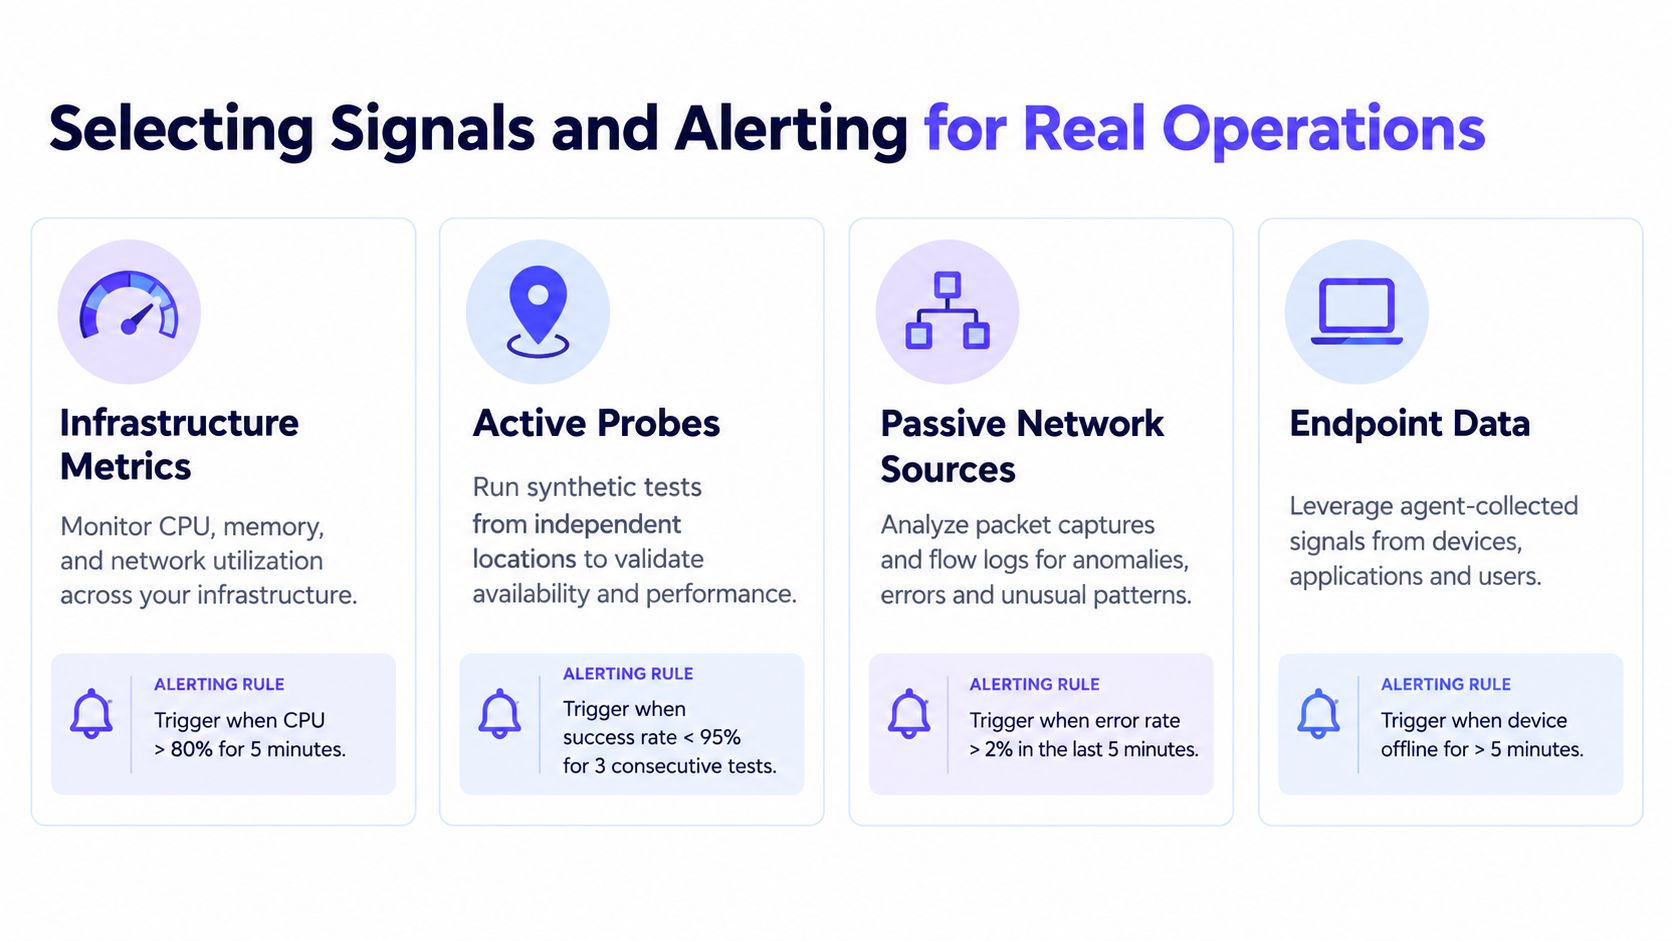
- Infrastructure measurements: Use CPU, memory, interface errors, and network utilization to investigate resource and device conditions.
- Independent probes: Test DNS, TCP, HTTPS, or ICMP behavior from locations relevant to service users.
- Connection evidence: Select flow records or endpoint telemetry to investigate communication patterns and dependencies.
- Targeted diagnostic additions: Enable packet capture, application telemetry, or audit events when a specific investigative question justifies them.
For example, packet loss detection belongs in a diagnostic workflow that also considers the affected path and service behavior. An isolated loss observation shouldn't automatically trigger the same response as confirmed customer-facing failure.
Turning observations into accountable alerts
Every monitor needs an owner, an expected response, and a clear distinction between warning and paging. A warning can request investigation during routine operations. A page should indicate a condition that warrants interrupting the responsible operator.
Practical rule: An alert should explain the affected service, the confirming evidence, the assigned owner, and the next investigative action.
Timestamp synchronization and durable buffering belong in the operating requirements. Without reliable event ordering or continuity through collector interruptions, incident reconstruction becomes uncertain.
Retention should follow diagnostic value. Teams might retain summarized trends for capacity decisions while preserving detailed evidence only for an appropriate investigation window. Collection, transport, storage, and analyst attention all belong in the telemetry budget.
Finally, review alerts after incidents. Track whether pages led to useful action, whether related symptoms were grouped sensibly, and whether important failures escaped detection. Expanding collection makes sense only when the added evidence improves those outcomes.
Comparing Cloud Deployment Models
Deployment selection begins with a boundary question: where may raw telemetry be processed, and who will operate that processing layer? The answer can differ across environments within the same organization.
The deployment model is independent of the underlying instruments. A hosted service can receive local device measurements, while a privately operated platform can ingest cloud-provider records.
Choosing the processing boundary
| Model | Processing arrangement | Main evaluation question |
|---|---|---|
| Managed SaaS | A provider operates the central monitoring backend | Can the service handle required data and integrations within acceptable boundaries? |
| Hybrid collector | Local components gather or prepare data for a remote backend | What remains local, and what leaves the environment? |
| Private cloud | The organization operates monitoring in its controlled cloud environment | Can the team maintain the platform and its dependencies? |
| On-premises | Monitoring runs on organization-managed infrastructure | Can the installation remain available during the failures it must observe? |
Managed SaaS suits teams that want to delegate backend operation, provided the service exposes the controls and evidence they need. Evaluation should cover configuration portability, collection permissions, export options, and the division of responsibility during a monitoring outage.
A hybrid collector provides a separate local collection boundary. That can be useful when devices aren't directly reachable from outside or when raw observations need preparation before transmission. Engineers should examine collector credentials, update procedures, local buffering, and behavior during disconnection.
Control also creates responsibilities
Private-cloud monitoring places the platform inside an organization-controlled cloud environment. This offers architectural choice, but the team still needs to operate storage, upgrades, access controls, backups, and recovery. A private deployment isn't maintenance-free because its infrastructure is virtual.
On-premises monitoring keeps processing within an organization-managed site. Its suitability depends on available capacity, internal expertise, and resilience beyond the monitored failure domain. A monitoring server that loses power alongside the production systems can't independently confirm their condition.
For teams comparing service arrangements, a review of cloud monitoring services can support the initial shortlist. The more revealing exercise is to draw the collection, processing, storage, and notification boundaries for each candidate.
Cost evaluation should follow that drawing. Compare subscription obligations, collector infrastructure, integration work, and staff responsibilities rather than treating the license as the entire deployment cost. The preferred arrangement is the one the team can operate safely and sustain as requirements change.
Cloud and On-Premises Monitoring Compared
The central cloud-versus-on-premises decision concerns operational responsibility and acceptable data boundaries, not whether one dashboard looks more modern. Both approaches need credible coverage, usable evidence, and a response process.
Research discussed in Palo Alto Networks' overview of evolving data-security practices identifies network complexity as a leading packet-monitoring obstacle, alongside inconsistent cloud capabilities, skills shortages, cost, and scalability challenges. Moving the monitoring backend doesn't remove those underlying constraints.
Cloud and on-premises monitoring decision factors
| Decision factor | Cloud deployment | On-premises deployment |
|---|---|---|
| Deployment work | Backend provisioning may be handled by the provider | The team provisions and prepares the platform |
| Remote access | Review hosted identity and access controls | Design secure operator access to the installation |
| Hardware and capacity | Review service limits and collector needs | Plan processing, storage, and replacement capacity |
| Maintenance | Confirm which updates the provider owns | Assign patching, upgrades, backups, and recovery |
| Customization | Validate supported extensions and exports | Assess available customization and its maintenance burden |
| Network exposure | Review outbound transport and external dependencies | Review internal reachability and administrative access |
| Data residency | Establish processing, support, and backup locations | Establish local storage and any external support paths |
| Operating cost | Examine billing dimensions and growth scenarios | Include infrastructure, staff time, and lifecycle work |
| Multicloud consistency | Test normalization rather than assuming it | Build or validate equivalent normalization processes |
The comparison should include the work that doesn't appear on a purchase order. An internally operated stack needs someone to troubleshoot ingestion failures, plan storage, test upgrades, and restore the system when it breaks. Those responsibilities persist even when the software has no license charge.
Cloud services introduce a different risk: a restrictive product can make an important investigation impossible. Limited exports, unavailable raw context, or inflexible alert behavior deserve scrutiny before adoption.
Conditions for choosing each approach
- DevOps and small operations teams: Favor a managed arrangement when backend maintenance would displace service-reliability work, provided required evidence remains accessible.
- MSPs and hosting providers: Prioritize tenant separation, repeatable configuration, customer-specific access, and a sustainable operating model.
- Regulated environments: Start with approved processing and access boundaries, then evaluate deployments that can demonstrably meet them.
- Teams requiring specialized analysis: Consider controlled deployments when necessary customization isn't available through a managed service.
A solo operator shouldn't inherit an elaborate monitoring estate merely to obtain basic availability evidence. Equally, a regulated organization shouldn't accept unsuitable processing boundaries because registration is simple.
The appropriate model is the one that satisfies the required control boundary with an operating burden the team can actually support.
Protecting Telemetry and Meeting GDPR Expectations
More telemetry isn't automatically better visibility. Detailed collection can expose sensitive content without improving the operator's ability to distinguish a network fault from an application error.
Encryption makes this trade-off especially important. NIST's TLS visibility guidance explains that TLS 1.3 always provides forward secrecy, unlike TLS 1.2, where it is optional. A monitoring design therefore can't rely on collecting long-lived server keys and using them to decrypt previously captured sessions.
NIST also notes that lost encrypted-traffic visibility can impair performance monitoring, logging, diagnostics, and incident response. The engineering response is to choose appropriate observation points, not assume that all traffic must be decrypted.
Separate data by operational purpose
A useful review distinguishes metadata, endpoint observations, and inspected content:
- Encrypted flow metadata: Use for traffic-volume, availability, and connection-level analysis where the available records support it.
- Endpoint or proxy telemetry: Collect application errors and connection outcomes near the systems that can observe them.
- Narrowly scoped decrypted content: Require a documented security or regulatory justification, controlled inspection points, and restricted access.
This separation allows engineers to investigate service behavior without automatically granting every monitoring user access to payload content. It also gives security reviewers a clearer account of why each data class exists.
NIST describes approaches that retain raw or decrypted traffic only long enough for security analysis and then destroy it. The corresponding operational principle is purpose-limited retention, with explicit procedures for preserving necessary incident evidence.
Review the entire telemetry route
A GDPR-aware assessment should document the route from collection to deletion, including less obvious destinations such as alert messages, support attachments, and exported incident records. Hosting location alone shouldn't substitute for that review.
The review checklist should include:
- Collection authority: Document permissions, service accounts, and why each collector needs access.
- Protection controls: Review encryption in transit and at rest, credential handling, and least-privilege access.
- Processing locations: Identify storage, backup, support, and onward-processing arrangements.
- Responsibilities: Establish controller and processor roles, contractual expectations, and the process for obtaining legal review.
- Evidence lifecycle: Define deletion, investigation holds, access auditing, and removal of unnecessary sensitive fields from alerts.
These are assessment questions, not a claim that a particular configuration establishes compliance. The broader practice of cloud security monitoring should connect incident detection with these handling controls.
A collector can be technically effective and still be inappropriate for a particular dataset. Approval should depend on the evidence collected, its purpose, and its full lifecycle.
Evaluating Vendors and Planning Adoption
A vendor evaluation should begin with a representative service topology and explicit acceptance criteria. A polished demonstration can show that a product displays data; it can't establish whether the team will make better decisions during its own incidents.
The most useful comparison is a weighted scorecard. Teams should assign greater importance to requirements that determine operational or governance acceptability, rather than giving every feature equal influence.
Weight requirements before testing
| Evaluation area | Suggested priority | Evidence to request |
|---|---|---|
| Cross-cloud normalization | Critical for multicloud operations | Comparable fields with preserved provider context |
| Probe placement and confirmation | Critical for service availability | Relevant vantage points and explainable failure confirmation |
| Telemetry depth | High | Evidence sufficient for the team's recurring diagnostic questions |
| Alerting and integrations | High | Ownership, routing, escalation, and incident-context delivery |
| API and automation | High for fleet operations | Repeatable creation, change tracking, and export |
| Data handling | Mandatory acceptance gate | Processing boundaries, access controls, and retention behavior |
| Deployment choice | Requirement-dependent | Supported collection and processing arrangements |
| Pricing clarity | High | Explicit billing dimensions and foreseeable expansion costs |
| Support | Requirement-dependent | Clear responsibility and escalation procedures |
Mandatory controls should remain gates. A visually impressive interface shouldn't compensate for an unacceptable data-processing arrangement.
For an all-in-one platform, evaluators should also check whether server, device, website, and scheduled-job observations remain connected to the same service ownership model. Combining categories is useful only if operators can move between them without rebuilding incident context manually.
Test failures rather than screenshots
A controlled proof of concept should introduce a DNS or routing fault, a regional path issue, an application error, and a collector outage. These are test scenarios, not claims about observed customer results.
- Connection fault: Does the platform preserve evidence that directs investigation toward name resolution or routing?
- Regional degradation: Can operators identify the affected vantage points without declaring a universal outage?
- Application failure: Does successful connectivity remain distinguishable from unsuccessful application behavior?
- Collector interruption: Does the platform identify stale or missing telemetry instead of presenting it as healthy infrastructure?
Evaluators should record the evidence available, the actions required to reach a diagnosis, and any manual reconciliation between tools. Export and recovery testing deserve the same attention as initial setup.
Expand only after the baseline works
Adoption should start with a critical service, named owners, the minimum signal coverage, and agreed alert behavior. Operators should establish retention rules and document what constitutes successful detection and recovery confirmation before adding more sources.
Expansion should follow demonstrated gaps. If an incident exposes missing dependency evidence, add that evidence deliberately. If collection produces noise without changing decisions, revise or remove it rather than preserving it because the platform supports it.
Fivenines offers an all-in-one platform combining Linux server metrics, network device health, website uptime, and cron job tracking. Teams evaluating cloud based network monitoring can visit Fivenines and assess its collection, failure confirmation, and alert-routing capabilities against a representative service topology and the scorecard above.