What Is SLA Monitoring and Why It Matters in 2026


SLA monitoring continuously measures a service against its contractual commitments and checks whether the agreed terms are being met, rather than merely showing whether a service is up. For example, a commitment of 99.5% availability over 30 days permits approximately 3.6 hours of downtime in that period.
An on-call engineer sees a green uptime dashboard while customer tickets report that the checkout flow is failing. The service responds to basic checks, but customers can't complete the task they depend on. A useful monitor would reveal that mismatch and warn the team when reliability is deteriorating, before the contractual limit is crossed.
Table of Contents
- Why SLA Monitoring Matters for Modern DevOps Teams
- Understanding SLI, SLO, and SLA as Three Separate Layers
- The Metrics That Define an SLA
- Building a Measurement Setup That Holds Up in a Dispute
- Turning SLA Monitoring Into a Predictive Control Loop
- Choosing SLA Monitoring Tools That Fit Your Stack
- A Practical SLA Monitoring Template and Best Practices
Why SLA Monitoring Matters for Modern DevOps Teams
A green dashboard can confirm that a basic check reaches the service, while a critical customer request still fails or slows down. The gap is like a shop whose lights are on but whose checkout is closed: availability alone does not show whether the service delivers what customers rely on.
The measurement must follow the contract's definitions, not just whatever an uptime dashboard reports. For example, a check might count successful responses while overlooking a failed workflow. Teams need to define which requests count, what response times qualify, and how measurement windows and exclusions apply. Google's SRE guidance on alerting explains how teams can use service measurements to decide when action is needed (Google's SRE book chapter on alerting).
These definitions turn monitoring into more than a status display. They make results interpretable and give teams a shared basis for investigating whether a commitment is at risk. Without them, engineers may see activity on a dashboard but lack clear evidence that the service met its contractual promise.
Monitoring can also act as an early-warning loop. If reliability starts to decline, engineers can investigate, escalate, or adjust planned work before the service misses its commitment. The measurement definition is therefore part of the system itself: it determines what the team sees and which operational decisions follow.
The sections ahead build on that foundation. They explain how SLIs, SLOs, and SLAs differ, which indicators matter, and how to define measurements that can stand up to scrutiny. From there, the focus turns to using alerts and tools to support timely decisions and a repeatable monitoring process.
Understanding SLI, SLO, and SLA as Three Separate Layers
A fitness tracker makes the relationship easier to understand. The device records steps taken, a goal sets the desired step count, and an agreement defines what happens if that goal is met or missed. Those are three different jobs, even when they relate to the same activity.
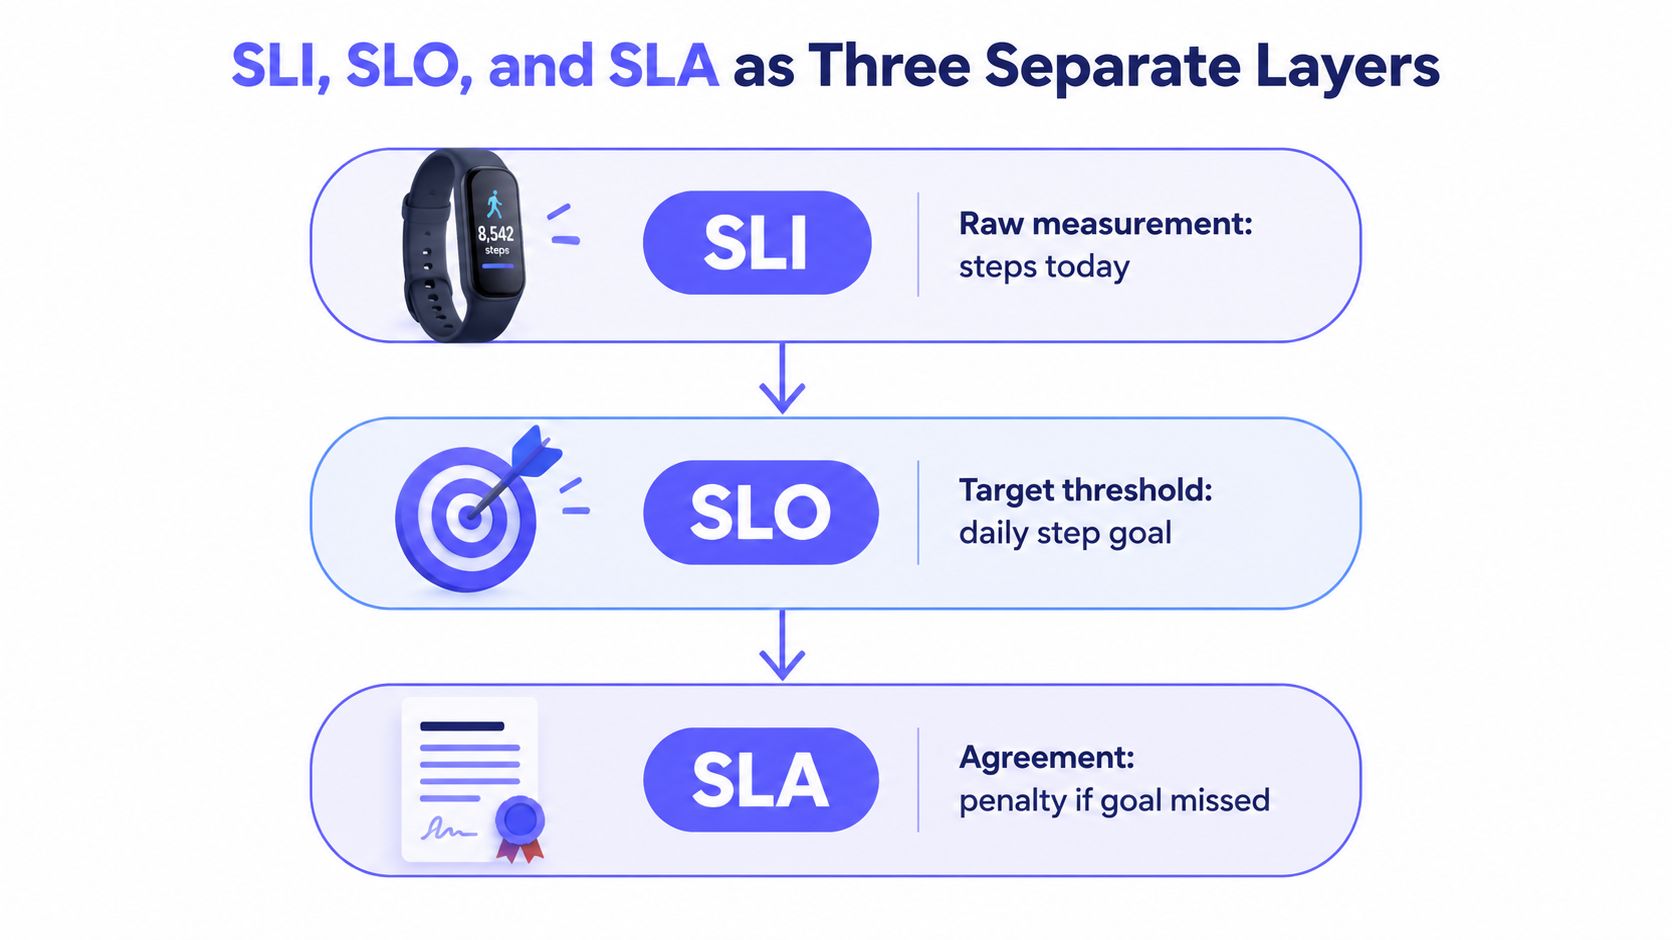
In service operations, the service-level indicator (SLI) is the measurement, such as the share of valid requests that succeed. The service-level objective (SLO) is the target for that measurement. The service-level agreement (SLA) is the customer-facing contract that can set consequences when the agreed target isn't met. A service can have internal indicators and objectives without a customer contract, but the SLA is the layer that creates the customer-facing commitment.
Consider an SLA that promises 99.5% availability over 30 days. That threshold permits approximately 3.6 hours of downtime in the period (IBM's overview of SLA metrics). The arithmetic is only meaningful if both parties agree on what counts as downtime, which service is in scope, and how the measurement window is calculated.
Find the measurement behind the promise
An SLI needs a clear definition before anyone can judge whether the SLO was met. For example, a team might define availability through successful customer requests, rather than checking whether a server responds. That definition should identify the data source, the valid transaction, and how missing measurements are treated.
When reviewing an agreement, engineers should be able to point to the indicator, its target, and the contractual terms that apply if the target isn't met. If a document gives a percentage but leaves the measurement method unclear, the promise may be difficult to verify.
A team defining its internal reliability objectives can use this guide to service-level objectives to clarify how objectives relate to operational targets. The useful test is simple: can a customer and provider independently interpret the same measurement and reach the same conclusion?
The Metrics That Define an SLA
A service can pass an uptime check while customers still struggle: requests may fail intermittently, or take so long that a workflow becomes unusable. A useful SLA measurement therefore starts with the customer's experience, then defines the signals that describe it. The four golden signals, traffic, latency, errors, and saturation, help teams assess service behavior from more than one angle. They complement the specific metrics an agreement promises to measure.
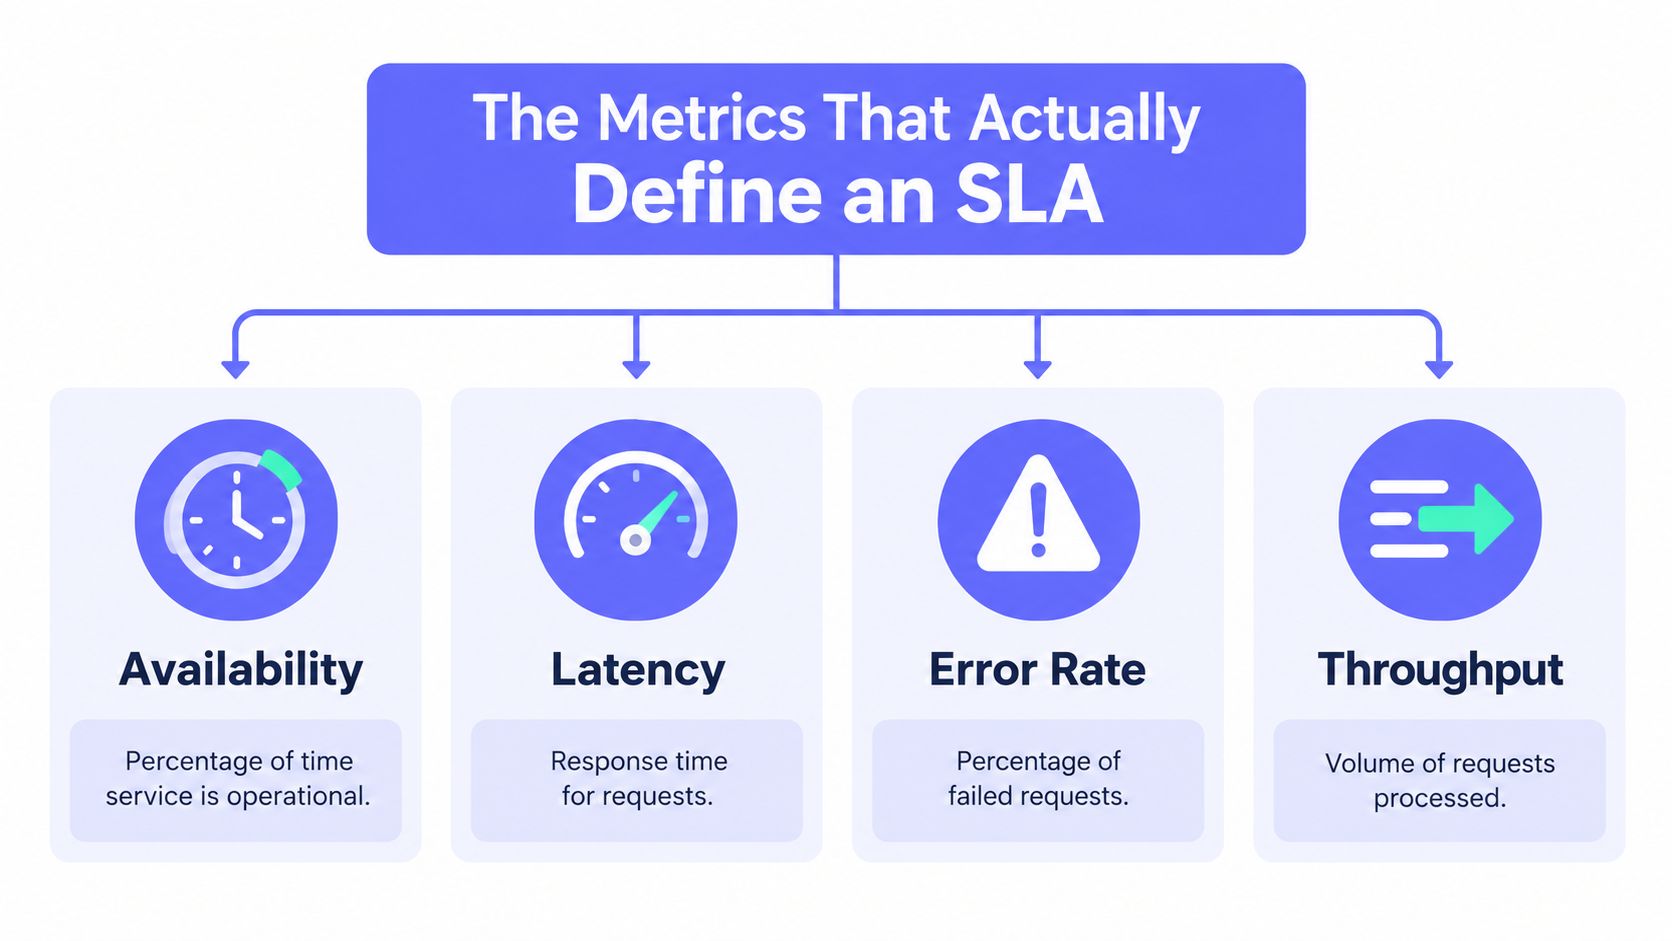
A practical SLA metric set can include:
- Availability: Whether the service is usable under the contract's definition, measured over its stated window.
- Latency and response time: How long requests take. If slow requests affect users, define which response times count. An average can conceal a small share of very slow requests.
- Error rate: How often in-scope requests fail. The agreement needs a shared definition of failure.
- Throughput or traffic: Whether the service handles the expected request volume and types. The DTIC review of automated SLA monitoring lists transactions handled per unit of time among measurable service metrics (DTIC review of automated SLA monitoring).
- Recovery and security or compliance measures: Mean time to recovery can be relevant when the agreement includes restoration commitments. Security and compliance indicators belong in the metric set when the contract defines them.
A dashboard isn't a measurement definition
A dashboard shows signals; the measurement definition determines whether they count toward an SLA. A high availability reading alone cannot show that a customer's key requests succeeded. Likewise, an internal server metric does not automatically describe service quality from the customer's perspective.
For example, a team could measure whether a user completes a key workflow, rather than whether a server responds. That choice shapes what the monitoring system collects and how it evaluates performance against the agreement. The definition is part of the product: it makes the commitment testable and gives monitoring a basis for spotting changes, not just reporting results after the measurement window closes.
Teams should specify the valid transaction, the endpoints or service areas in scope, and how regional or partial failures count. CEFCore on platform uptime offers context on the wording behind an uptime promise. For help distinguishing possible measures, see availability metrics and their measurement.
Building a Measurement Setup That Holds Up in a Dispute
A customer reports that a key workflow failed, while the provider's dashboard shows the service as healthy. To resolve the disagreement, both sides need a shared measurement definition and records that let them reproduce the result. Treat that definition as part of the product: it determines what the monitoring system observes and how evidence is interpreted.
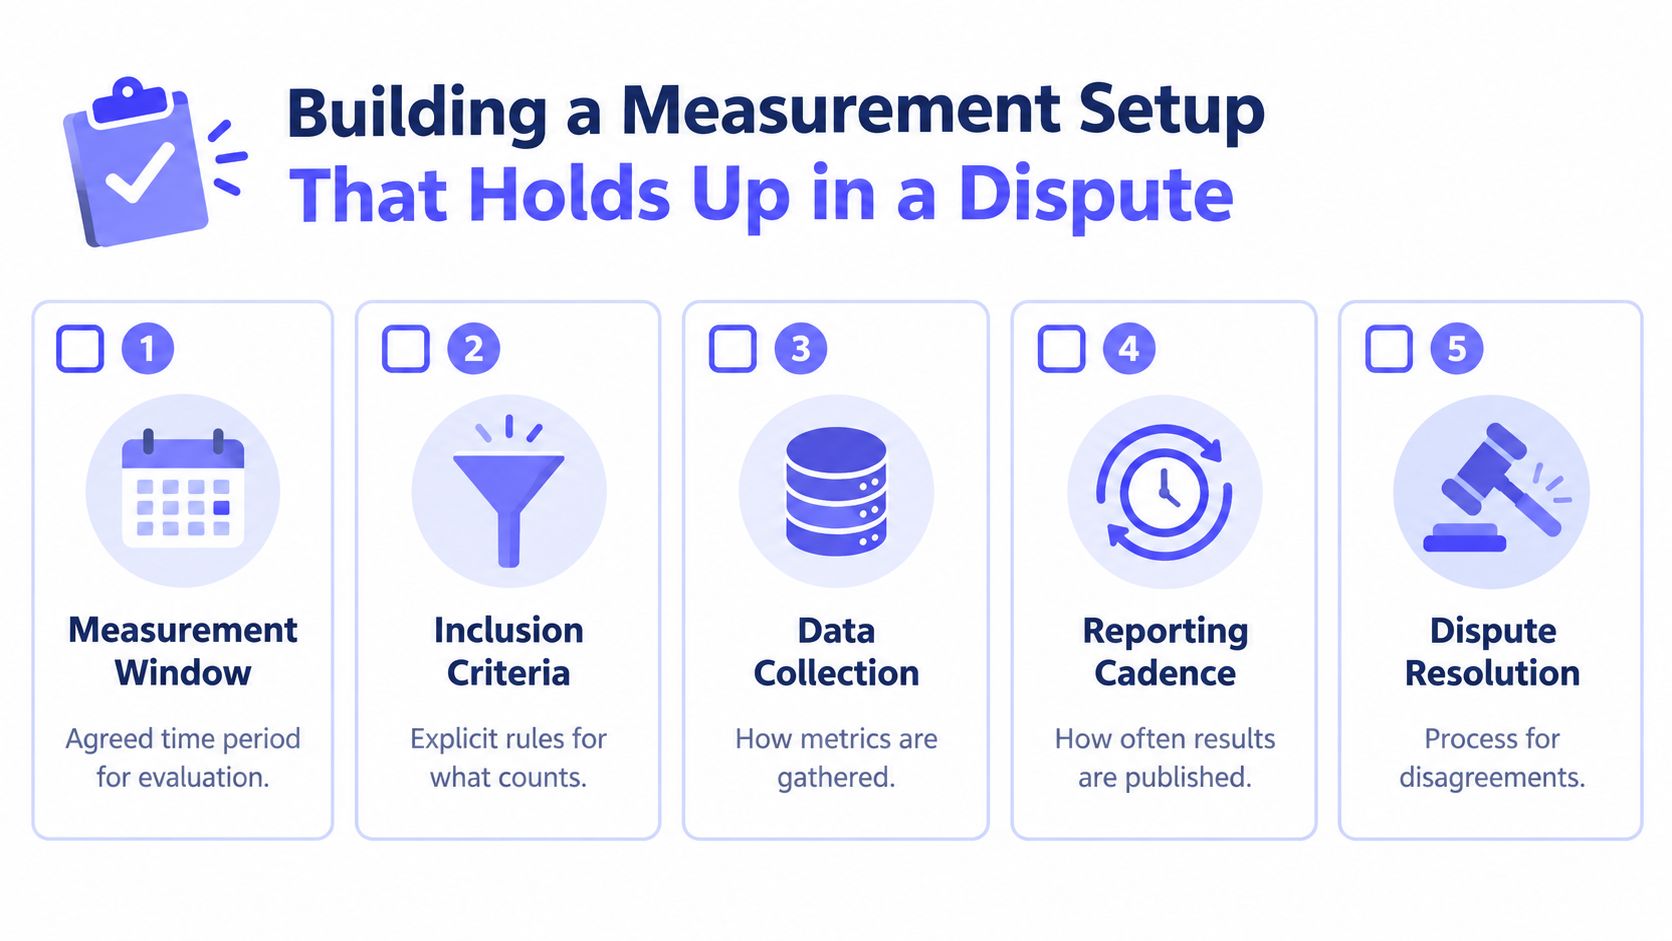
Before collecting data, agree on five practical details:
- What is the measurement window? State the period used to evaluate performance and when it starts and ends. A monthly calculation, for example, needs an unambiguous boundary.
- What counts, and what's excluded? Define a valid request and document how planned maintenance, dependency failures, and other exclusions are treated. If an exclusion seems obvious to one team, write it down so both sides apply it the same way.
- Where does the data come from? Identify the collection method, relevant records, and which systems provide the evidence. Comparing customer-side observations with provider-side records can help explain whether a failed transaction reflects the service or another part of the request path.
- When are results reported? Set the reporting cadence and how long supporting records are retained. Keep the report tied to the agreed measurement, rather than substituting an internal health indicator.
- Who responds or resolves disagreements? Name the owner for alerts and establish how disputed calculations are reviewed, including which records both parties can examine.
A written definition works like a recipe: if two engineers follow the same ingredients and steps, they should reach the same result. Record timestamps, calculation rules, exclusions, and relevant incident details so another person can retrace the calculation. For practical guidance on assembling incident records, see downtime reporting practices.
Keep the evidence fresh and traceable
Operational monitoring and contractual reporting serve different purposes. A report may summarize a longer period, while current telemetry helps the team notice a problem as it develops. Keep collection timestamps and preserve enough underlying data to explain how a reported result was produced.
Practical rule: If two parties can't reproduce the calculation from the recorded data and agreed rules, the result is hard to defend.
The measurement setup is useful beyond resolving disputes. Consistent definitions and traceable records give the team a dependable baseline for evaluating service behavior and deciding whether an alert reflects a real change.
Turning SLA Monitoring Into a Predictive Control Loop
A service can remain within its SLA while its reliability is deteriorating. For example, a rising error rate may be consuming the error budget faster than usual, even though the service has not yet breached its target. Monitoring that trend gives the team time to respond before customers feel the full impact.
Google's SRE framework defines an error budget as the difference between a reliability target and 100%. Tracking its burn rate turns a measurement into an early warning: if the budget is being used too quickly, the team can investigate while there is still room to reduce impact.
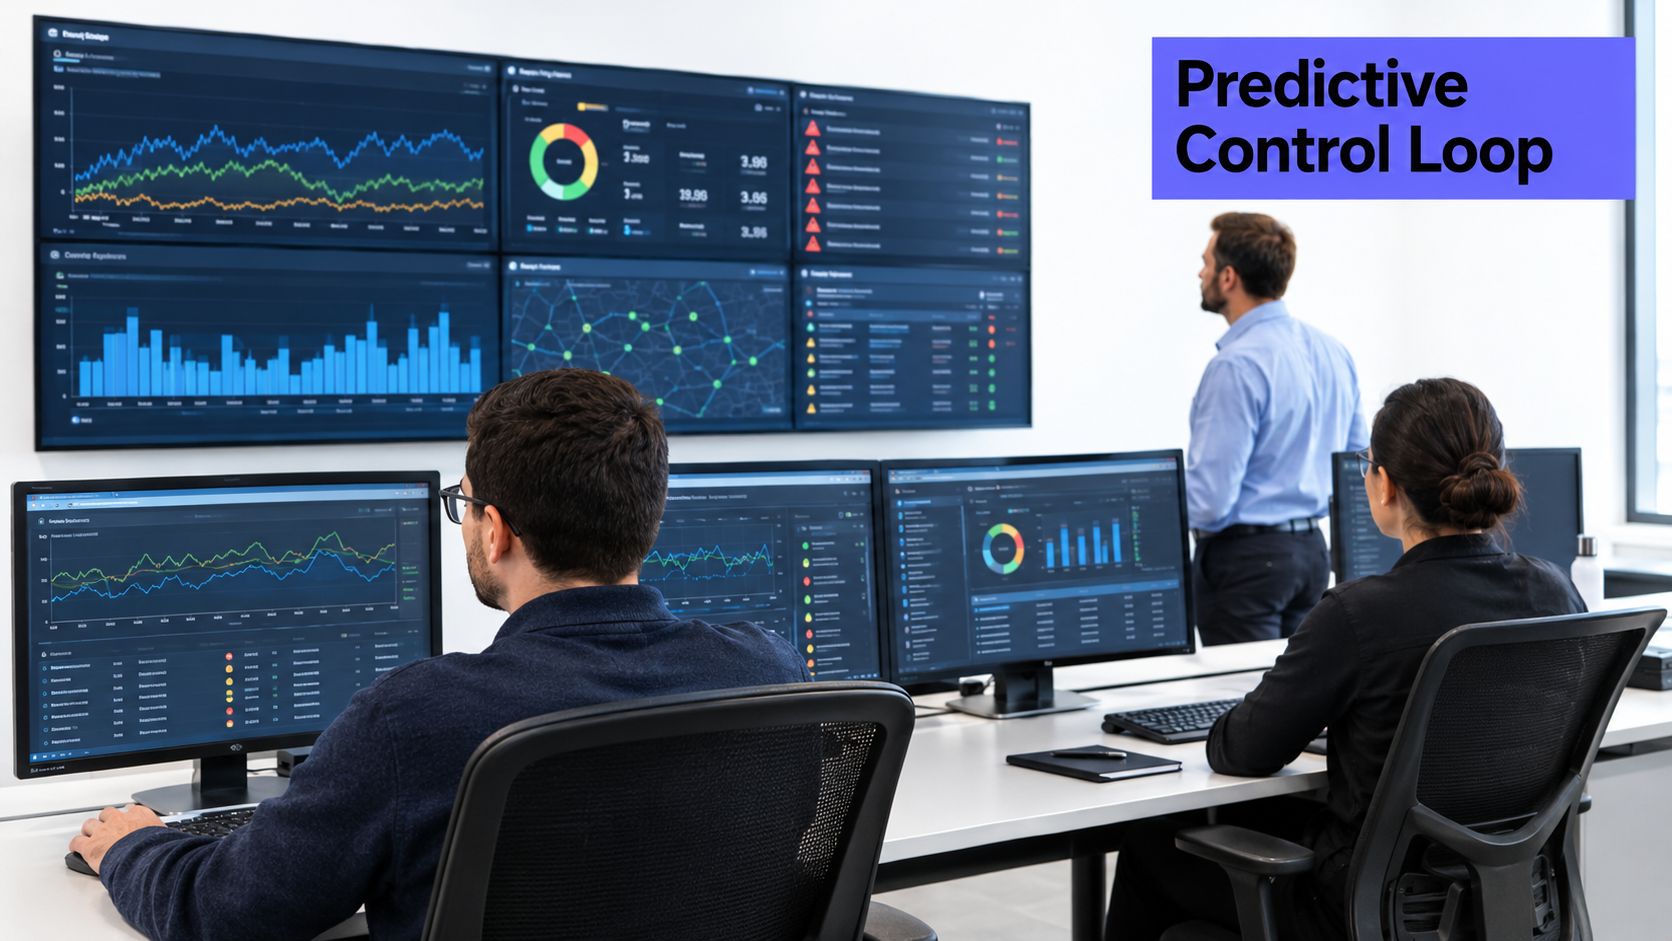
An alert needs a clear next step. The team might investigate a change that coincides with degradation, pause a risky release, prioritize reliability work, or begin an incident review. Include the affected service and measurement, show how the signal is changing, and route the alert to an owner.
Connect signals to decisions
Burn-rate alerts highlight rapid reliability declines. Longer-term views help distinguish a brief disruption from a persistent problem. Comparing daily, weekly, and monthly SLO trends gives teams more context than a single pass-or-fail result.
For teams calibrating alert thresholds against SLO trends, a short video on service reliability and SLOs can help align the discussion before setting burn-rate windows.
Trend review can make the distinction clearer. Trend analysis for monitoring data offers a way to examine how a changing signal differs from an isolated measurement. The goal is to connect that pattern to a decision, rather than add another notification to a busy channel.
That connection needs organizational support. If releases continue without review after the error budget is exhausted, monitoring may inform the team without changing its actions. Service owners and business stakeholders should agree in advance what follows a warning, who can pause a release, and how the team handles customer communication.
Choosing SLA Monitoring Tools That Fit Your Stack
Monitoring tools gather different kinds of evidence. A synthetic uptime checker probes a service from outside and can show whether an endpoint is reachable. Infrastructure agents report on servers, containers, and other internal components. Unified platforms combine several signals and alerting in one place, while status-page services focus on communicating incidents to customers.
The choice depends on what the SLA promises. An uptime-only commitment may need external availability checks, but an agreement covering application response or error behavior calls for telemetry that can measure those signals. Teams evaluating options should ask whether a tool can collect the data the contract requires, retain useful incident evidence, route alerts to the right owner, and fit the existing operational workflow.
A team might build a stack using Prometheus, Grafana, and Alertmanager, or combine a service such as UptimeRobot with healthchecks.io for specific monitoring needs. A unified platform is another approach when teams want server, network, website, and job monitoring in one dashboard. For a broader overview of approaches to availability checks, MD TECH TEAM's guide to keeping a site online compares the role uptime-monitoring tools can play in a reliability setup.
Compare tools against the contract
A useful evaluation begins with the measurement definition, not the product's dashboard. Check whether the tool can measure each in-scope service indicator, support the required data sources, preserve timestamps, and trigger an alert before a breach becomes a reporting problem.
Fivenines is one unified monitoring option. It combines Linux server metrics, network device health, website uptime, and cron job tracking in a dashboard, with an open-source Linux agent that sends telemetry over HTTPS. Its checks include HTTPS, TCP, ICMP, and DNS from multiple regions, with failure confirmation before paging. Those capabilities may suit teams looking to consolidate monitoring, while a layered stack can offer more flexibility when existing tools already meet the measurement requirements.
A Practical SLA Monitoring Template and Best Practices
A useful SLA template turns contract language into a definition that engineers can collect, customers can understand, and both parties can review. It should connect the promise to a specific indicator and show how the result will be calculated.
Use these fields as a starting point:
| Field | What to define |
|---|---|
| Service name | The service, workflow, or endpoint covered by the agreement. |
| Promised objective | The customer-facing target and the contractual terms tied to it. |
| SLI formula | The exact calculation, including what counts as a valid success or failure. |
| Data source | The monitoring system, logs, or other records used to calculate the result. |
| Exclusions | How planned maintenance, dependency failures, and other agreed exceptions are handled. |
| Measurement window | The period used to assess compliance and how it's evaluated. |
| Reporting cadence | When reports are produced and which evidence they include. |
| Escalation owner | The person or team responsible for acting on alerts and resolving questions. |
| Evidence retention | How measurement records and incident details are preserved for review. |
Put the definition into practice
Start with the customer's experience. If availability is part of the commitment, define the transaction or service check that represents “usable.” If customers can still reach a page but can't complete the central workflow, the measurement should make that distinction visible.
Add at least one latency or error indicator where the contract's scope calls for it. A higher uptime reading can coexist with a poor experience if slow or failed requests are missing from the measurement. The goal isn't to collect every possible signal. It's to define the signals that map to the customer-facing promise and can be measured consistently.
Best practices that strengthen the template include:
- Keep telemetry fresh: Stale data can slow an operational response, even if the contractual report is calculated over a longer window.
- Define a valid transaction: State what request, workflow, or outcome counts, and document when measurement starts and ends.
- Separate customer and infrastructure views: Internal signals help diagnose problems; customer-facing objectives show whether the service commitment is being met.
- Decide how missing data is treated: Specify whether gaps are considered unknown, excluded, or handled another way, and record the reasoning.
- Assign people to act: Every alert needs an owner and an agreed response. A dashboard without follow-through can't prevent a breach.
- Retain evidence for review: Preserve the records needed to explain calculations, incidents, and exclusions when customers ask for an account of service performance.
The template should change when the service or its contract changes. A new dependency, altered workflow, or revised commitment may change what counts as a valid measurement. Regularly checking the definition helps keep monitoring aligned with what customers receive.
Fivenines brings Linux server metrics, network health, website uptime, and cron job monitoring together in one dashboard, with alerting and incident visibility for operational teams. To compare that unified approach with the team's current monitoring stack, visit Fivenines.