Downtime Reporting: A Practical Guide for SRE Teams

Nearly 97% of large enterprises estimate that one hour of downtime costs more than $100,000, and 41% put the hourly cost between $1 million and more than $5 million. Reliable downtime reporting therefore needs to do more than show an uptime percentage. It must establish what happened, when customer impact began and ended, which systems were involved, and how the organization knows those facts are correct.
An uptime dashboard is useful for operations, but it rarely answers the questions asked during a serious postmortem, an SLA review, or a regulatory filing. A monitor may show that a check failed, while compliance teams need a defensible timeline connecting detection, confirmation, degradation, recovery, restoration, and evidence.
That gap creates avoidable risk. Engineering teams need telemetry and response metrics. Executives need financial exposure and recurrence risk. Regulators need timely notifications supported by consistent incident records. A mature downtime reporting practice gives all three groups the same underlying evidence, interpreted for their specific purpose.
Table of Contents
- Why Downtime Reporting Matters More Than Your Uptime Dashboard Shows
- Core Metrics Every Downtime Report Must Track
- Building Effective Downtime Reports and Status Page Templates
- Beyond Binary Uptime, Impact-Weighted Availability Models
- Why Faster Detection Doesn't Guarantee Better Reporting
- Satisfying DORA and NIS2 Without Duplication
- Actionable Next Steps for Your Downtime Reporting Practice
Why Downtime Reporting Matters More Than Your Uptime Dashboard Shows
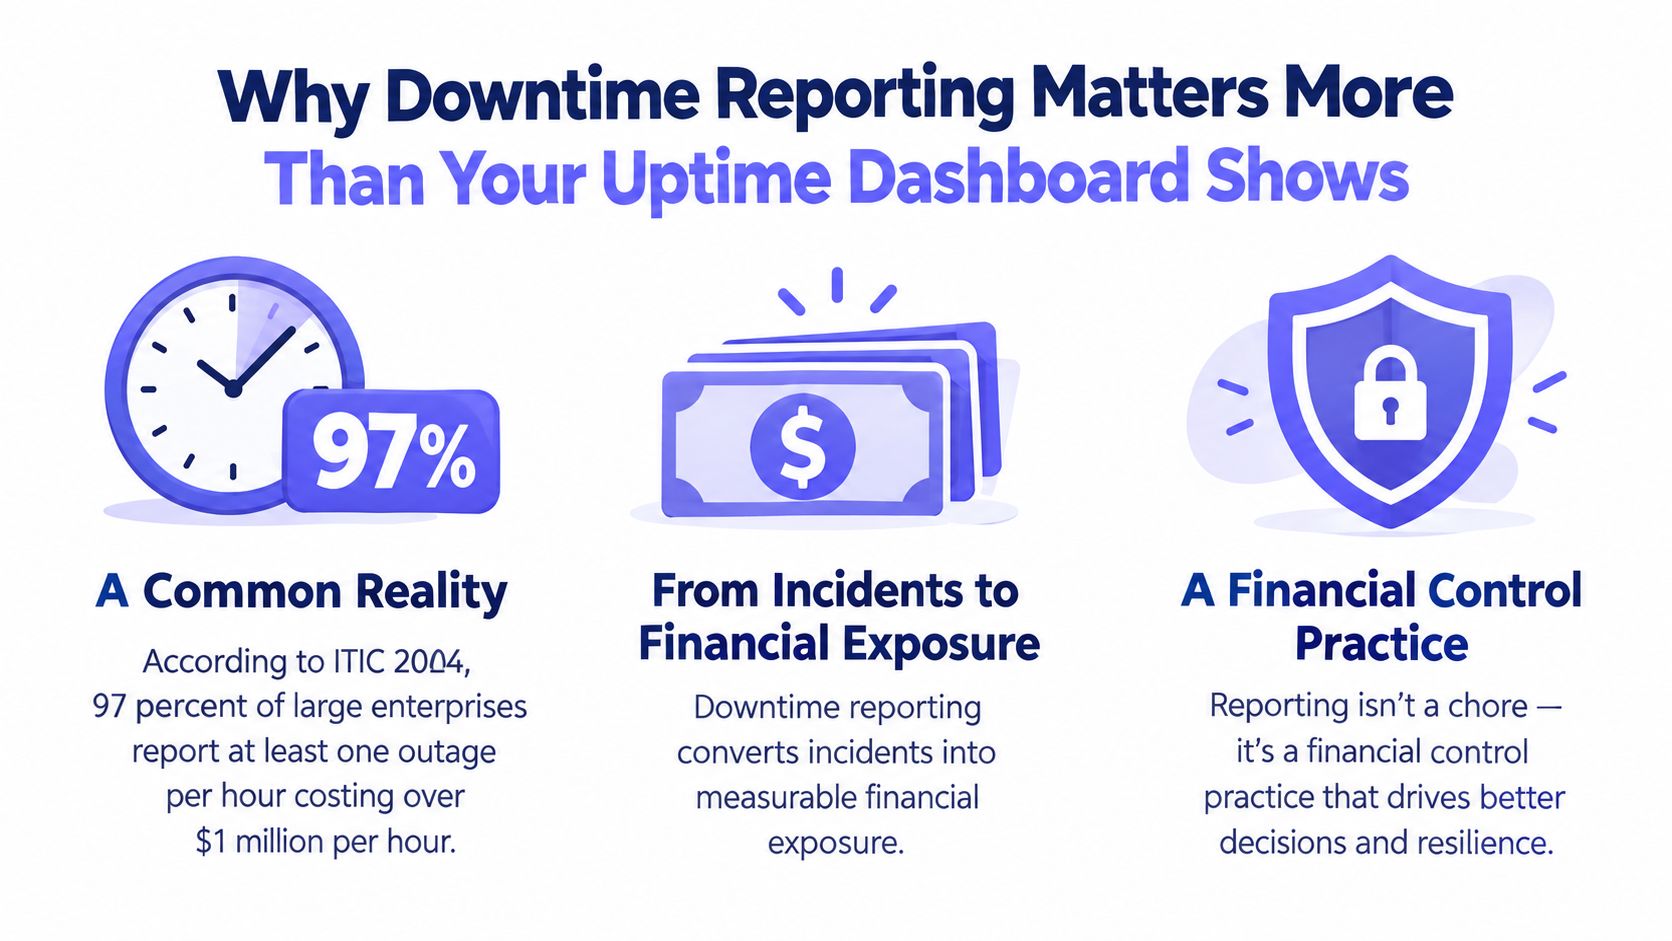
ITIC's 2024 Hourly Cost of Downtime Survey found that 97% of large enterprises with more than 1,000 employees estimated that one hour of downtime costs over $100,000. The survey also reported that 41% estimated the hourly cost at between $1 million and more than $5 million. More than 90% of midsize and large organizations placed the cost of one downtime hour above $300,000.
Those figures change the role of an incident report. Downtime reporting isn't administrative cleanup after the technical work. It becomes a financial-control practice that supports decisions about redundancy, alerting, capacity, monitoring coverage, and remediation priority.
The percentage is only the beginning
A monthly availability figure compresses a complex event into a number. It doesn't show whether the failure affected checkout, authentication, background processing, one geography, or an internal administration route. It also doesn't reveal whether the reported duration starts at the first failed customer transaction, the first monitor alert, or the moment an engineer acknowledged the incident.
A credible report records:
- Event boundaries: Detection, confirmation, mitigation, recovery, and restoration timestamps.
- Operational scope: Affected services, dependencies, regions, tenants, and transaction types.
- Customer impact: Symptoms, failed requests, latency changes, and affected business functions.
- Financial assumptions: Direct recovery costs and the method used to estimate business loss.
- Evidence links: Logs, alerts, deployment records, configuration changes, and corrective actions.
ITIC notes that its estimates exclude litigation and civil or criminal penalties, so even a carefully calculated operational figure can understate total exposure. That makes assumptions as important as the final amount.
Teams that already track availability metrics have a useful starting point, but the dashboard should feed an evidence record rather than replace it. Executives can act on a financial estimate, while engineers can trace the estimate back to service impact and timestamps.
Practical rule: If a report can't show how its start time, end time, scope, and cost were established, it isn't yet a reliable control.
Core Metrics Every Downtime Report Must Track
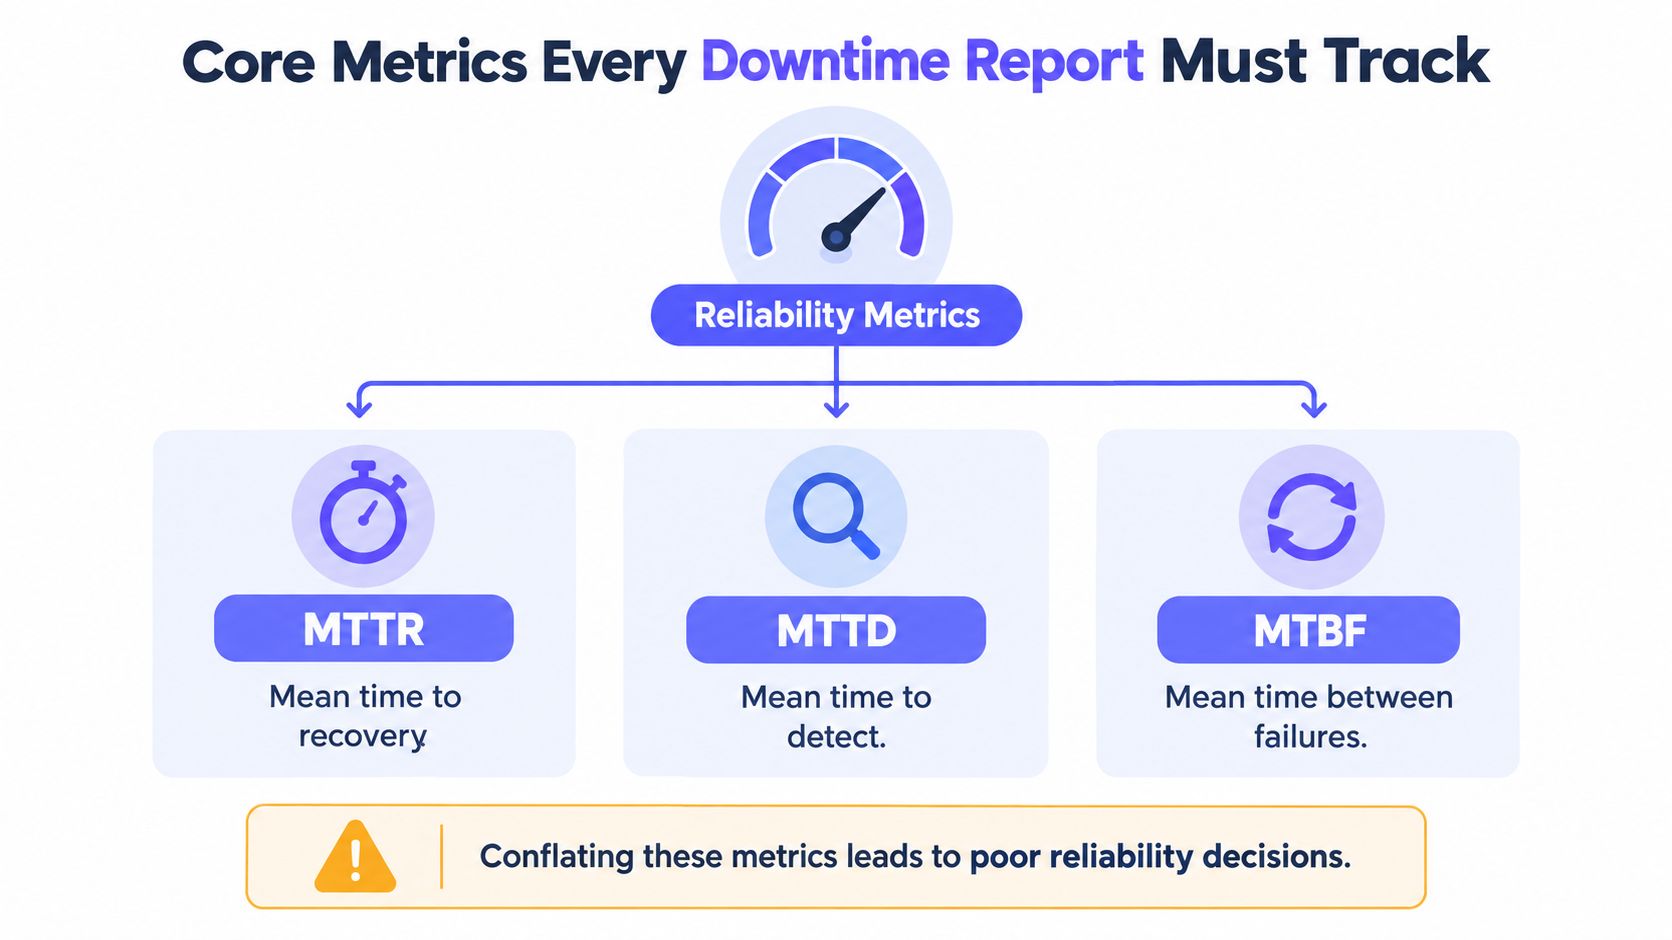
Downtime reports fail when teams treat MTTD, MTTR, and uptime as interchangeable. They answer different questions, and each exposes a different part of the reliability system.
MTTD, or mean time to detect, measures the interval between the beginning of a qualifying incident and the point at which monitoring or a human identifies it. Detection may come from synthetic checks, application telemetry, customer support, or an internal alert. The report should state which signal established detection, because a monitor that fires before users experience impact isn't automatically the customer-impact start time.
MTTR, or mean time to restore, measures how quickly service returns after the incident begins. Some organizations use “repair” instead of “restore,” but the operational question remains the same: how long did recovery take? A low MTTR can coexist with poor customer outcomes if detection was slow or if the metric stops when a monitor turns green while users still encounter failures.
Uptime percentage summarizes availability across a defined period. It works well for trend reporting and contractual conversations when the measurement window, exclusions, probe locations, and failure criteria are explicit. It can still hide concentrated risk, because a small number of severe infrastructure failures may dominate annual losses even when aggregate availability looks strong. Service-level objectives should therefore be paired with incident-level records.
Calculate each metric from explicit boundaries
A useful report defines the timestamps before calculating anything:
- Detection: The first trustworthy indication that a qualifying condition exists.
- Confirmation: The point at which the team validates the signal and identifies the affected service.
- Mitigation: The moment customer impact is reduced, even if the underlying cause remains.
- Recovery: The point at which the service meets the stated success criteria.
- Restoration: Proof that normal operation has returned across the affected scope.
Mean time between failures, or MTBF, belongs in the same reliability picture, but it shouldn't be used to disguise severe events. A service can fail infrequently and still impose unacceptable risk if individual incidents are long, broad, or tied to a critical business function.
A low MTTR doesn't compensate for an undefined incident start. Teams need both response speed and trustworthy event boundaries.
Building Effective Downtime Reports and Status Page Templates
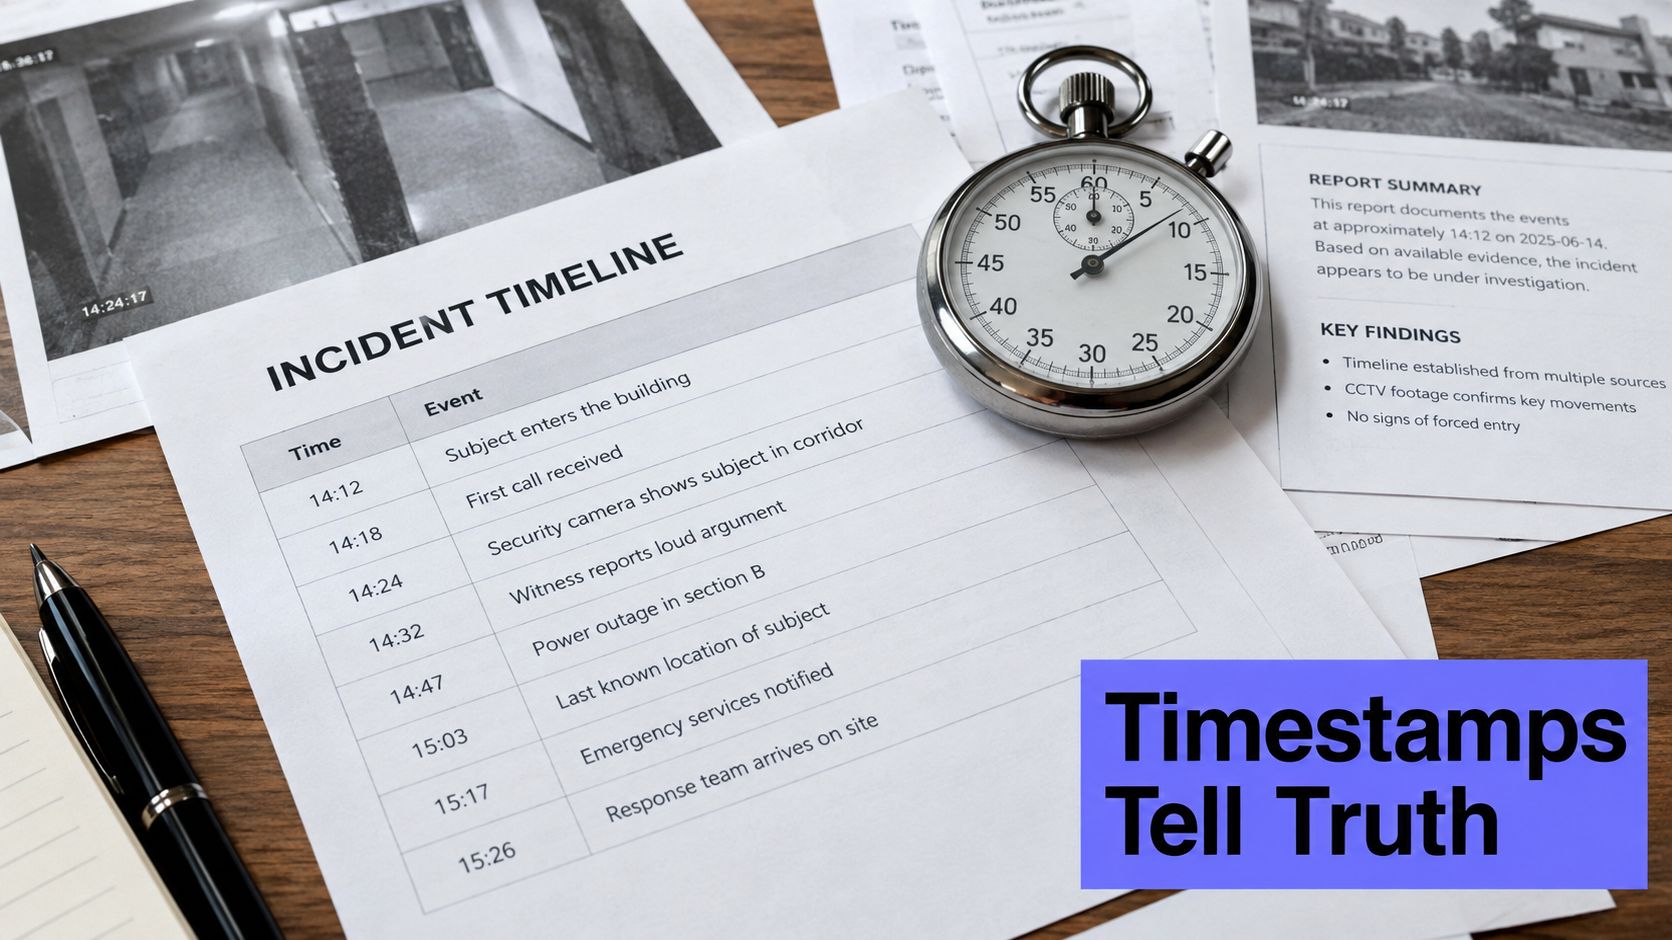
A useful template starts with the evidence that people will need later, not the prose someone hopes to write after the incident. Every incident should have a unique record containing the detection timestamp, confirmation timestamp, recovery timestamp, affected service or dependency, customer-visible symptoms, geographic scope, error-rate or latency change, and cause classification.
Those fields support time to detect, time to acknowledge, time to mitigate, and time to restore calculations. They also prevent a common failure mode: an incident owner reconstructing the timeline from memory while logs, alerts, and deployment records remain scattered across unrelated systems.
Keep the evidence chain intact
The report should link each conclusion to its supporting record. A practical chain includes:
- Telemetry: Metrics, logs, traces, synthetic checks, and error samples that show the condition.
- Change history: Deployments, feature flags, infrastructure changes, and configuration edits near the event.
- Response history: Alert acknowledgements, escalation messages, handoffs, and mitigation actions.
- Impact validation: Customer reports, transaction outcomes, regional comparisons, and dependency status.
- Remediation: Corrective and preventive actions with an owner and a verification method.
The public status page needs a narrower view. It should communicate affected components, customer-visible symptoms, current state, incident updates, and restoration. It doesn't need sensitive topology, internal hypotheses, privileged logs, or unverified blame.
The internal postmortem needs the opposite level of detail. It should preserve competing hypotheses, evidence quality, partial degradation, dependency behavior, and the distinction between mitigation and full restoration. A status page template can provide a customer-facing structure, but it shouldn't become the system of record for the technical investigation.
Separate status communication from postmortem analysis
A status update says what customers need to know now. A postmortem explains what the organization learned after the evidence stabilized. Mixing those purposes produces vague public updates and shallow internal reports.
The strongest workflow generates both from one incident object. Public updates expose the approved summary, while internal records retain timestamps, telemetry links, scope calculations, and unresolved questions. That approach reduces duplicate entry and makes SLA validation much easier.
Beyond Binary Uptime, Impact-Weighted Availability Models
A binary uptime model treats a service as either available or unavailable. That model is easy to understand, but it can misrepresent a regional failure, intermittent API errors, or a checkout outage that affects a critical transaction while low-use pages remain healthy.
Impact-weighted reporting doesn't replace calendar-time downtime. It adds context. The report should show the raw duration, then explain how many users, requests, transactions, regions, or business functions experienced the degradation. A lower aggregate availability figure can be more honest than a binary duration when failures are intermittent, provided the sampling method and exclusions are disclosed.
| Metric | What It Measures | Best Used For |
|---|---|---|
| Calendar-time downtime | The elapsed period in which a defined service condition failed | Incident timelines, SLA calculations, and regulator records |
| User-minutes affected | The combined exposure across affected users and time | Executive impact summaries and customer-impact analysis |
| Failed-request rate | The share of requests that returned an error or unusable response | API reliability, transaction analysis, and technical postmortems |
| Error-budget consumption | The portion of an agreed reliability allowance used by incidents | SLO governance and prioritizing engineering work |
| Business-function availability | Whether a critical function, such as authentication or checkout, remained usable | Risk reviews, customer communication, and regulatory materiality |
Choose the measure for the audience
Internal engineering reports benefit from request-level and dependency-level detail. Customer updates usually need clear affected functionality and a defensible duration. Regulatory notifications may need scope, affected clients, critical functions, geographic spread, data loss, economic impact, and service downtime.
Teams should document whether maintenance windows are excluded, how multiple regions confirm an incident, and how third-party failures are attributed. Sampling can miss intermittent errors, while a single failing probe can exaggerate impact without customer validation.
The report should distinguish a partial failure from a total outage. A regional API route, tenant group, container cluster, or transaction type can be unavailable while the wider platform remains reachable. Recording that distinction helps leaders prioritize repairs according to business consequence rather than dashboard simplicity.
Why Faster Detection Doesn't Guarantee Better Reporting
Fast detection is valuable, but it doesn't guarantee a trustworthy report. A monitor can fire before customer impact begins, after impact has already spread, or during a harmless transient condition. A green check can return before queued transactions process successfully or before every region recovers.
Define confirmation instead of trusting the first alert
The incident record should preserve the first signal, but it shouldn't automatically treat that signal as the customer-impact boundary. Confirmation can require a second probe, application telemetry, transaction validation, or a regional comparison. The rule needs to be written before the next outage, otherwise responders will choose whichever timestamp makes the report look cleaner.
A durable timeline stores raw events rather than only derived durations. Alert history, logs, deployment events, dependency failures, acknowledgements, and recovery checks should remain available after dashboards roll over or incident channels become difficult to search.
Fast detection is an operational advantage. Immutable evidence is a reporting requirement.
A useful correlation process connects the alert to the change or condition that preceded it, then follows the response through mitigation and restoration. Event correlation helps teams associate signals that otherwise sit in separate monitoring and incident systems, but correlation must preserve uncertainty. An inferred cause shouldn't be recorded as confirmed until the supporting evidence exists.
The recovery boundary deserves equal discipline. A monitor may pass while customers still see increased latency, failed writes, stale data, or regional errors. Restoration should require the checks defined in the incident policy, including customer-facing validation where the service is business critical.
The following video illustrates why incident timelines need more than a single alert and recovery marker.
A strong report can acknowledge uncertainty without weakening its credibility. It can state that the first alert occurred at one point, customer impact was confirmed later, and the exact beginning of degradation remains bounded by available evidence. That is more useful than false precision.
Satisfying DORA and NIS2 Without Duplication
DORA's reporting deadlines make timestamp quality operationally important. Covered financial entities must submit a major ICT-incident notification as soon as possible, within four hours of classification and no later than 24 hours after awareness, followed by an intermediate report within 72 hours and a final report within one month, as summarized in this DORA incident classification guidance.
Those deadlines don't require a separate compliance universe. Engineering teams already collect much of the necessary evidence, but monitoring data alone rarely answers every regulatory question. A monitor records an alert. Compliance teams need to establish awareness, classification, affected functions, customer impact, geographic scope, economic consequences, recovery, and the return to normal service.
Build one timeline with multiple reporting views
A shared incident record should preserve:
- Awareness evidence: The alert, support report, or operational observation that made the event known.
- Classification evidence: The reasoning behind severity and materiality decisions.
- Impact evidence: Affected clients, functions, regions, transactions, data, and financial exposure.
- Recovery evidence: Mitigation actions, service checks, transaction validation, and restoration proof.
- Notification history: Decisions, submissions, updates, and changes to the assessment.
NIS2 emphasizes incident handling and reporting for significant incidents involving severe operational disruption or financial loss. The practical overlap with DORA is substantial: both demand more than an uptime percentage, especially when partial degradation or dependency failure affects an important function.
Avoid two incompatible versions of reality
Separate pipelines create conflicting timestamps and inconsistent definitions. An engineering postmortem may call an event recovered when a monitor turns green, while compliance may wait for normal processing and customer confirmation. One evidence-grade timeline allows each audience to use an appropriate presentation without changing the underlying facts.
The process should preserve raw measurements, derived metrics, decision records, and later corrections. Regulatory reporting may evolve as evidence improves, so the original record must show what was known at each decision point rather than rewriting history.
Actionable Next Steps for Your Downtime Reporting Practice
Downtime reporting improves when teams treat it as an operational system, not a document produced by whoever happened to lead the incident. The first improvement is simple: define event boundaries before the next outage. Write down what counts as detection, confirmation, mitigation, recovery, and restoration, including the evidence required for each state.
Then audit the current incident template. If it lacks affected dependency, customer-visible symptom, geographic scope, error-rate or latency change, cause classification, or linked telemetry, add those fields before asking responders to improve the narrative.
A practical implementation sequence
- Standardize the incident record. Use one schema across services, with mandatory timestamps and explicit unknown values rather than blank fields.
- Separate raw and derived data. Preserve source events alongside calculated MTTD, MTTR, TTD, and TTR values so later reviewers can reproduce the calculation.
- Add impact dimensions. Record affected users, requests, transactions, regions, tenants, and business functions when those measurements are available.
- Connect operational evidence. Link alerts, logs, traces, deployments, configuration changes, escalation actions, and remediation tickets.
- Create audience-specific outputs. Generate a concise status update, an engineering postmortem, an executive impact summary, and a regulatory view from the same record.
- Review the records regularly. A monthly review can identify recurring detection gaps, ambiguous recovery criteria, missing ownership, and corrective actions that never received verification.
A monitoring platform can support this practice when it retains historical uptime, exact downtime intervals, incident timelines, resolution notifications, and status-page archives. Fivenines, for example, provides uptime history, incident timelines, resolution notifications, and public status pages derived from monitored services, which can serve as operational inputs to a broader evidence record.
The goal isn't to produce longer postmortems. It is to produce records that another engineer, auditor, executive, or regulator can follow without relying on private context. That shared organizational memory helps teams distinguish isolated failures from recurring weaknesses and prioritize remediation with evidence.
The report is complete only when its conclusions can be reproduced from preserved events.
Teams should begin with the next incident template review, not a large tooling migration. Define the boundaries, identify missing evidence, assign ownership for the schema, and test the process against a recent outage. Then verify whether the resulting timeline supports engineering learning, customer communication, financial analysis, and regulatory obligations without contradictory versions.
Fivenines brings infrastructure metrics, uptime checks, incident timelines, resolution notifications, and public status pages into one monitoring workflow that teams can use as the operational foundation for evidence-grade downtime reporting. Visit Fivenines to evaluate how its historical availability and incident records can fit into the team's existing postmortem and compliance process.