Server Network Monitoring: A Complete Guide for DevOps

A server can look healthy, the dashboard can stay green, and the service can still be broken for everyone who matters. That gap is where server network monitoring earns its keep, because uptime alone never proved that a dependency chain was working, only that one machine answered a check. In production, the question is whether the stack is still delivering transactions, resolving names, carrying traffic, and surfacing faults fast enough for humans to act before customers feel the impact.
Table of Contents
- What Server Network Monitoring Actually Solves
- The Core Metrics You Cannot Afford to Ignore
- Uptime Protocols and How to Use Each One
- Architectures for Agents, SNMP, and Pull Versus Push
- Alerting Strategies That Reduce Noise Instead of Adding It
- Scaling Monitoring Across Server Fleets and MSP Clients
- Migrating From Prometheus Zabbix and UptimeRobot to One Stack
- Building a Monitoring Practice That Earns Trust
What Server Network Monitoring Actually Solves
The call comes in late, and the first glance at the server looks boring. CPU is fine, memory isn't pinned, the host responds to pings, and the VM is still alive. Yet the customer-facing API has been timing out for long enough that support is already seeing repeat tickets, and the failure turns out to be a DNS problem upstream, not a dead box.
That's the trap with shallow monitoring. A reachable host is not the same thing as a usable service, and a green uptime check is not proof that traffic can move end to end. Server network monitoring exists to catch the space between those two facts, the place where infrastructure is technically up but operationally useless.
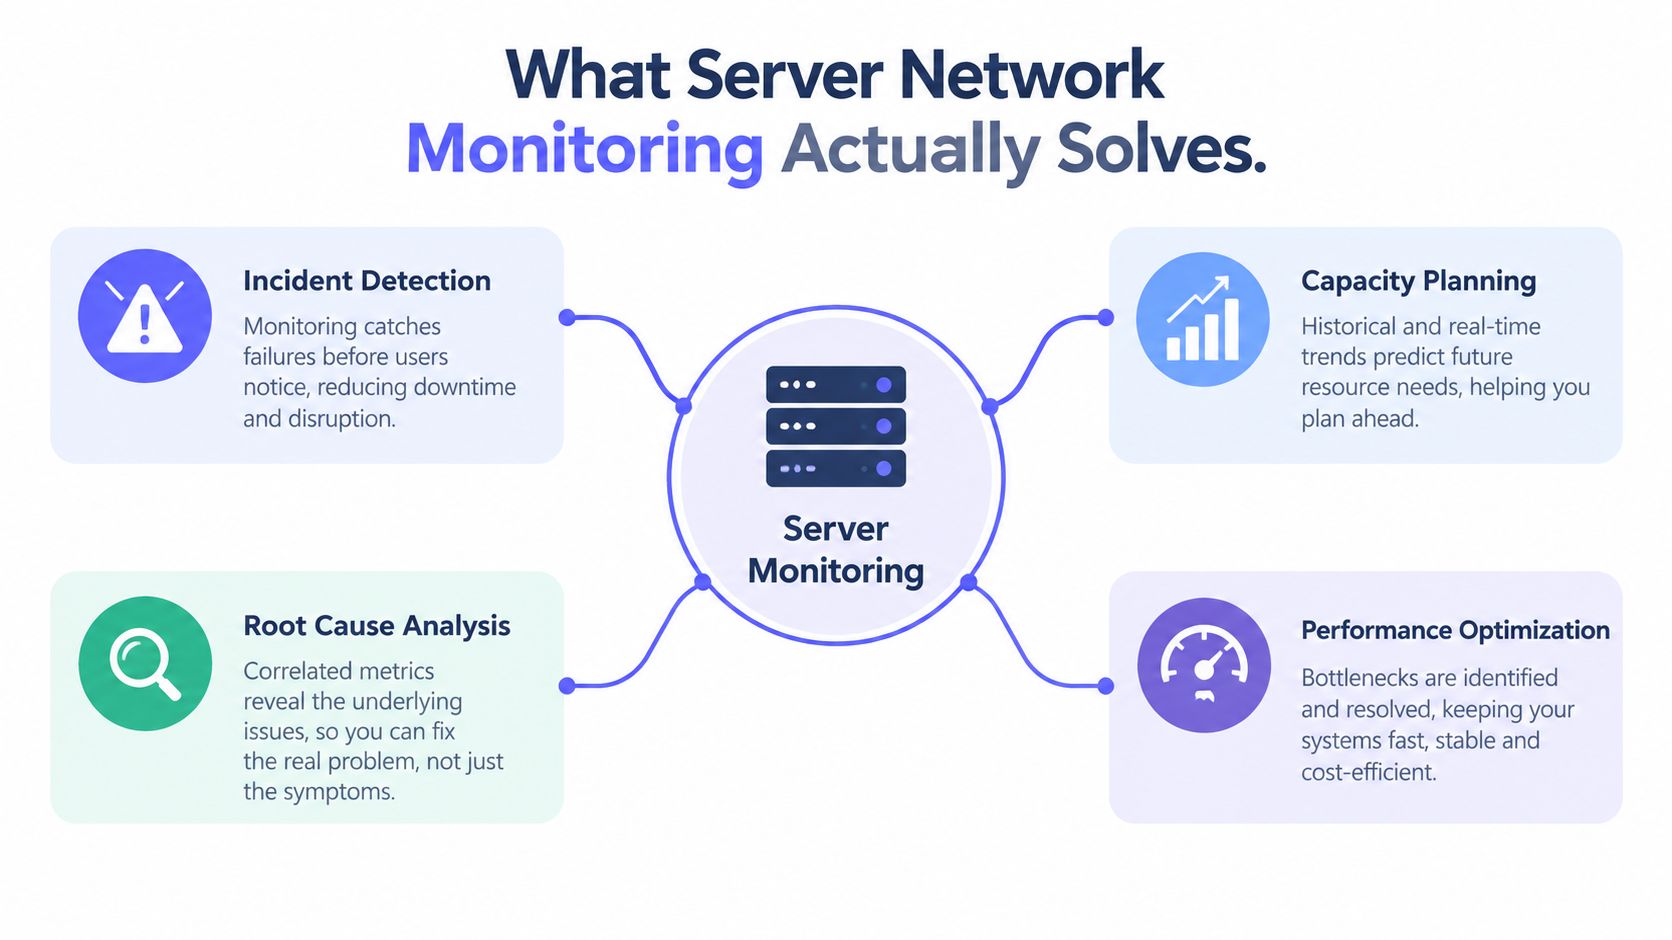
The trust problem, not the dashboard problem
The operational job is not collecting more graphs. It's separating real failure from noise, then getting a useful signal to the right person before the queue fills up. That matters because breach economics reward speed, IBM's 2025 Cost of a Data Breach study found a global average breach cost of $4.44 million, and organizations with a breach lifecycle below 200 days paid $3.87 million on average compared with $4.07 million for longer lifecycles IBM Cost of a Data Breach 2025. Faster detection and containment are not abstract virtues, they change the bill.
That's why the best monitoring setups don't start with tools. They start with what needs to be trusted, what failure looks like at each layer, and what confirmation is required before paging a human.
Practical rule: if a monitor can't explain why a service failed, it's only half a monitor.
What network monitoring is in practice is useful reading for teams that want the broader framing, but the core point stays the same. Monitoring should reveal whether a service is available, whether it is behaving normally, and whether an incident is real enough to interrupt someone.
The Core Metrics You Cannot Afford to Ignore
Start with host resources, because they're the easiest to misread. CPU saturation can be real pressure, but it can also be a symptom of retries, bad scheduling, or a noisy neighbor. Memory pressure is worse when it leads to swapping or aggressive reclaim, because the machine can remain online while latency climbs.
What each metric family really tells you
Disk metrics need the same discipline. High utilization matters, but so do queue depth, IOPS behavior, and sustained write stalls, because storage usually fails as slowness before it fails as an outage. Network interface counters tell a similar story, throughput alone is too blunt, while errors and discards are closer to the truth when a link is starting to misbehave.
| Metric Family | Watch For | Likely Cause |
|---|---|---|
| Host resource | Rising CPU, memory pressure, process churn | Load increase, runaway jobs, contention |
| Storage | Slow writes, queue buildup, saturation | Busy volumes, path issues, capacity pressure |
| Network interface | Throughput shifts, errors, discards | Faulty link, congestion, misconfiguration |
The useful habit is to treat metrics as evidence, not verdicts. A spike in CPU by itself doesn't tell you whether the app is broken, while a spike paired with failed requests and interface errors gives a far better signal. That's the same correlation logic covered in the later alerting section, just applied earlier in the stack.
A related point matters for virtualized hosts. Steal time, page-cache pressure, and delayed I/O can create user-visible pain long before a basic threshold trips. Those are the cases where the number on the dashboard looks tolerable, but the service still feels slow to anyone trying to use it.
Monitor the resource that explains the symptom, not the resource that is easiest to graph.
Metrics and dashboards guidance helps teams build that habit, especially when the temptation is to fill every panel with more charts. The stronger pattern is to link each metric to a failure mode, then remove the ones that never change an action.
Uptime Protocols and How to Use Each One
An ICMP check is a reachability test, nothing more. It tells you the host can answer at the network layer, which is useful, but it doesn't prove the service is listening, the dependency path works, or the certificate chain is valid. That's why teams that rely only on ping end up discovering failures through users.
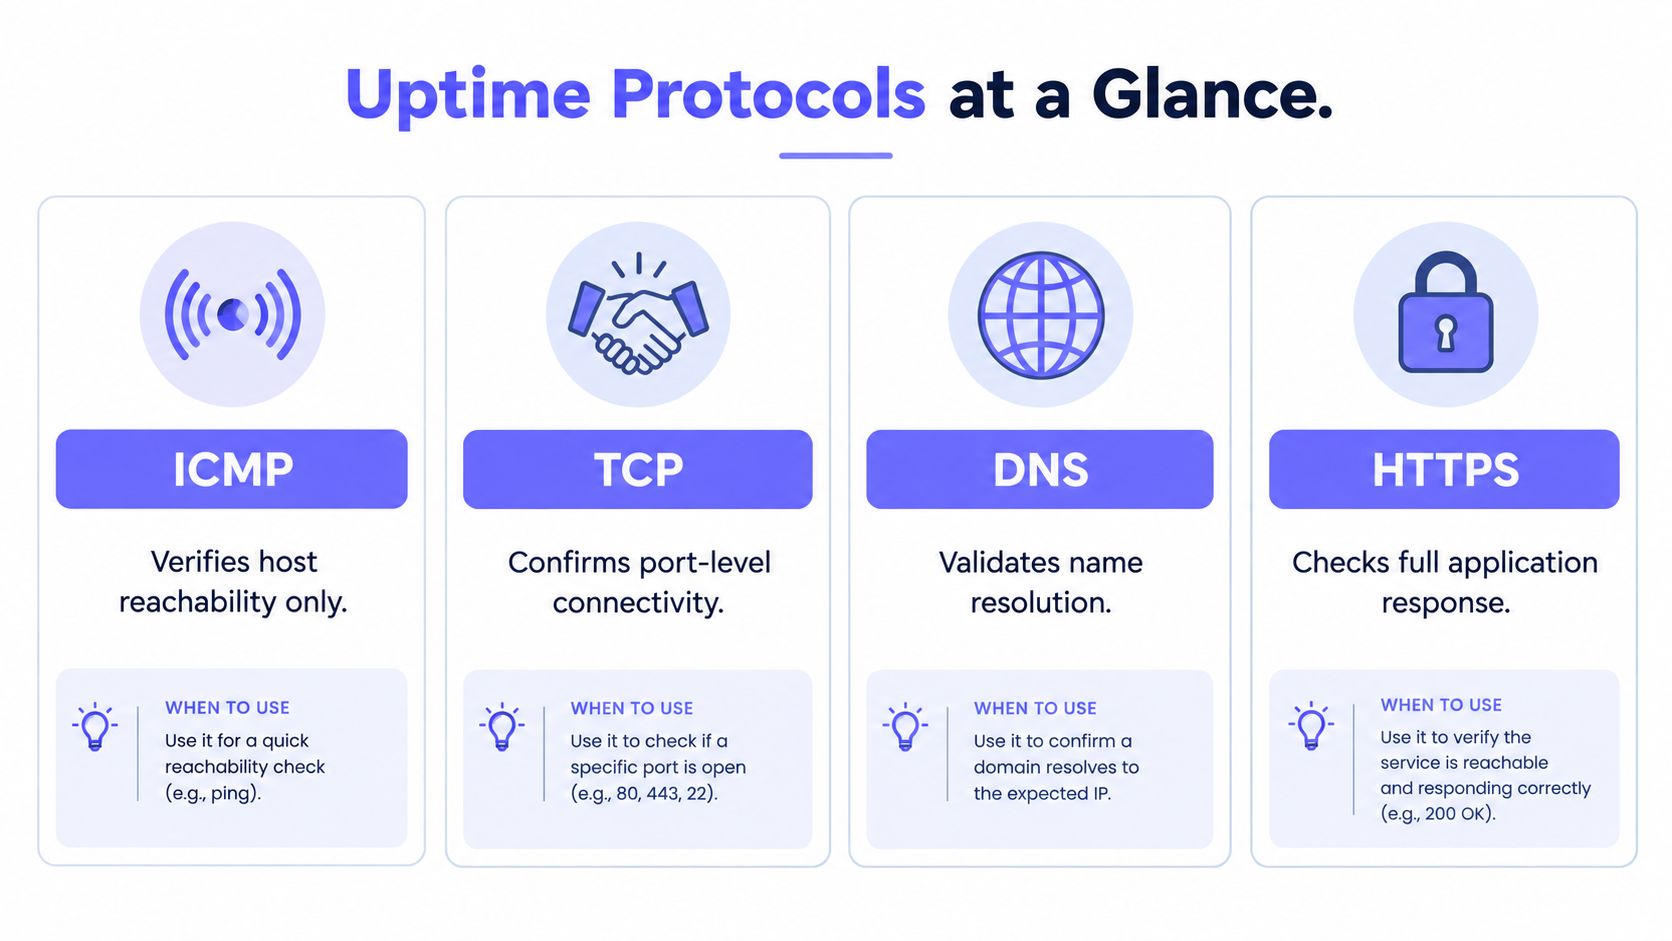
Pick the check that matches the failure
A TCP check proves more honest when the question is whether a service accepts connections. DNS checks matter when resolution is the sole dependency, because a reachable server still can't serve customers if names never resolve correctly. HTTPS checks go one step further and validate the application response itself, including the certificate path that customers depend on.
For mixed environments, SNMP belongs in a different bucket. The IETF defines SNMP as an application protocol for management stations and agents to inspect or alter variables in a device's Management Information Base, which is why it's still the standard way to poll device counters such as octets, errors, and discards IETF SNMP specification. That's device-state evidence, not service evidence, and both matter.
A 2024 analysis of application resiliency identified latency, packet loss, throughput, and application logs as complementary signals for pinpointing transaction failures application resiliency analysis. The useful lesson is simple, network symptoms often explain user-visible impact better than application logs alone.
A single-region uptime check is a guess with better branding. Independent vantage points turn that guess into evidence.
What synthetic monitoring is is a good companion topic for teams that want to distinguish passive telemetry from active probing. The practical move is to combine them, then require confirmation before sending a page that wakes somebody up at 3 a.m.
Architectures for Agents, SNMP, and Pull Versus Push
The cleanest host design is usually an agent that pushes telemetry out over HTTPS. That pattern avoids inbound management ports, reduces remote command paths, and makes the data flow easier to secure across NAT, firewalls, and segmented networks. It also fits servers better than trying to force everything through a network-device protocol.
Where each collection method belongs
SNMP still has a place, and it's the right one for switches, routers, firewalls, and other device classes that expose counters on their management plane. Because it's standardized, it gives operations teams a common way to collect interface status, traffic counters, and error conditions without installing software everywhere. For network gear, it remains the shortest path to useful state.
Active probing belongs outside the fleet. A check that runs from multiple regions can tell you whether customers can reach a service from more than one path, which is valuable when the server itself looks healthy but the journey to it is not. That outside-in view is how you catch DNS failures, path-specific outages, and selective blocking.
A production setup rarely chooses one architecture and stops there. It uses agent telemetry for hosts, SNMP for infrastructure gear, and active probes for service validation, then correlates the three so a healthy device doesn't mask a broken service. Missing-data alerts matter here too, because a silent polling failure can look like normal health unless you watch freshness explicitly.
The device-level model is worth keeping clear. SNMP counters should be sampled as rates over time, not read as snapshots, because a raw counter without interval context is almost useless for diagnosing a live issue. Read-only access, poll freshness, and separate alerts for missing data are what keep the system trustworthy.

SNMP and MIB basics is a useful reference if the team needs a practical reminder of how device management data gets exposed. The better operational question is not which protocol is purest, it's which combination gives enough evidence to trust the alert.
Alerting Strategies That Reduce Noise Instead of Adding It
Alert fatigue is not a soft problem. Multinational research found it is the leading obstacle to faster incident response in nearly every organizational role surveyed, and UK respondents pointed to tool sprawl (61%), false alerts (54%), and alert volume (34%) as major sources of stress, with 15% admitting they deliberately ignored or suppressed alerts and 75% reporting outages after ignored alerts alert fatigue research. That's what bad signal design does, it trains people not to trust the system.
Build confirmation before paging
The first defense is correlation. A rising error rate plus packet loss is far stronger than either metric alone, and a multi-region check that agrees on failure is far more trustworthy than a single probe in one network path. Maintenance windows, escalation delays, and dependency-aware routing prevent the same incident from turning into a flood of duplicates.
The second defense is cleanup. Repeated identical alerts should be deduplicated, service teams should own clear severities, and the runbook should tell the on-call responder what to check before the incident becomes a guessing game. A monitor that pages five people for one root cause is not more mature, it's just louder.
Useful alert-quality measures are simple enough to track without a big process overhaul:
- Actionable-alert rate, how often an alert leads to a real operator action.
- Repeat-alert rate, how often the same issue keeps spamming the queue.
- Time to acknowledgement, how fast a trusted human responds.
- Discovery source, whether monitoring found the issue or a user did.
Rule of thumb: if most alerts don't change a decision, the problem is design, not staffing.
A smaller, correlated monitoring system often outperforms a sprawling one because people trust it enough to act on it. Teams stop ignoring notifications when alerts map cleanly to incidents, and that trust is more valuable than raw volume.
Scaling Monitoring Across Server Fleets and MSP Clients
Scale changes the problem in a subtle way. A few hosts can be watched by hand, but fleets and multi-client environments need rules, ownership, and routing that survive turnover. The monitoring stack has to know who gets paged, what gets suppressed, and which environment a signal belongs to before the incident starts.
Operational structure matters more than more checks
Uptime Institute's 2025 analysis reported that IT and networking issues accounted for 23% of impactful outages in 2024, and nearly 40% of organizations experienced a major human-error outage over the prior three years, with 85% of those incidents tied to staff not following procedures or weaknesses in the procedures themselves Uptime Institute outage analysis. That reinforces a hard truth, scale is partly a process problem, not just a telemetry problem.
For MSPs, that means per-client routing and tenant-specific escalation policies matter as much as device coverage. A Sev-1 sent to the wrong channel wastes time and erodes confidence, especially when the response path is split across several customers. White-label status pages and clear ownership boundaries help keep incident handling intelligible.
For internal teams, the same logic applies to environments and services. Templates, dashboards, and standardized alert definitions keep new hosts from becoming one-off exceptions, and they make it easier to onboard a new cluster or a new business unit without rebuilding the monitoring model. The goal is not more monitors, it's fewer decisions during failure.
A useful pattern is to centralize the logic and decentralize the ownership. Monitoring rules can live in templates or code, while routing and response expectations stay aligned to the service team that has context. That keeps the stack understandable when the fleet gets large enough that no one remembers every hostname by heart.
Migrating From Prometheus Zabbix and UptimeRobot to One Stack
Consolidation works best when it starts with the least risky checks. Uptime probes and cron jobs are usually the fastest win, because they're easy to validate in parallel and simple to compare against the old stack. Once those are stable, host metrics and network device health can move next, with dashboards translated rather than rebuilt from scratch.
Replace overlap before you replace everything
A practical migration keeps the old system running long enough to prove equivalence. Prometheus queries, Zabbix templates, and uptime monitors should be mapped one by one, then compared against the new view during a parallel run so the team can catch missed thresholds or duplicate alerts before cutover. Historical retention only needs to stay where it matters for compliance, debugging, or a specific audit trail.
The backbone of the move is usually a single place for server metrics, network device health, website uptime, and cron job tracking. Fivenines is one platform that covers those layers together, and teams looking at broader trade-offs can also compare a dedicated observability stack with a simpler monitoring platform through a Datadog vs Grafana comparison. The value in that comparison is usually clarity about what needs to stay, what can be retired, and what only exists because the stack grew by accretion.
Verizon's 2025 breach report analyzed 22,052 real-world security incidents, including 12,195 confirmed breaches across 139 countries, and found that exploitation of vulnerabilities accounted for 20% of incidents Verizon DBIR executive summary. The monitoring lesson is straightforward, correlated observability and fast routing matter more than manually checking isolated metrics after the fact.
A clean migration also retires exporters and duplicate alert channels on purpose. That means documenting what gets shut down, who owns the new dashboards, and how the old alerts are silenced so the team doesn't end up trusting two systems that disagree with each other.
Building a Monitoring Practice That Earns Trust
A monitoring stack earns trust when it matches real operational goals. The order is usually clear, start with uptime and host basics, add SNMP and dependency checks, then mature into templates, status pages, and monitored workflows that route incidents cleanly. The last step is treating ignored alerts as feedback, because every silence from the on-call team says something about the design.
A practical maturity path
- Basic visibility, track host health, service availability, and a few core network signals.
- Layered evidence, add SNMP, DNS, and multi-region checks so failures can be confirmed.
- Operational discipline, use templates, routing rules, and status pages to reduce drift.
- Trust metrics, measure alert quality and review false or ignored alerts on purpose.
The strategic question is simple. Does the stack produce signals people trust, or does it produce volume that no one wants to touch? Correlated monitoring usually wins because it turns infrastructure into a source of evidence instead of a source of anxiety.
If the current setup feels noisy, fragmented, or hard to trust, Fivenines gives teams a single place to watch Linux servers, network devices, uptime checks, and cron jobs without building a bigger stack around them. Visit Fivenines to see how a unified monitoring approach fits production operations, MSP workflows, and smaller teams that still need reliable alerting.