Automated Incident Detection for SRE Teams

Manual incident detection typically takes 8 to 15 minutes, while an experimental automated framework reduced detection-to-response time to 2.46 seconds in a controlled environment. That gap proves automation can transform triage speed, but it doesn't remove the need for careful controls against false positives and unsafe actions.
At 2:47 AM, an alert interrupts the on-call engineer's sleep. The first dashboard shows rising latency, the second shows normal host health, and the logs contain a stream of unrelated warnings. Fifteen minutes later, the engineer has confirmed a failed deployment, found the affected service, and started a rollback. The incident was detectable much earlier. The delay came from assembling context manually.
Automated incident detection changes that operating model. It collects telemetry, identifies unusual behavior, correlates related symptoms, classifies the incident, and routes it according to operational risk. The difficult part isn't proving that software can detect anomalies quickly. The difficult part is deciding what the system may do without approval.
Table of Contents
- The Hidden Cost of Manual Incident Detection
- How Automated Incident Detection Actually Works
- Detection Methods Across Telemetry Types
- Optimizing for Precision and Recall Trade-offs
- When Automation Should Stop and Humans Step In
- Building Context-First Detection with Fivenines
The Hidden Cost of Manual Incident Detection
At 2:47 AM, an alert wakes the on-call engineer. One dashboard shows rising latency, another shows normal host health, and the logs contain unrelated warnings. The engineer checks ownership, searches for a recent deployment, compares several signals, and begins a rollback. The service was failing earlier. The delay came from assembling evidence by hand.
Manual detection creates a cost that incident reports often miss. Reports capture when an alert fired and when service recovered, but rarely show the time spent deciding whether the alert mattered. That work includes checking dashboards, comparing current behavior with historical patterns, searching logs, and confirming which team owns the affected service.
A single symptom can also start several investigations. A disk warning may prompt host, application, and customer-facing uptime checks. Without correlation, three engineers can investigate one underlying failure while the service continues to degrade.
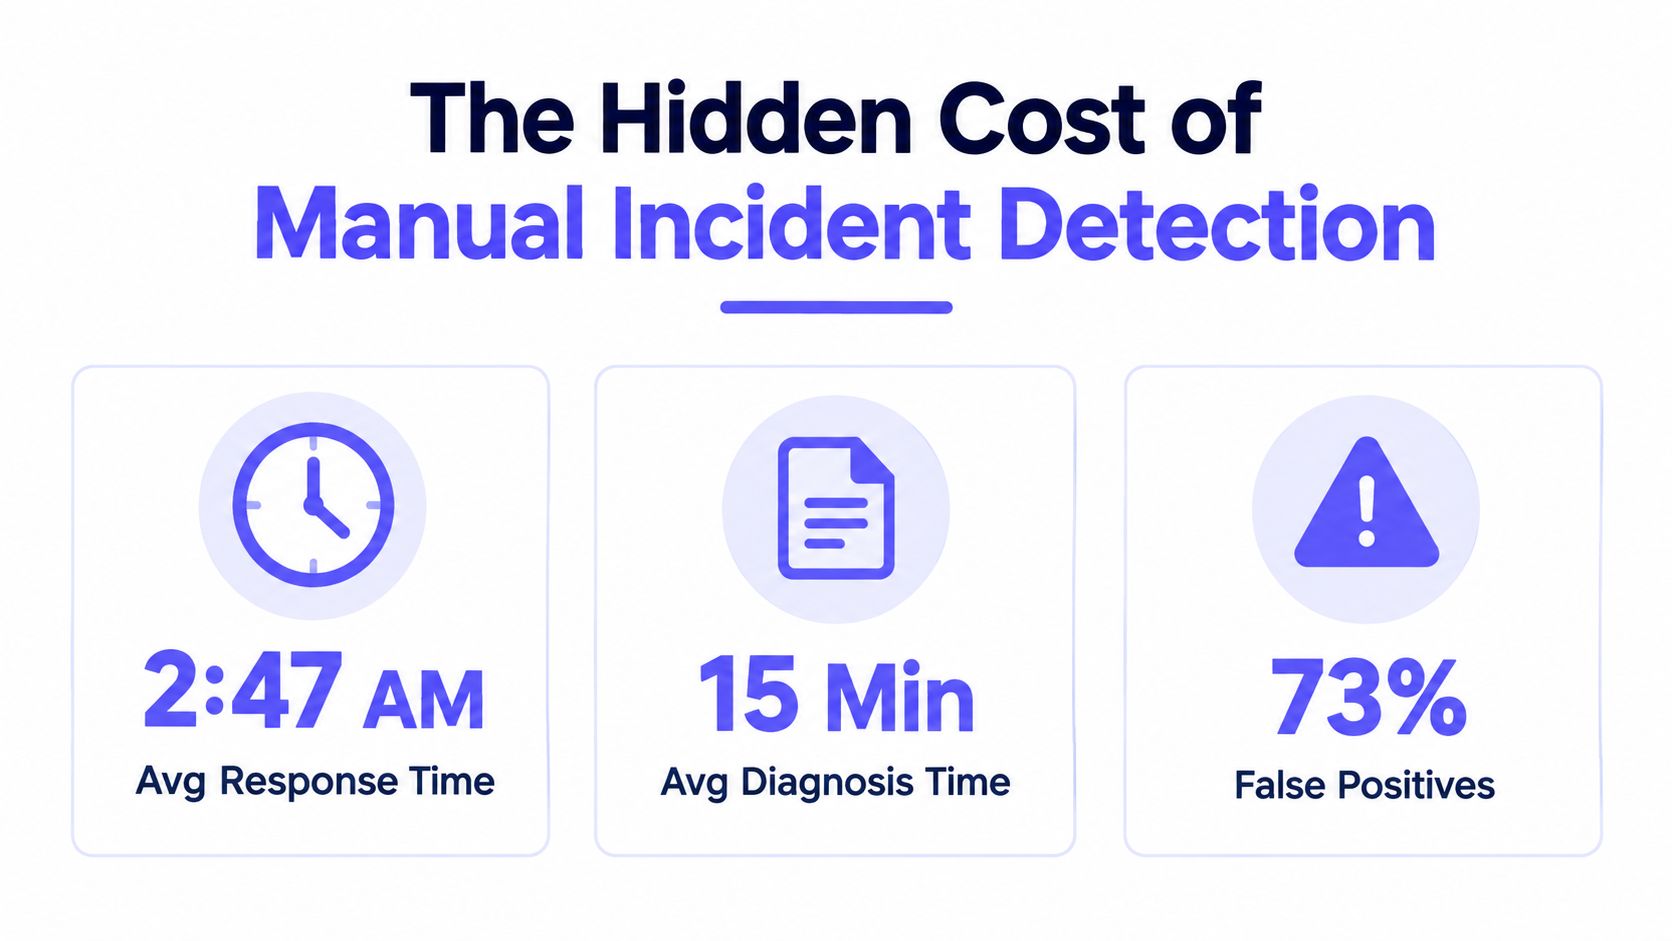
In the environment described by the cited study, manual-response times ranged from 8 to 15 minutes. An experimental framework using Isolation Forest anomaly detection, Random Forest classification, centralized logs, and containerized deployment reported a mean automated response time of 2.46 seconds (experimental incident-detection framework). That result came from a specific evaluation environment, so it is not a universal production benchmark. It still shows the operational cost of waiting for a person to assemble evidence.
Why alert volume isn't the only problem
False positives consume investigation time and weaken trust in paging. An alert that repeatedly fires without requiring action becomes background noise, including when the next occurrence indicates a real incident.
Monitoring also has direct and indirect costs. Teams comparing platforms should examine the costs and operational trade-offs of monitoring, including infrastructure, maintenance, integrations, and engineering time spent keeping the stack usable.
What automation changes
A useful detection system handles repetitive evidence gathering before paging:
- Signal collection: It gathers metrics, logs, traces, health checks, deployment events, and ownership metadata.
- Incident formation: It groups related symptoms into one incident instead of treating every observation as a separate failure.
- Triage: It estimates severity, likely cause, affected services, and whether the signal requires action.
- Routing: It pages an engineer, creates a ticket, sends a notification, or records the event for later analysis.
Automation should follow risk, not speed alone. Low-blast-radius, reversible actions can run with limited approval. High-blast-radius or difficult-to-reverse actions should preserve human ownership, even when detection and evidence gathering are automated.
Practical rule: Automate evidence gathering before automating irreversible decisions.
The strongest systems give responders a useful explanation, not merely a faster alert. They show whether the service is failing, what may be causing it, and which response is safe.
How Automated Incident Detection Actually Works
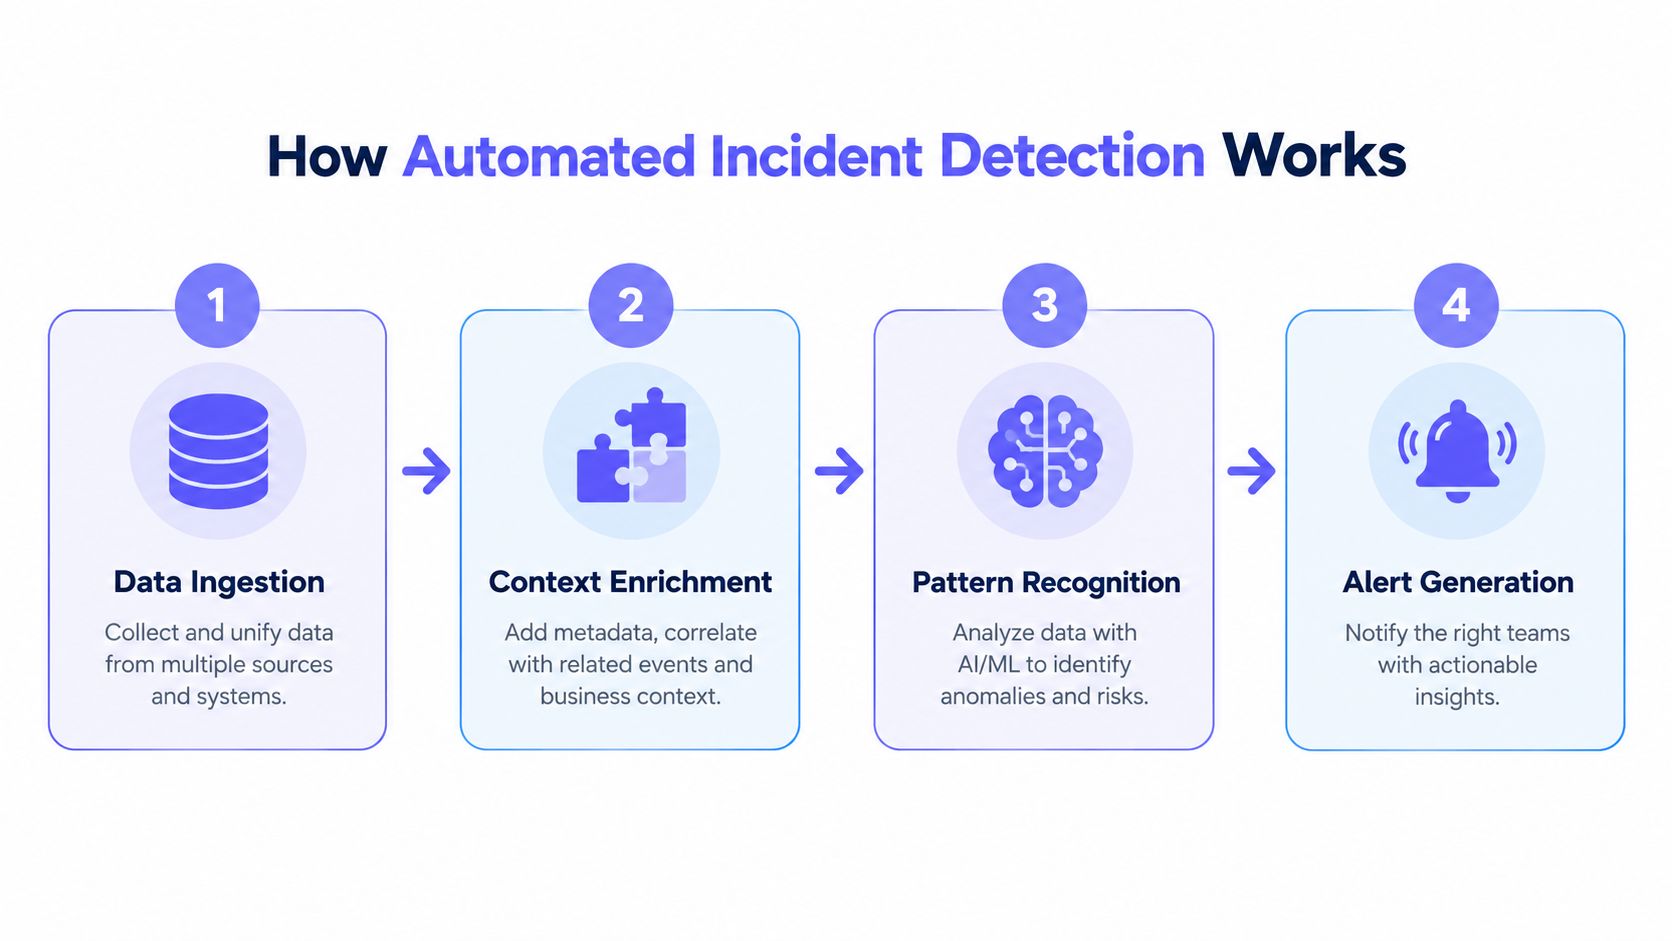
Automated incident detection is a pipeline, not a single model. Each stage answers a different operational question, and a weakness in one stage can undermine the others.
The first stage is telemetry ingestion. Linux hosts contribute CPU, memory, disk, process, and network signals. Applications contribute logs and service metrics. HTTP, TCP, ICMP, and DNS checks show whether users can reach an endpoint. Container and orchestration data adds information about restarts, resource pressure, and placement. Deployment records provide the change context that raw telemetry cannot provide.
The second stage adds context. A latency excursion means something different on a public API, a background worker, and a database replica. Ownership, service criticality, dependency relationships, tenant boundaries, and recent changes help the system distinguish a local anomaly from a customer-impacting incident.
From anomaly to incident
Anomaly detection identifies behavior that differs from an expected baseline. That baseline may use static thresholds, historical patterns, seasonal behavior, or a model trained on operational data. Static thresholds remain effective for clear conditions, such as a service being unreachable or a filesystem approaching capacity. Models become more useful when behavior is noisy, multidimensional, or difficult to describe with one threshold.
Classification follows detection. The system may classify an event as resource exhaustion, a network issue, a deployment regression, an application failure, or a dependency problem. Classification doesn't need to be perfect to be useful. It needs to provide a reliable enough hypothesis to improve routing and reduce investigation time.
Correlation then turns multiple observations into one incident record. That is where event correlation practices become operationally important. A failed deployment might produce elevated latency, increased error logs, failed health checks, and container restarts. A correlation layer should connect those symptoms, preserve the evidence, and identify the change as a likely common cause.
Routing is part of detection
The final stage decides how much attention an event deserves:
| Signal outcome | Appropriate handling |
|---|---|
| Informational deviation | Store for observability and trend analysis |
| Low-confidence anomaly | Create a ticket or request review |
| Confirmed service degradation | Notify the responsible team |
| High-confidence, high-impact failure | Page the on-call engineer |
| Safe, reversible condition | Permit a constrained automated action |
A system that pages on every anomaly just moves noise faster. A system that suppresses too aggressively hides failures. Detection quality depends on the relationship between evidence, actionability, and consequence.
The following video provides useful background on monitoring concepts, but teams should evaluate any approach against their own telemetry, failure modes, and ownership model.
Detection Methods Across Telemetry Types
A checkout can fail while CPU remains normal. Metrics may show rising latency, logs may record payment timeouts, and traces may reveal that a downstream provider is delaying requests. Automated incident detection works best when it combines these views instead of treating one telemetry type as authoritative.
Metrics work best for measurable resource and service behavior. CPU saturation, memory pressure, queue depth, request latency, and error rate can support clear detection conditions. Thresholds are transparent and easy to explain, so they suit paging when the connection between a signal and customer impact is well understood.
Metrics become less reliable when normal behavior changes. A fixed latency threshold may page during a legitimate traffic shift or miss gradual degradation that stays below the limit. Dynamic baselines can adapt to those changes, but guardrails must prevent the system from learning an outage as normal behavior. Baselines also need review after deployments, seasonal changes, and major traffic events.
Logs provide event detail. An application log can distinguish an authentication failure from a database timeout even when both produce high error rates. Log-based detection helps identify repeated exception patterns, failed migrations, malformed requests, and errors associated with a specific release. Poor structure, duplicate messages, and inconsistent severity levels make this method noisy.
Traces expose dependency behavior. A distributed trace can show whether an API's latency comes from a slow database call, a downstream service, or queue delay. Trace data is particularly useful when each component appears healthy in isolation but the complete user journey is slow. Sampling decisions matter, because missing traces during an incident can hide the path responders need to inspect.
Synthetic checks add an outside-in perspective. A platform using synthetic monitoring for endpoint validation can test service availability independently of internal dashboards. This helps teams confirm whether an internal anomaly affects an actual access path, while also revealing failures that application telemetry may not capture.
Where machine learning fits
Machine learning helps when explicit rules cannot describe a failure pattern cleanly. Isolation Forest can flag unusual combinations of signals, while a classifier can assign a likely incident category. An experimental framework introduced earlier reported a 94.5% weighted F1 score, a 2.8% false-positive rate, and a 2.46-second mean automated response time.
Those results depend on telemetry quality, training data, workload patterns, and incident definitions. Models should supplement clear rules rather than replace them. Automation can classify and prioritize low-risk signals, but teams should reserve irreversible or high-blast-radius actions for human review. Every model-generated alert needs an explanation a responder can inspect, including the signals that changed, the related entities, and why the event crossed the action threshold.
Optimizing for Precision and Recall Trade-offs
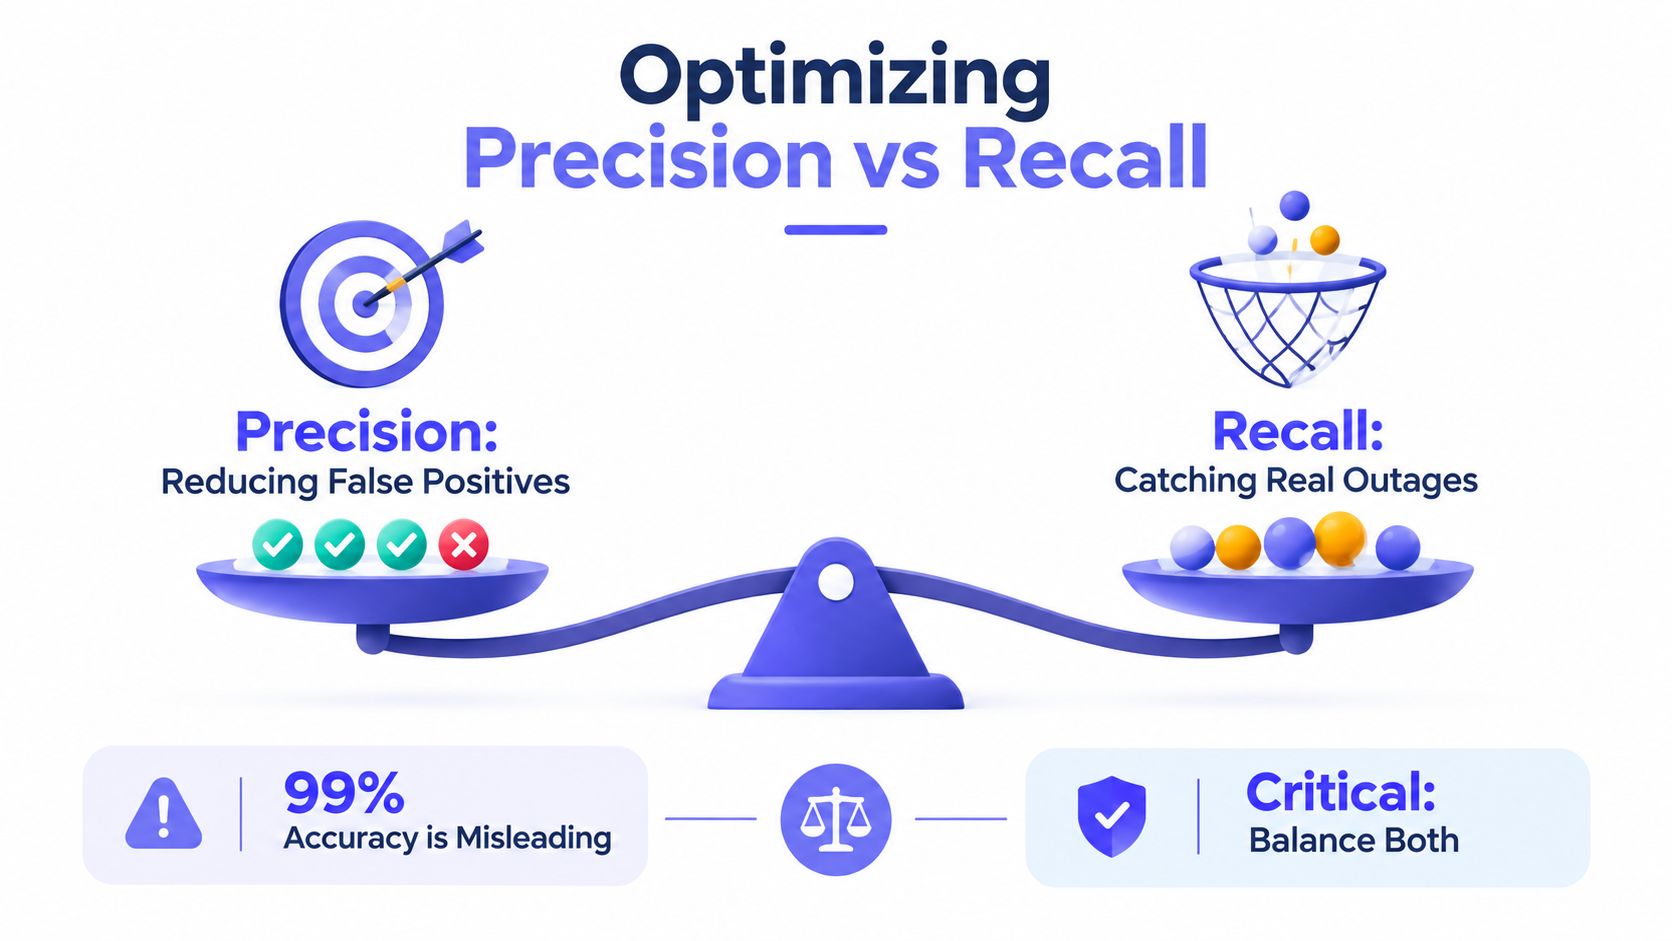
Raw accuracy is a poor operating target for incident detection. Most telemetry represents normal behavior, so a system can appear accurate while missing the failures that matter. Teams need to measure whether the system catches actionable incidents and whether it avoids making engineers investigate the same benign or duplicate signal repeatedly.
A practical architecture uses a high-recall first stage. That stage should favor sensitivity because missing an outage, security event, or critical dependency failure can carry a higher cost than reviewing a questionable signal. A second stage then applies incident-level correlation, deduplication, severity classification, and actionability rules.
A real-world alert-triage study reported that a machine-learning system suppressed 54% of false-positive alerts while detecting 95.1% of actionable incidents. The same study reported a 22.9% reduction in analyst response time and a 14% reduction in alerts requiring investigation within an incident (operational alert-triage study).
Measure incidents, not just alerts
Alert counts are easy to report and easy to misuse. One database failure can create alerts for latency, connection errors, queue growth, retries, and failed health checks. Counting those as separate failures makes the monitoring system look busier without making it more informative.
Teams should track:
- Incident-level recall: The share of actionable incidents the system identifies.
- Incident-level precision: The share of escalated incidents that require attention.
- False-positive suppression: The share of non-actionable alerts removed without hiding real incidents.
- Time to acknowledge: How quickly a responder receives and accepts a meaningful signal.
- Time to context: How quickly the responder receives ownership, recent changes, affected dependencies, and supporting evidence.
Thresholds should reflect operational cost. A public checkout service may justify a lower paging threshold than an internal reporting job. A security signal may require high recall and human review, while a routine capacity warning may create a ticket rather than interrupt the on-call engineer.
A good detector doesn't maximize silence. It maximizes the amount of useful attention produced by each alert.
Evaluation should also happen after releases, topology changes, and ownership changes. A model that performed well against yesterday's traffic can drift when services, tenants, or failure patterns change.
When Automation Should Stop and Humans Step In
The capability to automate an action doesn't establish that the action is safe. Detection, classification, decision-making, and remediation have different risk profiles. Treating them as one automation problem encourages teams to grant broad permissions before they understand the blast radius.
A practical risk model uses five questions:
- How large is the blast radius? Does the action affect one process, one host, one service, one tenant, or multiple customers?
- Can the action be reversed? A process restart is usually easier to undo than a data migration or access-policy change.
- How critical is the service? A low-priority batch job can tolerate more automation than an identity provider or payment path.
- How confident is the evidence? Multiple independent signals should support higher-risk actions.
- Can the team audit the decision? The system should record the evidence, policy, approver, action, and post-action result.
A workable risk-tiering model
Low-risk actions have a small blast radius, a reliable trigger, and a clear rollback. Examples include reopening a failed health check, restarting a non-critical worker, or creating a ticket with diagnostic context. These actions can run automatically after testing in shadow mode.
Medium-risk actions affect a production service but remain bounded and reversible. A workflow might pause after collecting evidence, request approval in ChatOps, or apply a rate-limited action to one instance rather than an entire fleet.
High-risk actions can cause broad customer impact or create difficult recovery conditions. Examples include changing network policy, rolling back a shared dependency, deleting data, rotating privileged access, or applying a configuration change across tenants. These actions should require human approval, explicit ownership, and a verified rollback path.
A 2025 study reported that 67% of leaders favored human-in-the-loop controls for high-risk fixes, while a simulated natural-language triage system achieved 72% triage accuracy and a 46% reduction in mean time to resolution (study on governed cognitive automation). The practical lesson is not that every action needs a meeting. It is that autonomy should increase only as reversibility, confidence, and auditability improve.
Controls that make constrained automation safer
Use shadow mode before execution. Let the system propose actions while humans compare its decisions with actual incidents. Add rate limits so one bad rule can't affect an entire fleet. Require post-action verification, and stop the workflow if health checks don't improve. Store an immutable timeline of what the system observed and did.
Approval boundary: Automate low-risk execution. Require accountable human ownership for actions with broad, irreversible, or cross-tenant consequences.
This boundary preserves the speed benefits of automated incident detection without confusing faster action with safer action.
Building Context-First Detection with Fivenines
Algorithmic sophistication can't compensate for fragmented telemetry. A 2025 cloud-security report found that 63% of organizations were held back by tool sprawl, 58% by limited automation, and 37% by difficulty integrating with DevOps pipelines. The same report found that 34% identified root-cause analysis as the most time-consuming part of incident response (cloud-security report).
Those constraints point to a context-first design. The system should know which service owns a signal, whether a deployment preceded the anomaly, whether an endpoint is failing from multiple locations, and which notification path reaches the responsible person. Without that context, AI can produce a faster version of the wrong conclusion.
A practical implementation starts with a narrow inventory:
- Map assets and ownership: Record hosts, containers, network devices, endpoints, scheduled jobs, services, teams, tenants, and criticality.
- Normalize signals: Use consistent names, timestamps, severity levels, and service identifiers across metrics, logs, checks, and events.
- Correlate changes: Attach deployment, configuration, certificate, dependency, and maintenance events to symptoms.
- Define action classes: Separate passive recording, ticket creation, paging, approval requests, and automated remediation.
- Test from outside the system: Confirm customer-facing paths with independent uptime checks rather than trusting internal health alone.
- Review outcomes: Measure actionable rate, duplicate rate, time to context, missed incidents, and post-action verification results.
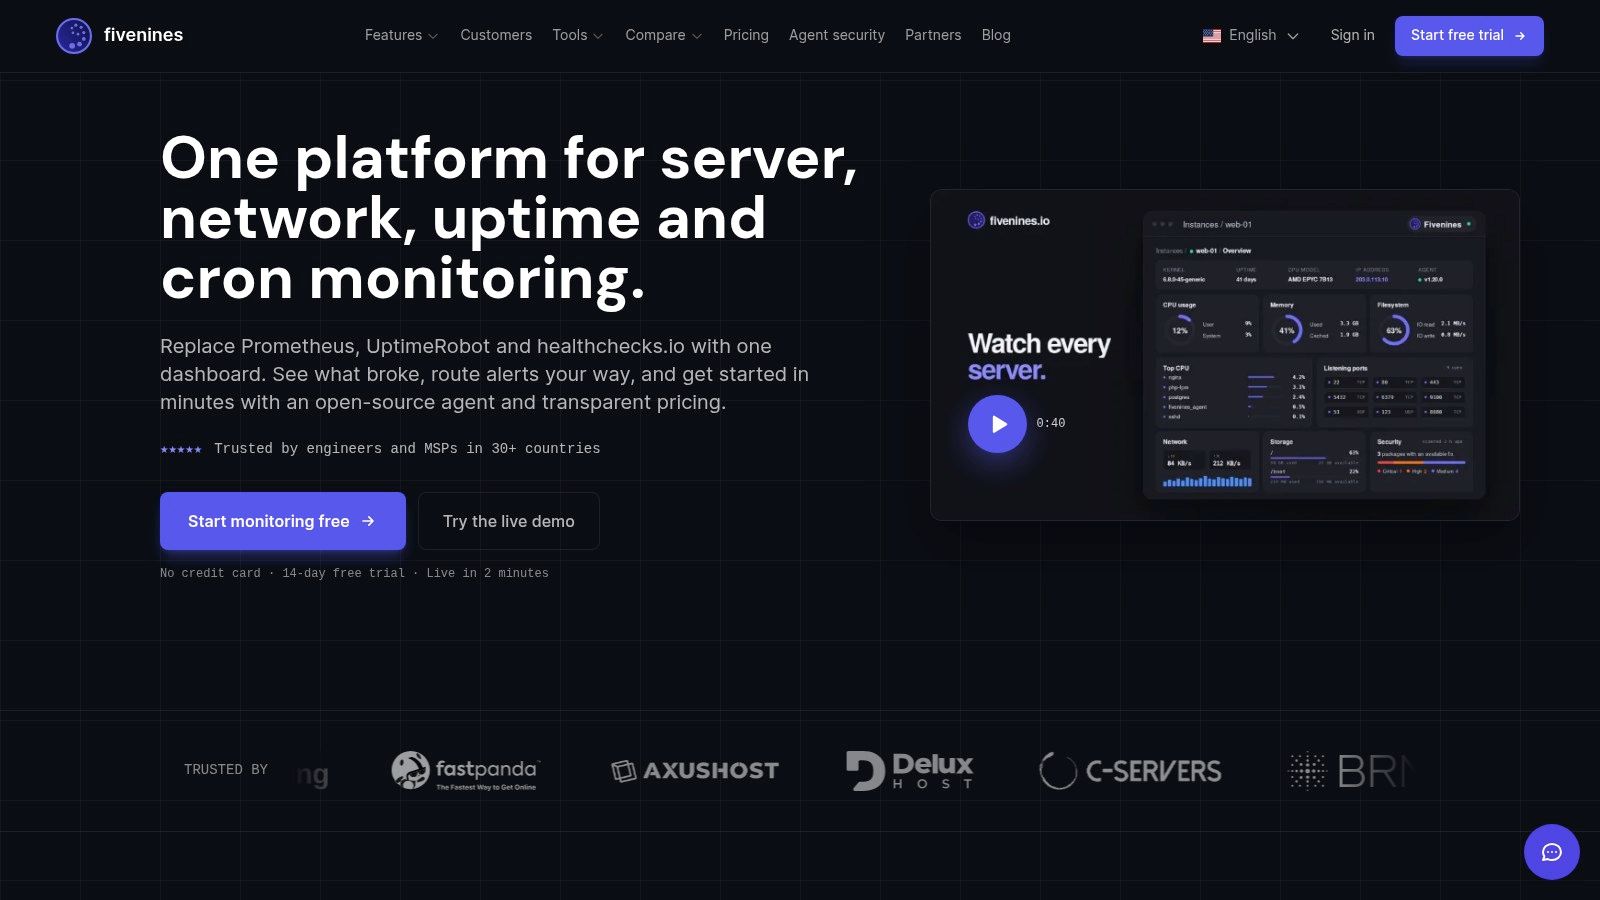
A platform such as Fivenines combines Linux server metrics, network device health, website uptime checks, and cron job tracking in one dashboard. Its open-source agent sends telemetry over HTTPS and can expose container, Proxmox, and NVIDIA GPU information alongside standard CPU, memory, disk, and network data. Multi-region HTTPS, TCP, ICMP, and DNS checks can confirm endpoint failures before paging, while workflows support routing, delays, retries, and escalations through channels such as Slack, Microsoft Teams, Telegram, email, SMS, Pushover, and webhooks.
Replace complexity only where it helps
Prometheus, Grafana, Alertmanager, Zabbix, UptimeRobot, and healthchecks.io can all fit legitimate operating models. The question isn't whether a single platform is always preferable. The question is whether the current stack gives responders enough context without excessive maintenance, duplicated alert rules, and disconnected ownership data.
Teams evaluating a unified observability platform should test a real failure path rather than a product tour. Stop a non-critical service, miss a scheduled job, introduce a controlled endpoint failure, and inspect the resulting timeline. The system should identify the condition, show supporting evidence, route it to the right destination, and make the next safe action obvious.
Fivenines offers transparent pricing starting at €9 per month, alongside a REST API, Terraform provider, custom dashboards, and workflow integrations. Those capabilities support an automation-first operating model, but the risk boundary still belongs to the team. The platform can surface and route incidents quickly. Engineers must decide which responses are safe to execute automatically.
Fivenines brings server, network, website, and scheduled-job monitoring into one operational view, with multi-region checks, incident timelines, workflow routing, and integrations for distributed teams. Visit Fivenines to test whether its context-first monitoring approach can reduce alert noise while keeping high-risk incident decisions under accountable human control.