Remote Infrastructure Monitoring: A Practical Guide

A server can be up, its dashboard green, and customers can still be failing to check out. That gap between a healthy host and a healthy service is why remote infrastructure monitoring matters, and why a ping check isn't enough. The hard part isn't collecting more charts. It's deciding which signals deserve a page, keeping telemetry safe to store, and noticing when the monitoring path itself goes silent.
Table of Contents
- What Remote Infrastructure Monitoring Means
- The Telemetry Worth Collecting Across Your Estate
- Why Remote Monitoring Pays for Itself
- Agents, Pull, Push and Outbound HTTPS Compared
- Security and GDPR Trade-offs to Plan For
- Alert Rules and KPIs That Stay Trustworthy
- Roll Out Remote Monitoring in Five Steps
- Moving From Prometheus, Grafana and UptimeRobot
What Remote Infrastructure Monitoring Means
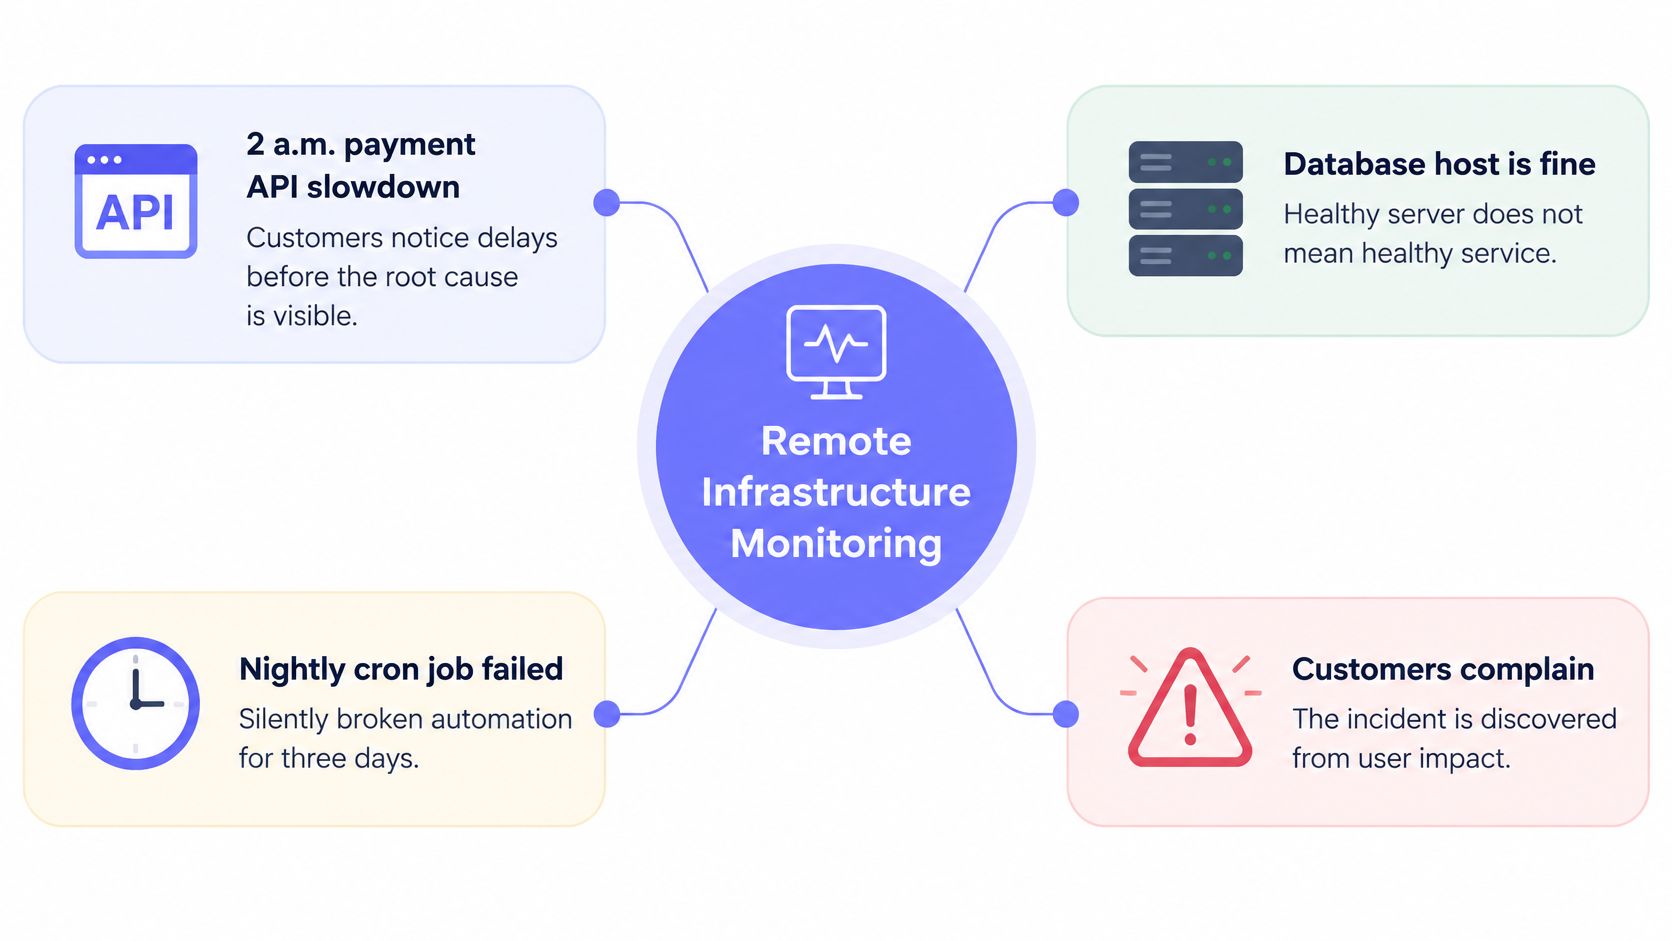
Say a payment API slows at 2 a.m. The database host looks fine, CPU is calm, and the box answers every ping. Underneath that, a nightly cron job has failed unnoticed for three days, so settlement files haven't moved, queues are ageing, and customers find the problem before the team does.
That's the failure pattern remote infrastructure monitoring exists to close. It continuously collects telemetry from servers, containers, network devices, public endpoints and scheduled jobs, sends it to one place an operator can reach from anywhere, and turns abnormal readings into alerts. Remote means the operator doesn't need to be on site or inside the internal network. The data travels to them.
One Desk, Many Rooms
The closest analogy is a nurses' station. One desk watches monitor feeds from many rooms on several floors, and the value isn't the screens themselves. It's noticing a change early enough for someone to walk into the right room before a patient is in trouble. A single patient's chart, checked once a shift, can't do that job.
Local tools have the same limit. top and a log file on one box describe that box while someone's logged into it. They say nothing about the switch feeding it, the container that restarted an hour ago, or the certificate expiring next week. Ping-only checks confirm reachability, not health.
The framing isn't new. The NIST Cybersecurity Framework detection guidance defines security continuous monitoring as observing information systems and assets at repeated or defined intervals to identify cybersecurity events and verify whether protective measures remain effective. Its scope reaches well past one host. It covers networks and network services, computing hardware and software, runtime environments, data, physical facilities and external service providers.
That scope maps directly onto DevOps and SRE work. CPU, memory, disk, network, container, uptime and job execution data get collected continuously, then abnormal conditions become alerts someone owns. Manual inspection can't keep up with an estate spread across regions and providers.
Monitoring tells you something changed. Alerting tells you someone must act.
A useful first exercise takes ten minutes. Write a one sentence definition for the estate in question, naming what it covers and what it deliberately doesn't. Then list the assets underneath it, host by host, endpoint by endpoint, job by job. Any asset that can't be named can't be monitored.
The Telemetry Worth Collecting Across Your Estate
Start from the failure, not from the metric catalogue. Ask what a customer would notice first, then work backward to the signal that would have shown it earlier. A checkout that times out points to HTTPS response time and the database host behind it. A missing overnight report points to cron completion, not CPU.
Five Signal Families
- Servers: CPU utilisation, load average, memory availability and disk fill rate show whether a host can keep doing its job.
- Containers: Per container CPU and memory, restart counts and OOM kills catch crash loops that host level averages hide.
- Network: Interface traffic, errors, drops and link state expose bad cables and saturated links. SNMP polling covers switches, routers and firewalls that can't run an agent, and dedicated router monitoring applies the same logic to edge devices.
- Uptime: HTTPS status, response time, TCP port checks, DNS resolution and SSL expiry measure the service from outside, the way customers see it.
- Cron: Completion, duration, output size and last success, checked against a schedule plus a grace period, catch jobs that never ran or never finished.
| Signal | What to measure | Starting threshold | Failure it catches |
|---|---|---|---|
| Server CPU | Utilisation and load average | Above 85% sustained for 10 minutes | Runaway processes, undersized hosts |
| Server memory | Available memory and swap activity | Available below 10%, or sustained swap-in | Memory leaks, OOM-driven restarts |
| Disk | Percent used and fill rate per day | Above 85% used, or projected full within 7 days | Full disks, log growth, failed backups |
| Containers | Per-container CPU, memory, restart count, OOM kills | More than 3 restarts in 1 hour | Crash loops, memory limits too low |
| Network interfaces | Traffic, errors, drops, link state | Error or drop counter rising across consecutive polls | Bad cables, duplex mismatch, saturated links |
| Network devices (SNMP) | Reachability, interface status, traffic | Device unreachable for 2 consecutive polls | Switch or firewall failure, silent link loss |
| Uptime (HTTPS) | Status code, response time, certificate expiry | Unexpected status code, response above 3 seconds, or certificate expiring within 14 days | Outages, slow responses, expired certificates |
| Uptime (TCP, ICMP, DNS) | Port open, host reachable, record resolves | Failure confirmed across regions | Dead services, DNS misconfiguration |
| Cron jobs | Completion, duration, output size, last success | No ping after schedule plus grace period (for example 5 minutes) | Missed runs, hung jobs, empty output |
Two edge cases trip up most starting configurations. On Linux, available memory is the number that matters, not free memory, because page cache is reclaimable and a host reporting almost no free memory may be perfectly healthy. Disk needs a rate, not just a percentage. A volume at 70 percent filling at 5 percent per day becomes an outage in under a week, while one at 85 percent that hasn't moved in months can wait for planned work.
Cron deserves the same scrutiny. A nightly backup can return exit code 0 and write zero bytes. Exit code alone reports success. Output size or duration catches the empty backup, so both belong in the check.
Estates running virtualisation or accelerators add two more signals. Proxmox cluster health means node status, quorum and storage pool state, because losing quorum changes what the whole cluster can safely do. GPU utilisation tells a team whether an expensive card is saturated, idle or thermally throttled, which CPU metrics can't show.
The order of work matters more than the tooling. Collect failure signals first. Add context metrics second. Then keep a short inventory of what each signal protects, and pick the top five customer facing failures and map each to one signal and one threshold before adding anything else.
Why Remote Monitoring Pays for Itself
A service can fail after business hours, with the first clear sign appearing when customers report a problem. The cost of that delay depends on the service, the time it takes to detect the failure and the size of its impact.
The 2013 Ponemon Institute study of data center outages analysed 67 unplanned data-center outage incidents. It reported a mean cost of $690,204 and a median of $627,418 per incident, with total incident costs ranging from $74,223 to $1,734,433.
A more recent benchmark gives a different view of the risk. In 2024, the median annual downtime from high-impact outages was 77 hours, and the cost reached as much as US$1.9 million per hour, according to a survey of 1,700 technology professionals by New Relic and ETR. These figures vary widely by service criticality and the number of systems affected. Use them as context, not as a substitute for estimating your own exposure.
Run the Local Calculation
Detection has a cost of its own. In the Ponemon study, detection costs totalled $1,591,367 across the incidents, an average of $23,752 per event. That includes the work of identifying an outage before repair begins.
Build a local estimate from three inputs:
Rough outage cost: hourly revenue multiplied by outage hours, plus engineer hours spent on detection at a loaded rate, plus the travel cost of sending someone to a site to check.
Compare that estimate with the cost of delayed detection. Continuous monitoring can surface failures outside working hours, and remote access to telemetry can help operators assess a problem without first reaching the site. Retained history supports incident reviews and audits; trends can also show when a disk or network link is approaching capacity.
Monitoring does not prevent failures. It pays for itself only when signals are reliable enough to prompt action. A flood of false pages can train responders to ignore alerts, while a silent gap in telemetry can leave a real failure undetected. Estimate the cost of one hour of undetected outage for the most important service in your estate, then use that figure to set a monitoring budget.
Agents, Pull, Push and Outbound HTTPS Compared
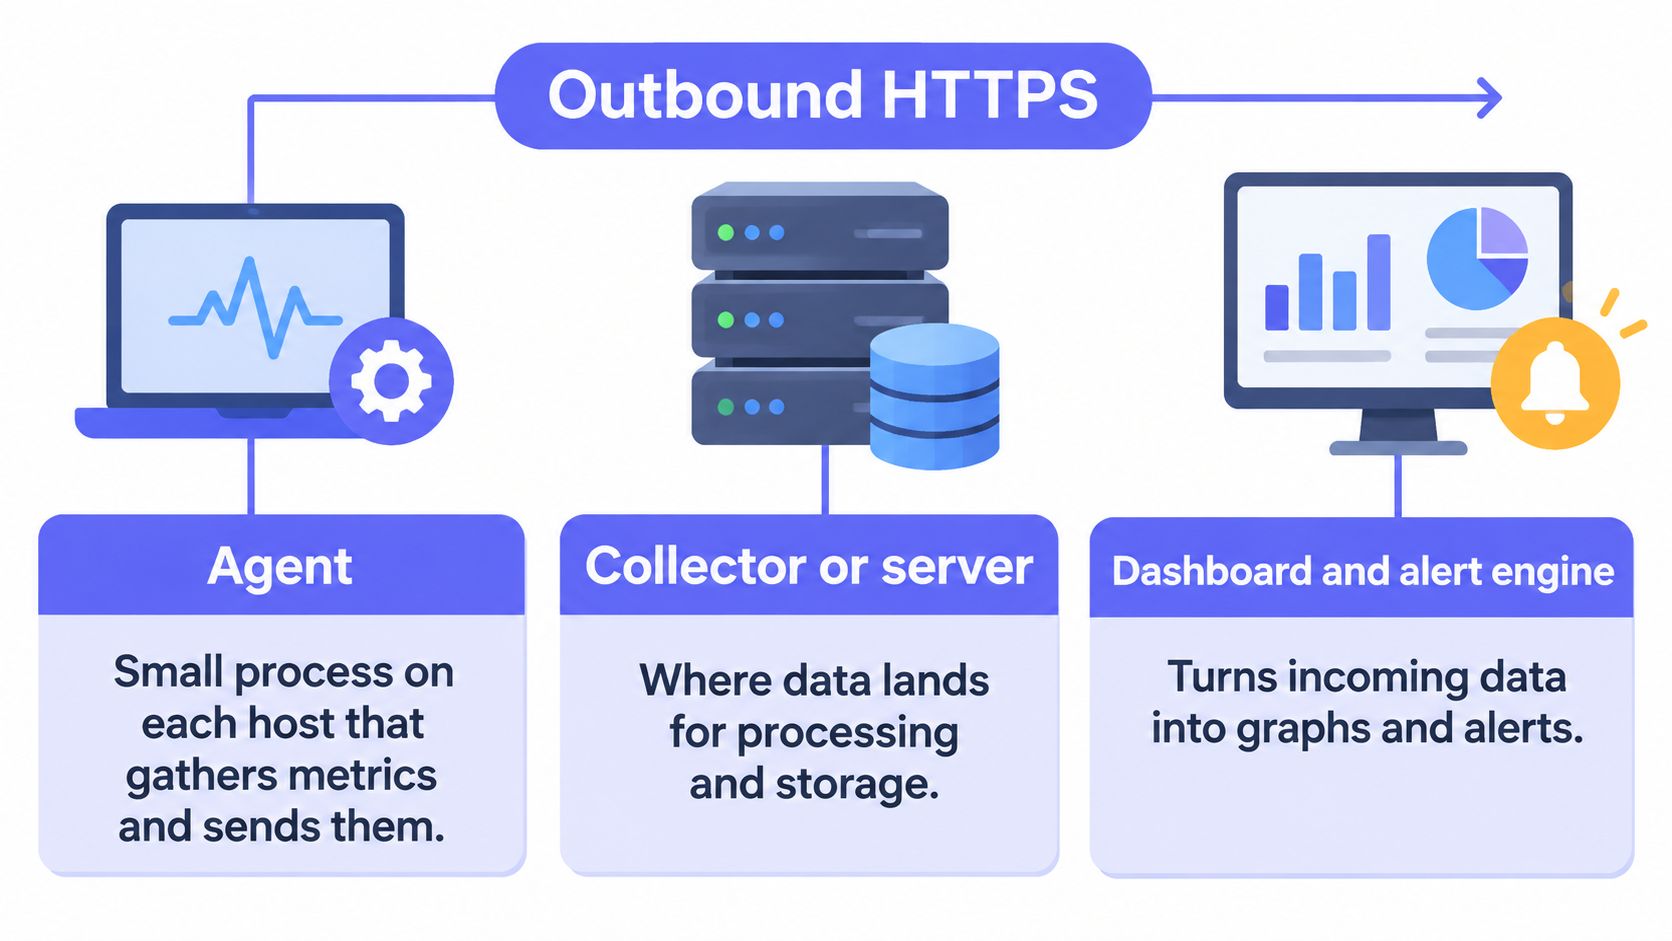
Say a managed service provider looks after customer servers behind NAT and restrictive firewalls. There's no inbound path to scrape, and asking every customer to open a port isn't realistic. An agent that opens an outbound HTTPS connection is the only practical route, which is why the collection model is an architecture decision, not a preference.
Every setup has three moving parts. An agent is a small process on each host that gathers metrics and sends them. A collector is where data lands for storage and processing. A dashboard and alert engine turns incoming data into graphs and pages.
Pull, Push and Polling
Pull means a central server scrapes each endpoint on a schedule. Prometheus works this way, and it suits a stable internal network where the team controls firewall rules and service discovery. Push means agents initiate the connection and send batches outward, so monitored hosts need no inbound rules at all. SNMP polling is agentless and fits switches, routers and firewalls, but each device gets configured individually. For estates where inbound ports are off the table, monitoring internal services without opening firewall ports sets out the outbound only pattern in detail.
| Model | How data moves | Inbound ports | Fits best | Main risk |
|---|---|---|---|---|
| Agent push over HTTPS | Agent opens outbound connection and sends batches | None on monitored host | Customer servers, NAT, multi-client fleets | Telemetry gap mistaken for host failure |
| Agent pull (scrape) | Central server connects to each endpoint | Scrape port open on each target | Stable internal networks, Kubernetes clusters | Exposed endpoints and firewall sprawl |
| SNMP polling | Collector queries device MIBs on a schedule | UDP 161 on the device, restricted to the collector | Switches, routers, firewalls | SNMP v2c community strings are weak; prefer v3 |
| Agentless SSH checks | Central tool runs commands on the host | SSH open inbound | Very small estates, one-off checks | Standing remote-command path and credential sprawl |
| Synthetic probes | External probes request public endpoints | None on the target | Customer-facing availability, DNS, SSL | Measures the outside path only, not internal health |
Encryption and trust need separating. NIST guidance on TLS states that TLS 1.2 or later should be used to protect communications, with TLS providing confidentiality for application-layer traffic such as HTTPS. Its remote access guidance also recommends mutual endpoint authentication where appropriate. Certificates still need validating, credentials rotating, and agent permissions restricting, because an encrypted channel carrying an over privileged token is still a liability.
Buffering decides how a setup behaves during an outage. A sound agent stores readings locally, timestamps them, and sends the backlog when the link returns, so a network blip doesn't leave a hole in the record. Sequence numbers help the collector spot gaps.
The failure mode to design for is silence. When no telemetry arrives, that can mean a dead host or a broken telemetry path, and those need different responses. A stale-data alert after three missed intervals separates the two. Map each network zone to a model and note where the agent can reach the collector before installing anything.
Security and GDPR Trade-offs to Plan For
More visibility isn't automatically safer. An agent that ships full command lines, process arguments, container labels and IP level network detail also ships whatever's inside those fields. That can include tokens passed as arguments, customer identifiers in container labels, and personal data in log lines. If retention and access controls are weak, the monitoring system becomes a convenient, centralised copy of sensitive operational data.
Telemetry is a security responsibility in its own right. CISA guidance on expanded cloud logging recommends detailed logging of shell activity, system calls, audit trails and cloud services, plus monitoring remote-access tools and connections. Its 2025 TIC guidance also emphasises collecting, processing and sharing telemetry across remote environments. That breadth is exactly why governance has to be designed rather than assumed.
What the Agent Should and Shouldn't Send
Data minimisation starts with defaults. Check which fields an agent sends before tuning anything else, then switch off what's not needed for an alert or an investigation.
- Command arguments and environment variables: Disable collection unless a specific check needs them, because secrets routinely end up in both.
- Process and container detail: Collect names, resource use and restart counts. Skip full label sets that carry customer or tenant identifiers.
- Network detail: Aggregate traffic and error counters usually answer the operational question without per connection records.
Controls around the agent matter as much as its payload. Run it as a least-privilege user that can't execute commands or read application secrets. Require validated TLS, rotate per host tokens so one leak doesn't expose a fleet, and accept only signed agent updates. Managed service providers need tenant scoped credentials and server side authorisation, so a compromised token can't reach another customer's data. Audit logs of enrolment and configuration changes, plus a documented break glass procedure, turn an agent compromise into an investigable event rather than a mystery.
GDPR Questions to Answer in Writing
IP addresses and user identifiers in logs are personal data, so they need a lawful basis, a purpose and a retention period per data type. Confirm EU hosting or other data residency options, sign a data processing agreement, and review the vendor's sub-processor list before production data flows. Retention settings deserve the same rigour as backup policy, and documented data retention policies give a workable structure for setting them. Data subject requests also need a named owner and a tested deletion path.
Say an auditor asks an MSP to demonstrate that client A's host data never reached client B's dashboard. That proof comes from tenant isolation, access logs and retention records created before the audit, not assembled during it. A one page data inventory listing each telemetry field, its purpose, its retention and who can read it is the artefact that makes that conversation short.
Alert Rules and KPIs That Stay Trustworthy
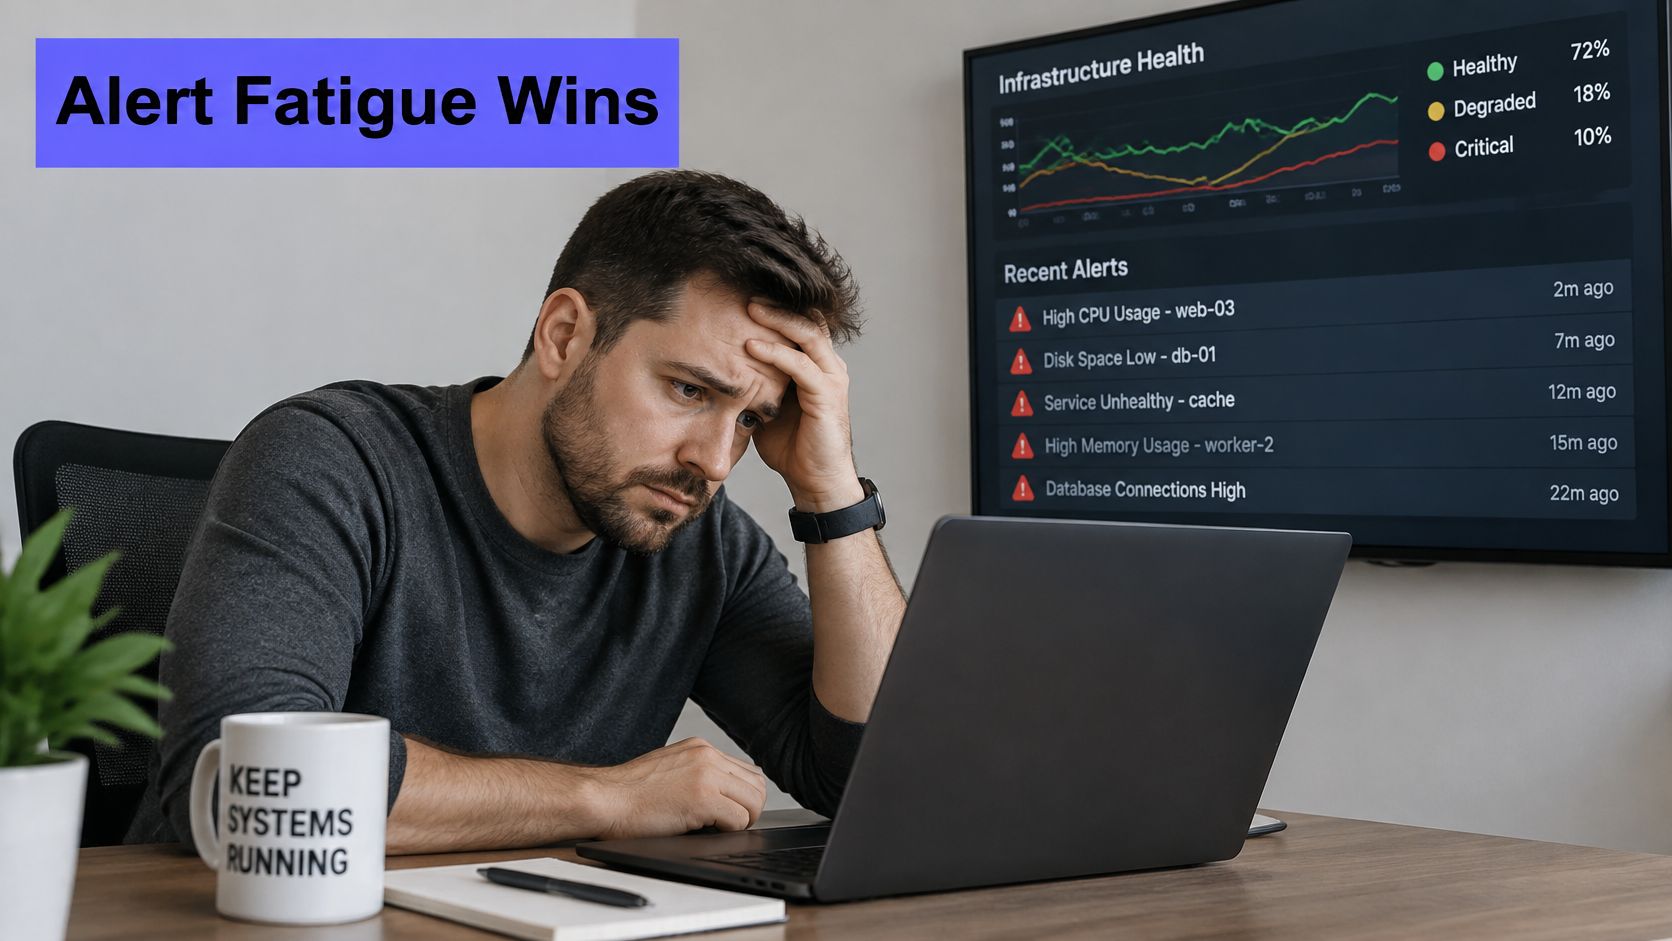
The weakest part of most monitoring is the human at the end of it. Grafana's 2025 observability survey identifies alert fatigue as the leading obstacle to faster incident response, while 43% of respondents say they spend too much time responding to alerts and 73% report outages caused by ignored or suppressed alerts. Adding telemetry, dashboards or AI generated alerts on top of that makes the underlying problem worse.
The visual version of that problem looks like this, with every signal demanding attention at once.
Confirmation Before Paging
A single failed probe proves very little. Regional network faults, a congested transit path and a probe host under load all look like an outage from one vantage point. Page only after a failure is confirmed from more than one region across consecutive checks, and let a single region failure raise a lower severity signal instead.
Correlation does the rest of the work. Maintenance windows silence planned work. Retries absorb transient errors. Flapping suppression stops a service oscillating around a threshold from paging repeatedly. One incident per root cause keeps a cluster wide event readable, so a single Proxmox node loss raises one incident rather than one per node that noticed.
For CPU, disk and cron thresholds, use the starting values in the telemetry table earlier in this guide and tune from there rather than inventing a second set here. Two sources of truth for the same rule will drift apart.
The following walkthrough shows how confirmation and routing behave in a live monitoring workflow.
Five KPIs Worth Tracking
Alert quality is measurable, and sound monitoring data quality is what makes those measurements believable. Track actionable-alert rate, duplicate-alert rate, mean time to acknowledge, escalations per week, and the share of incidents first found by synthetic checks versus host telemetry. Nobody can hand a team a universal number of sustainable alerts per service. That figure comes from measuring the team's own pages, which is why reviewing the last 30 days and labelling each page actionable or not is the fastest diagnostic available.
| Rule or KPI | Starting value | Purpose | Review when |
|---|---|---|---|
| Uptime paging rule | Failure confirmed from 2 of 4 regions across 2 consecutive checks | Filters regional network faults | Any false page in the month |
| Stale telemetry alert | No data for 3 consecutive intervals | Separates pipeline failure from host failure | After any agent upgrade |
| Actionable-alert rate | Track weekly; no universal target | Shows whether pages lead to action | Below the team's agreed level |
| Duplicate-alert rate | Target one incident per root cause | Shows correlation quality | Any cluster-wide event |
| Mean time to acknowledge | Track per severity level | Shows responsiveness and routing | Critical acknowledgements slipping |
| Escalation frequency | Track per week | Shows unowned or misrouted alerts | Rising trend |
| Synthetic-first share | Track monthly share of incidents first found by synthetic checks versus host telemetry | Shows coverage gaps in host telemetry | Synthetic share rising while host alerts stay flat |
Fewer, higher confidence pages beat a larger stack that nobody trusts. A page that reliably means "act now" gets acted on. A page that's usually noise gets muted, and then the outage lands in a muted channel.
Roll Out Remote Monitoring in Five Steps
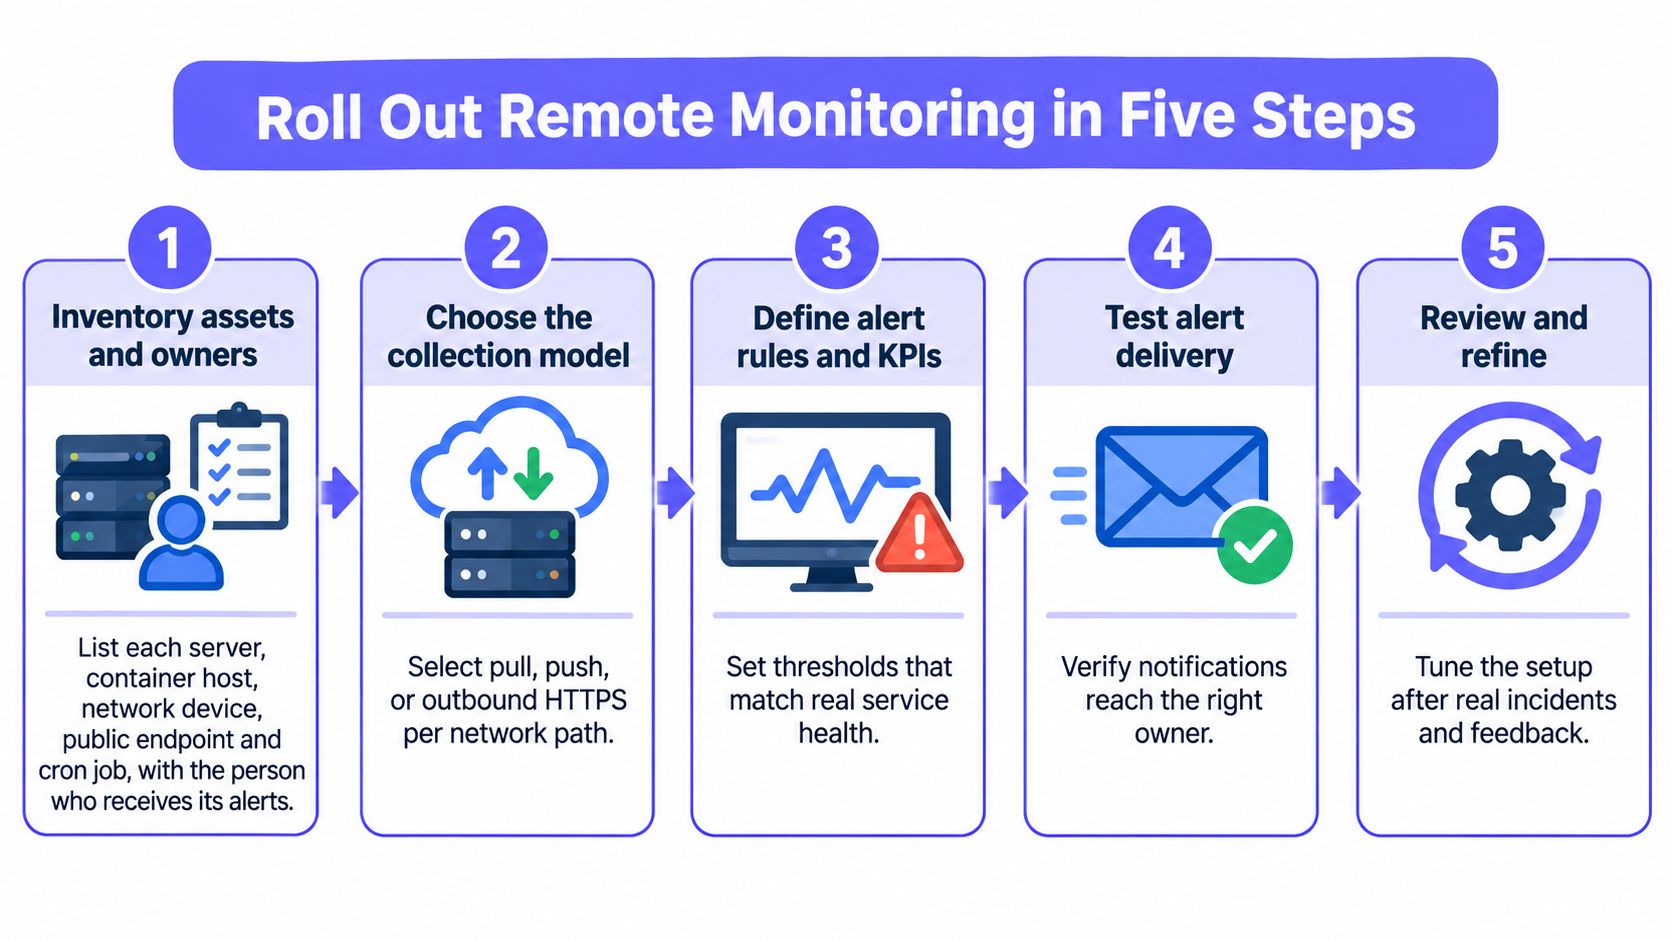
Rollout order determines whether a new setup earns trust or gets muted in its first week. Five steps cover it, and the last one matters more than the other four combined.
The Five Steps
- Inventory assets and owners. List each server, container host, network device, public endpoint and cron job, with the named person who receives its alerts. An unowned alert is a dashboard nobody reads.
- Confirm the collection model per network zone. Apply the zone to model mapping from the architecture comparison, agent push where NAT or customer firewalls block inbound access, SNMP for switches and firewalls, synthetic probes for public endpoints. This step is a confirmation pass, not a fresh design.
- Define alert rules and routing before enabling pages. Use the confirmation logic and KPI framework already set out, and keep staging on a separate alert path from production so test noise can't train people to ignore real pages.
- Set intervals and batching deliberately. Collection isn't free. A benchmark summarised in a recent observability study in the Journal of Engineering and Applied Science found that enabling OpenTelemetry on a 10,000-request-per-second service increased CPU use from approximately two cores to 2.7 cores and raised 99th-percentile latency from about 10 ms to 15 ms. Keep host metrics at a bounded interval, batch transmissions, sample routine healthy traces, and retain all errors, slow operations and state transitions. Don't colocate a CPU hungry collector beside a latency sensitive workload.
- Test the failure paths. Stop an agent. Block outbound HTTPS. Kill a cron job and let the grace period expire. Confirm each alert reaches the right person, on the right channel, within the expected time.
An untested alert path is an assumption, and assumptions surface at 2 a.m.
Tooling can compress this work. Fivenines covers these steps in one platform. Its Linux Server Monitoring provides Linux host metrics, hosted history and alert workflows with an open-source agent that pushes over outbound HTTPS. Uptime Monitoring runs HTTPS, TCP, ICMP and DNS checks from four probe regions. Monitors can be managed as code through the public REST API and the Terraform provider, and checks can be provisioned from CI/CD, so the inventory from step one can live in version control rather than in a console.
Start small. Put the agent on one non critical server and add one public endpoint, then run step five end to end this week before expanding to anything else. Broad coverage with unproven paging is worse than narrow coverage that a team trusts.
Moving From Prometheus, Grafana and UptimeRobot
Migrations fail on forgotten rules, not missing metrics. A scrape target is easy to recreate. A silence someone added two years ago, a routing exception for one noisy customer, or a ping URL buried in a cron job is what gets lost. Inventory comes first, before any tool gets switched off.
Inventory Each Source Tool
Write down what each tool holds today. Prometheus with Alertmanager holds scrape targets, recording and alert rules, routing trees and silences. Grafana holds dashboards and the data source queries behind each panel. UptimeRobot holds check URLs, intervals, regions, expected status codes, maintenance windows and alert contacts. healthchecks.io holds the ping URLs embedded inside cron jobs, plus their grace periods.
| Current tool | What it covers | What to carry over | Cutover risk |
|---|---|---|---|
| Prometheus with Alertmanager | Scrape targets, alert rules, routing trees | Thresholds, routing, silences, retention needs | Rules that silently stop firing after relabelling |
| Grafana | Dashboards and data-source queries | Panels that answer incident questions, not every panel | Dashboards pointing at a retired data source |
| UptimeRobot | HTTP checks, intervals, regions, alert contacts | Check URLs, expected status codes, maintenance windows | Losing check history and alert contacts |
| healthchecks.io | Cron heartbeat pings | Ping URLs embedded in each job, grace periods | Jobs still pinging the old endpoint |
| Zabbix or other agent tools | Host metrics, triggers, templates | Trigger logic mapped to new thresholds | Templates copied without checking the thresholds |
Run Both Systems in Parallel
Run the old and new setups side by side for at least two weeks. That window lets a weekly batch job execute under both, exposes rules that fire in one system and not the other, and reveals thresholds that behaved differently because the underlying metric isn't quite the same.
Map thresholds rather than copying metric names, because exporter naming and label conventions differ between tools. A rule that looks identical can stop matching after relabelling. Keep historical Prometheus data available for comparison during the first month, since capacity questions will reach back further than the new system has history.
Disable old notifications only after the new route has delivered both a test page and a real page. A test page proves the plumbing. A real page proves the rules, the routing and the on call rota agree with each other.
Consolidation is a legitimate reason to move. Fivenines combines server metrics, SNMP network monitoring, uptime checks and cron jobs in one tool, which reduces the number of systems a team has to patch, back up and keep awake. Count the alert rules, dashboards, check URLs and ping endpoints in the current stack first. That count is the migration scope, and it usually surprises people.
Fivenines brings Linux server metrics from an open source agent over outbound HTTPS together with SNMP network device checks, multi region uptime monitoring and cron tracking in one dashboard, so a team doesn't have to assemble and maintain four separate tools to get trustworthy pages. Monitors can be defined through the REST API or Terraform and provisioned from CI/CD, which keeps the setup described here in version control. Start with one non critical server and one public endpoint, test the alert path, and expand from there with Fivenines.