How to Monitor KVM Virtual Machines


KVM monitoring starts with three separate questions: is the VM running, are its resources under pressure, and is the service inside it responding? Use libvirt and virsh for VM state and counters, host metrics for shared bottlenecks, and a service check or guest instrumentation for application health. A running VM alone does not prove that its website or database works.
Which KVM monitoring tool should you use?
For a quick check on one host, start with virsh. It exposes the VMs managed by the libvirt connection you select, along with supported CPU, memory, disk and network statistics. Use virt-top when you want an interactive resource view and it is available for your distribution.
For an existing Prometheus setup, combine host metrics from node_exporter with a libvirt collector, dashboards and alert rules. Budget for exporter maintenance, permissions, collection failures and metric definitions. node_exporter alone does not provide a complete per-VM inventory.
For a hosted view, FiveNines provides an optional QEMU/KVM module alongside host monitoring. Enable QEMU monitoring on each relevant host, configure its local libvirt connection and check that data arrives. The module discovers domains visible to that connection and collects VM state and supported resource metrics. It is not enabled automatically on every server, and VM counters do not replace checks inside the guest.
If your hosts are managed by Proxmox, follow the Proxmox monitoring guide. Proxmox uses its own management layer; these virsh examples are for VMs managed through libvirt, not a replacement for Proxmox's qm commands or API.
Why KVM Monitoring Is Different From Standard Server Monitoring
A host can have spare aggregate CPU capacity while one guest is constrained by its vCPU allocation, affinity or an overloaded physical core. Likewise, several VMs can share a storage device or network uplink, so one workload can affect the others. Keep host and VM measurements on the same timeline before changing resource allocations.
Host monitoring answers questions about CPU pressure, physical memory, disks and network interfaces. Libvirt adds domain state and VM resource counters. Guest monitoring supplies the processes, filesystems and application details that are not necessarily visible from the hypervisor. Our Linux server monitoring fundamentals guide covers the host layer.
PCI passthrough changes what the host can observe. For a GPU assigned directly to a VM, collect GPU monitoring data inside that guest where the device is visible. If your workloads also use containers, see troubleshooting container monitoring.
Essential KVM Monitoring Commands
Select the correct libvirt connection
Run these commands on the libvirt host using an account with permission to query it. The examples explicitly request a read-only connection to qemu:///system. Replace example-vm, vda, vnet0 and default with values from your own inventory. Check the options supported by your installed version with virsh help COMMAND.
virsh --readonly --connect qemu:///system uri
virsh --readonly --connect qemu:///system list --all
The URI identifies the inventory you are querying. qemu:///system and qemu:///session are separate connections; the latter belongs to the user running the command. An empty list can mean the wrong connection, not that your host has no VMs. QEMU processes launched outside libvirt are not automatically included. See the libvirt connection guide.
List KVM VMs and check their state
# Defined and active domains visible to this connection
virsh --readonly --connect qemu:///system list --all

# Only domains currently in the running state
virsh --readonly --connect qemu:///system list --state-running --name

# One domain's state, reason and basic details
virsh --readonly --connect qemu:///system domstate example-vm --reason
virsh --readonly --connect qemu:///system dominfo example-vm
Start with the inventory, then inspect the state and details of the affected VM. dominfo gives an overview, including configuration and allocation information. It is not a live breakdown of application memory use. A domain that is intentionally shut off should not automatically trigger a production outage alert.
Collect CPU, memory, disk and network counters
virsh --readonly --connect qemu:///system domstats \
  --raw --state --cpu-total --balloon --interface --block example-vm
For a snapshot across the domains on that connection, omit example-vm. To limit a fleet query to running domains, use --list-running instead of a domain name. Fields vary with the driver, VM state and available devices; an absent field is not a measured zero.
Use --balloon for balloon and available guest memory statistics, and --interface for network counters. The --memory group concerns memory bandwidth monitoring; it is not a substitute for guest RAM statistics. The virsh reference documents each field.
Inspect a VM's disks and network interfaces
# Find disk target names before choosing a device
virsh --readonly --connect qemu:///system domblklist example-vm
virsh --readonly --connect qemu:///system domblkstat example-vm vda

# Find interface target names before requesting counters
virsh --readonly --connect qemu:///system domiflist example-vm
virsh --readonly --connect qemu:///system domifstat example-vm vnet0
domiflist shows interface targets, their type, source, model and MAC address. The source can be a bridge or virtual network; it is not necessarily the interface name expected by domifstat. Use the target shown for that VM and do not assume the first interface is always vnet0.
Check storage pool capacity
virsh --readonly --connect qemu:///system pool-list --all
virsh --readonly --connect qemu:///system pool-info default --bytes
Capacity and allocation describe the libvirt pool's accounting, which depends on its backend. They do not prove physical disk health or free space inside a guest filesystem. --bytes avoids treating a human-readable value such as GiB as though it were already bytes. Keep storage latency, physical device health and guest filesystem usage as separate checks.
Monitoring VM Performance
Turn CPU time into an interval measurement
cpu.time from a raw domstats response is cumulative CPU time in nanoseconds. Compare two samples over a measured elapsed interval:
CPU use, where one fully used core = 100%:
100 × (cpu_time_new - cpu_time_old) / (elapsed_seconds × 1,000,000,000)
For example, 15 billion additional CPU nanoseconds over five seconds represents 300%, or approximately three cores of CPU time. Dividing that result by four active vCPUs gives 75% on a four-vCPU normalization. Label the denominator clearly: these are different views, and host-side QEMU overhead or changing vCPU allocation can affect interpretation.
A restart, migration or counter reset can invalidate a pair of samples. Discard an invalid interval rather than displaying a negative load. virsh vcpuinfo example-vm helps inspect per-vCPU information, but its cumulative CPU time is not an instantaneous utilization percentage. Use virsh vcpupin example-vm to inspect configured affinity rather than inferring it solely from the last physical CPU shown.
Interpret memory without confusing allocation and usage
virsh --readonly --connect qemu:///system dommemstat example-vm
virsh --readonly --connect qemu:///system domstats --raw --balloon example-vm
Treat the current balloon allocation, the QEMU process's resident memory and memory reported from inside the guest as different measurements. Guest statistics depend on the balloon device, guest driver and collection configuration. Look at their freshness as well as their values. Missing or stale statistics should remain unknown.
For memory fields documented in KiB, multiply by 1,024 when exporting bytes. Read the definition of the specific field before interpreting “unused,” “available” or “usable.” The memory statistics API and balloon configuration explain these distinctions. Balloon movement alone is not proof that a VM needs more RAM; corroborate it with guest swapping, host pressure and application behavior.
Calculate disk and network rates from deltas
Two disk or network counter snapshots let you calculate an interval rate: subtract the old byte counter from the new one, then divide by elapsed seconds. A single cumulative byte value is not bytes per second. Repeat the calculation for each device and handle resets or replaced interfaces.
Compare a guest's I/O changes with the shared backend during the same period. Where available, run iostat -x 1 5 on the host and inspect the relevant storage layer. High traffic, errors or drops identify a symptom to investigate; they do not by themselves identify its cause.
Setting Up Automated KVM Metrics Collection
Before building dashboards, verify that a recurring collector can read the same inventory as your interactive session. This bounded Bash example records six raw snapshots at ten-second intervals. It queries libvirt without changing VM state and exits with an error if collection fails.
#!/usr/bin/env bash
set -euo pipefail
export LC_ALL=C

KVM_URI='qemu:///system'
for sample in 1 2 3 4 5 6; do
    captured_at=$(date -u '+%Y-%m-%dT%H:%M:%SZ')
    if ! stats=$(virsh --readonly --connect "$KVM_URI" domstats \
        --raw --state --cpu-total --balloon --interface --block); then
        printf 'KVM collection failed at %s\n' "$captured_at" >&2
        exit 1
    fi
    printf '\nSample %s at %s\n%s\n' "$sample" "$captured_at" "$stats"
    if [ "$sample" -lt 6 ]; then
        sleep 10
    fi
done
Save it as kvm-snapshot.sh and run it with bash kvm-snapshot.sh. The timestamp marks the start of each collection; collection time adds to the delay. Use actual elapsed time when computing rates. This script is a diagnostic log, not a Prometheus exporter or a guarantee of guest application health.
For continuous collection, choose the sampling interval, timeout, retention and failure alert explicitly. If using a systemd timer or cron, run the collector as the account whose libvirt access you tested, capture its exit status and rotate retained logs. A scheduler succeeding while its collector fails must not be reported as healthy monitoring.
Integrating KVM Metrics with Existing Monitoring Stacks
Keep host and libvirt collection distinct. A maintained libvirt exporter can supply VM metrics while node_exporter covers the host. Grafana dashboards should show VM identity, host, state, resource trends and last successful collection, so an old value cannot masquerade as current activity.
If you maintain a custom exporter, define its contract before writing alert rules:
- Identify a VM with its UUID and host, not only its display name.
- Convert documented units consistently. Prefer seconds for CPU time and bytes for memory or storage, following Prometheus metric naming.
- Distinguish counter values from gauges and calculate rates over a suitable interval.
- Report collection failure and stale data separately from VM state. A missing VM or failed query is not automatically a stopped VM.
- Keep an explicit inventory of VMs expected to run, and account for maintenance and migration.
For custom machine-level metrics, the node_exporter textfile collector must be configured with its directory. Write a complete temporary file on the same filesystem, then atomically rename it to a .prom file. Track the last successful collection as a metric value and alert on its age; do not keep serving an old file as evidence of fresh data. Prometheus sample timestamps in these files are not supported.
Alert on a stopped state only for a VM that should be running, with fresh collection and an appropriate delay. Separately alert on a failed scrape or collector, a missing expected VM, resource pressure and a failing service check. The actual expression depends on the metrics and labels your exporter exposes; there is no universal kvm_vm_state metric supplied by libvirt itself.
Common KVM Performance Issues
For CPU contention, compare the VM's interval CPU use with host per-core activity and the VM's affinity and scheduler settings. virsh --readonly --connect qemu:///system schedinfo example-vm reads scheduler parameters. Do not assume one universal default weight across cgroup versions, or change pinning based on one snapshot.
For memory pressure, compare host and guest evidence over time. Allocating more guest memory than physical RAM indicates overcommit, but does not establish current swapping by itself. Check actual working sets, swap activity and storage latency before deciding whether allocation is the problem.
For storage problems, identify the affected VM disk, its backing pool and the shared storage layer. virsh --readonly --connect qemu:///system pool-dumpxml default helps identify that backend. A pool with available capacity can still have latency problems; a large guest disk can still contain a nearly full filesystem.
Production KVM Monitoring Automation
Start with one host and a small VM inventory. Check that the collector sees the intended domains, that units match the source counters and that timestamps advance. Verify both an expected state change and a collection failure before enabling notifications broadly.
Periodically reconcile inventory and identify VMs by UUID. Lifecycle events can supplement polling, but a collector also needs to recover from missed events and reconnects. Avoid putting slow monitoring calls in VM lifecycle hooks: libvirt warns against calling back into libvirt from a hook, because the daemon may be waiting for it to finish.
For Fivenines, install the agent on the libvirt host, enable QEMU monitoring in that host's settings and configure the local libvirt URI. Confirm the agent can read the socket under your access policy, then verify that the VM inventory and supported metrics appear. The module is currently labelled beta in settings. Read the agent data and permissions model when deciding where to install it. Configure the alerting you need and test the notification path; discovery alone is not an alert policy.
Guest process details and application availability still require their own checks. Monitor backup completion and test restores separately as well: a VM snapshot existing is not evidence of a recoverable backup.
Keep the libvirt checks above for VM-specific diagnosis, and add a history of the host’s resource use. FiveNines’ Linux host monitoring records CPU, memory, disk I/O, network and process metrics so you can compare a guest slowdown with activity on the underlying server.
For an example from a production KVM environment, read the Southeast Networks case study. It explains how an MSP brought visibility across its virtualized servers, voice services and network together, and used an intermittent connectivity pattern to investigate a service disruption.
Troubleshooting Common KVM Performance Issues
VM is missing from virsh
Check the connection URI, user and host first. A domain in qemu:///session will not appear in the system connection's inventory. A permission error is a collection failure; resolve access for the intended monitoring account rather than making the libvirt socket public.
VM is slow but host looks healthy
Inspect per-core activity, active vCPU allocation and affinity alongside interval measurements. Then check guest processes and the shared storage or network path. A low host-wide average can hide a busy core, but it does not prove affinity is the cause.
Memory pressure or swapping
Check the freshness of guest memory statistics and correlate host swapping with guest behavior. Do not infer RAM shortage from a changing balloon or allocated-memory total alone.
High disk latency or network drops
Use domblklist and domiflist to choose the actual VM devices, then compare their counter deltas with the corresponding host interfaces and storage backend. Check both ends of a network path before attributing packet loss to a bridge.
VM will not start: where to find libvirt and QEMU logs
On a host using systemd, inspect the daemon your installation uses. Modular installations can use virtqemud; others use libvirtd:
journalctl -u virtqemud -u libvirtd --since '30 minutes ago' --no-pagerFor the system QEMU connection, per-domain logs are commonly under /var/log/libvirt/qemu/, with a filename based on the domain name. Session connections and custom logging configurations use different locations. Consult your libvirt daemon configuration and look for the specific startup error. These are hypervisor logs, not the guest application's log files.
How to check whether KVM is available
On the host, use the validation utility if installed:
virt-host-validate qemu
ls -l /dev/kvm
Read each validation result and verify that the intended process can access the KVM device. The host validation tool checks prerequisites; it does not replace VM or service monitoring. Inside a Linux VM, systemd-detect-virt --vm identifies the detected virtualized environment. A result identifying KVM is not proof that nested KVM acceleration is available inside that guest.
FAQ
What is the best tool to monitor KVM virtual machines?
Use virsh for immediate diagnosis and an interactive tool such as virt-top for local inspection. For ongoing history and alerts, choose between operating a libvirt/Prometheus stack and a hosted service such as Fivenines. Verify the supported metrics, collection freshness, access requirements and guest visibility for your environment.
How do I monitor KVM CPU usage per VM?
Read cpu.time with domstats --raw --cpu-total for the chosen domain and calculate its change over elapsed time. State whether your chart uses one core, active vCPUs or host capacity as the denominator. Cumulative CPU time is not CPU utilization.
How do I monitor KVM memory usage?
Use dommemstat and the domstats --balloon group, then check which fields are available and fresh. Allocated memory, QEMU resident memory and guest application usage are different values. Use guest instrumentation when you need process-level detail.
Can I monitor KVM VMs without installing agents inside each VM?
Libvirt can expose VM state and supported resource counters from the host. Some memory statistics still depend on guest support, and host collection does not reveal every process, filesystem or application fault. Add guest or external service checks according to what you need to detect.
How do I get alerts when a KVM VM goes down?
Maintain an inventory of VMs expected to run and alert on a fresh unexpected state for an appropriate duration. Also detect collector failure and missing expected VMs. Configure and test notifications in your chosen monitoring system, and use a service check if availability of the application is the actual requirement.
What is virsh domstats and when should I use it?
It collects selected statistics for named domains or a filtered inventory from one libvirt connection. It is useful for snapshots and automated collection; field availability depends on the driver and domain. Reading counters successfully does not establish application health.
How do I monitor KVM storage pool usage?
Use pool-list --all to find pools and pool-info POOL --bytes to inspect capacity and allocation without display-unit conversion. Review how the pool backend accounts for storage and monitor guest filesystem free space separately.
Useful Resources
 FiveNines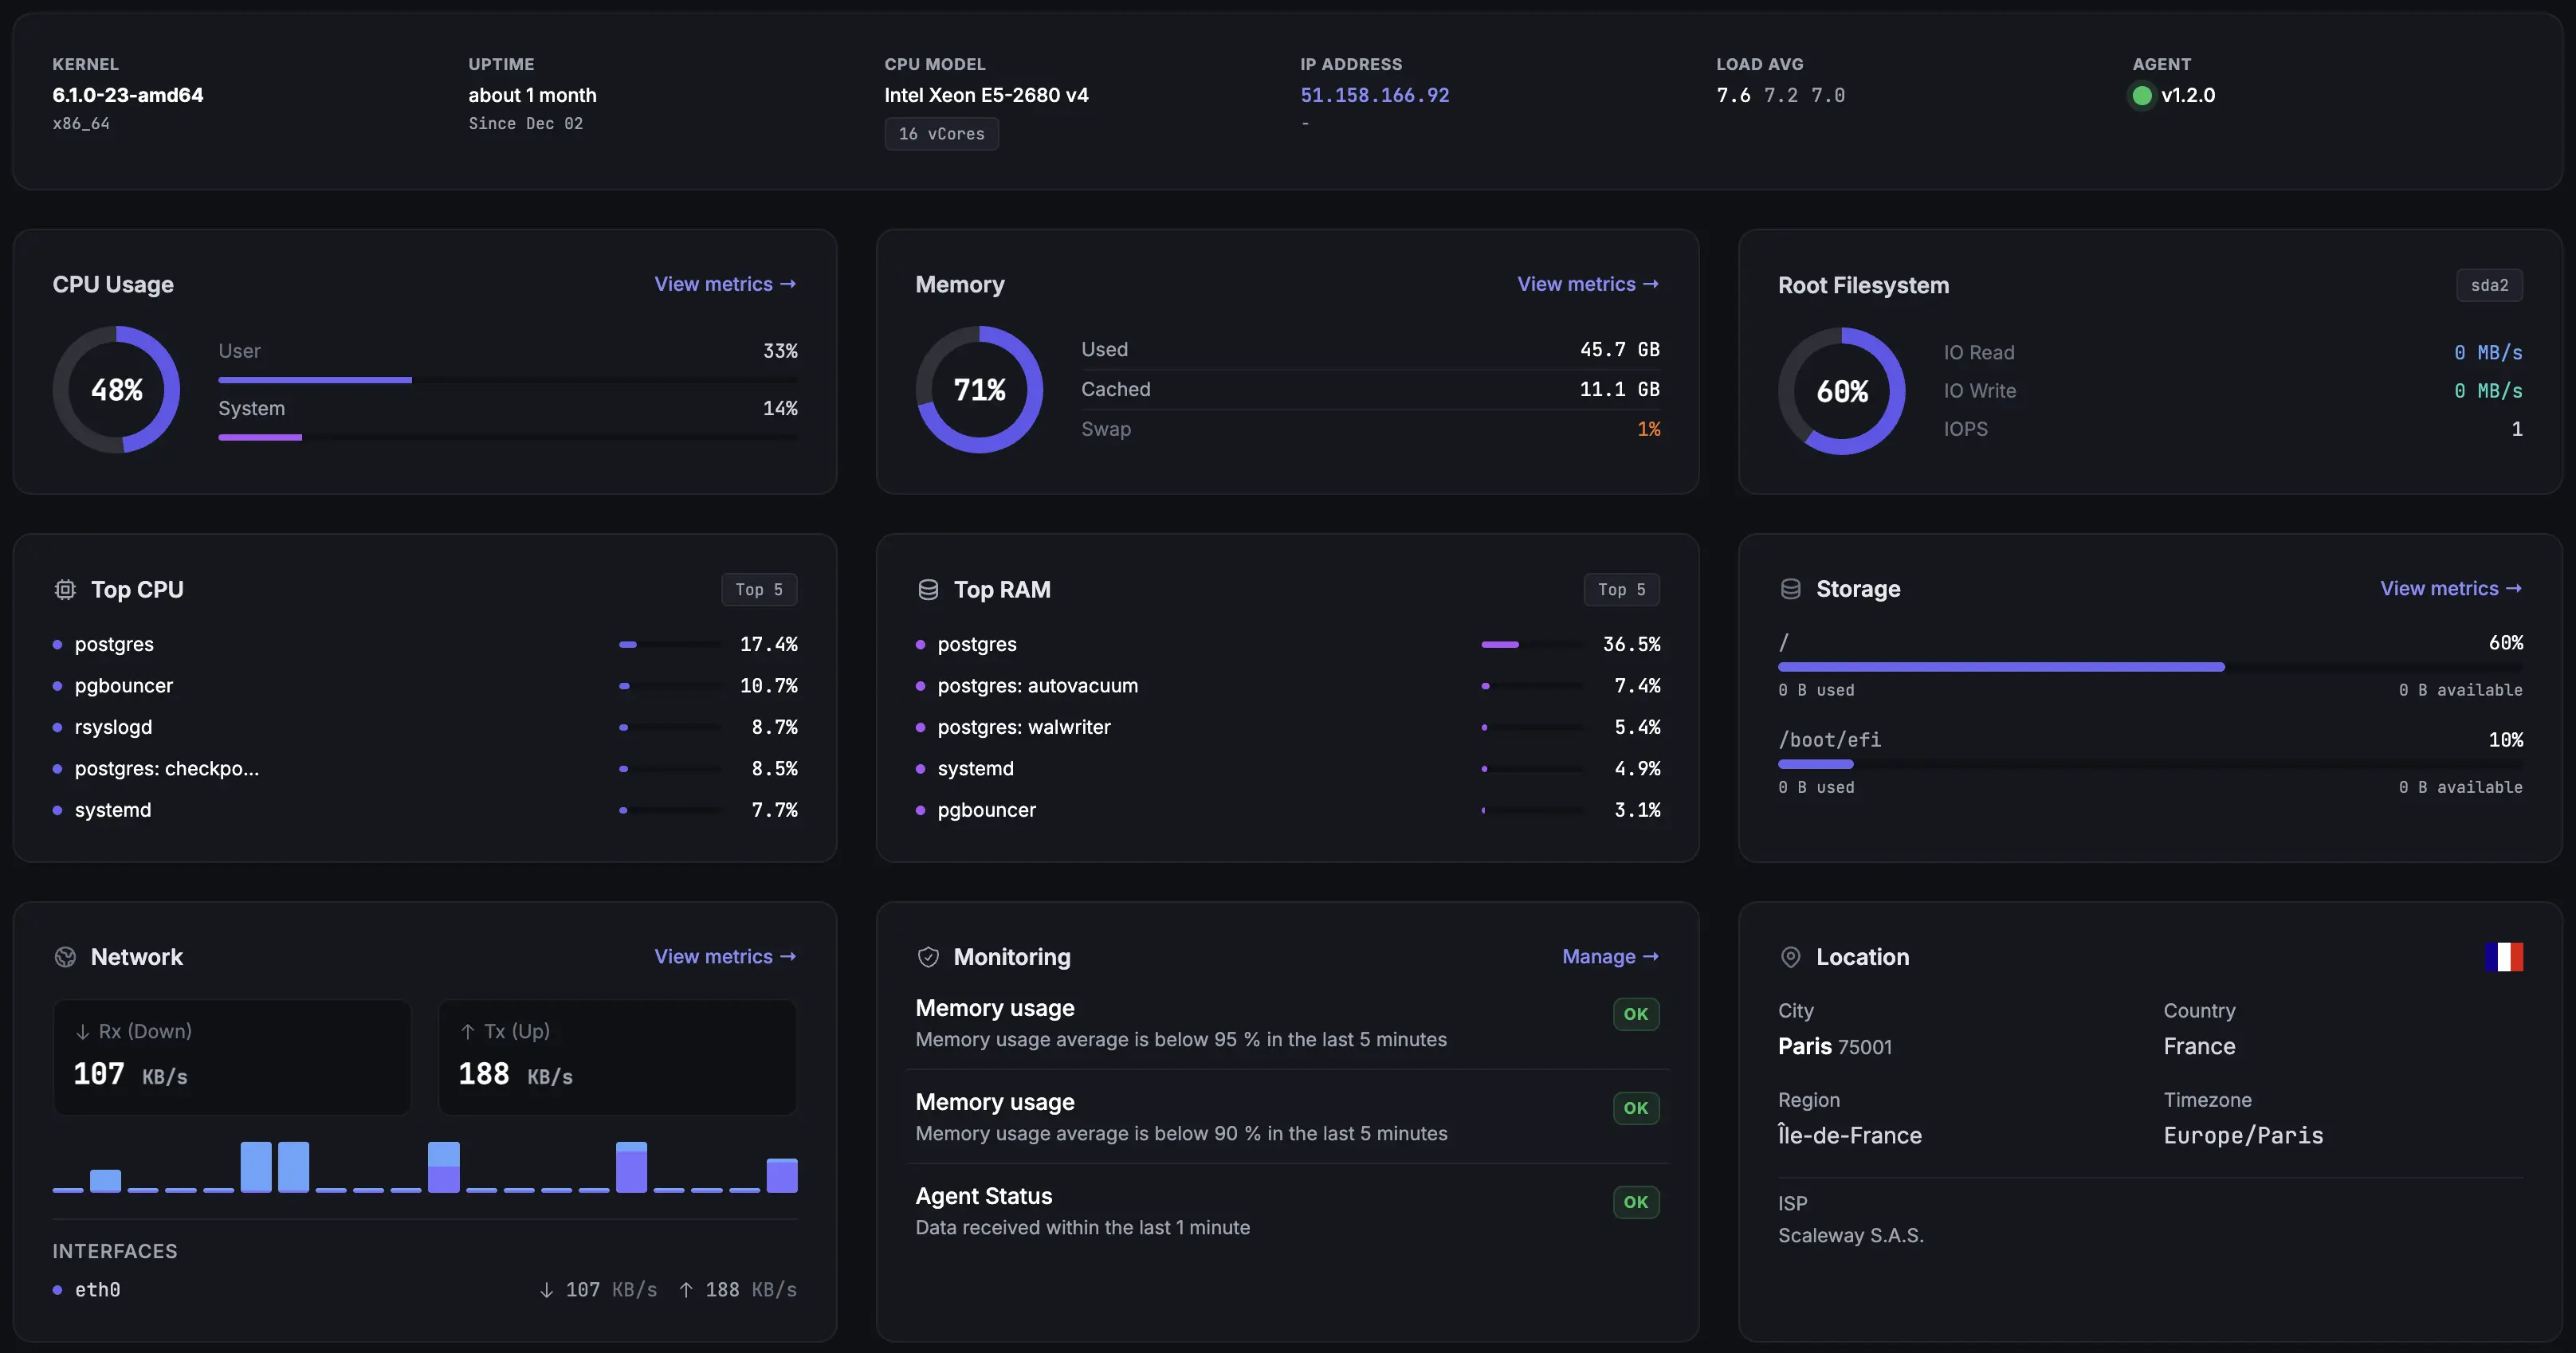
The official virsh reference documents command options. The KVM project documentation provides background on the virtualization layer. For a production rollout, verify the behavior of your installed libvirt version on a small set of VMs before extending collection to the whole fleet.