Custom Dashboards - Your Metrics, Your Layout, Zero Config Files
Pick the metrics, pick the servers, arrange the panels. No query language required. Your dashboard is ready in minutes, not hours.
Built for teams monitoring production infrastructure
No credit card · 2-minute setup
-
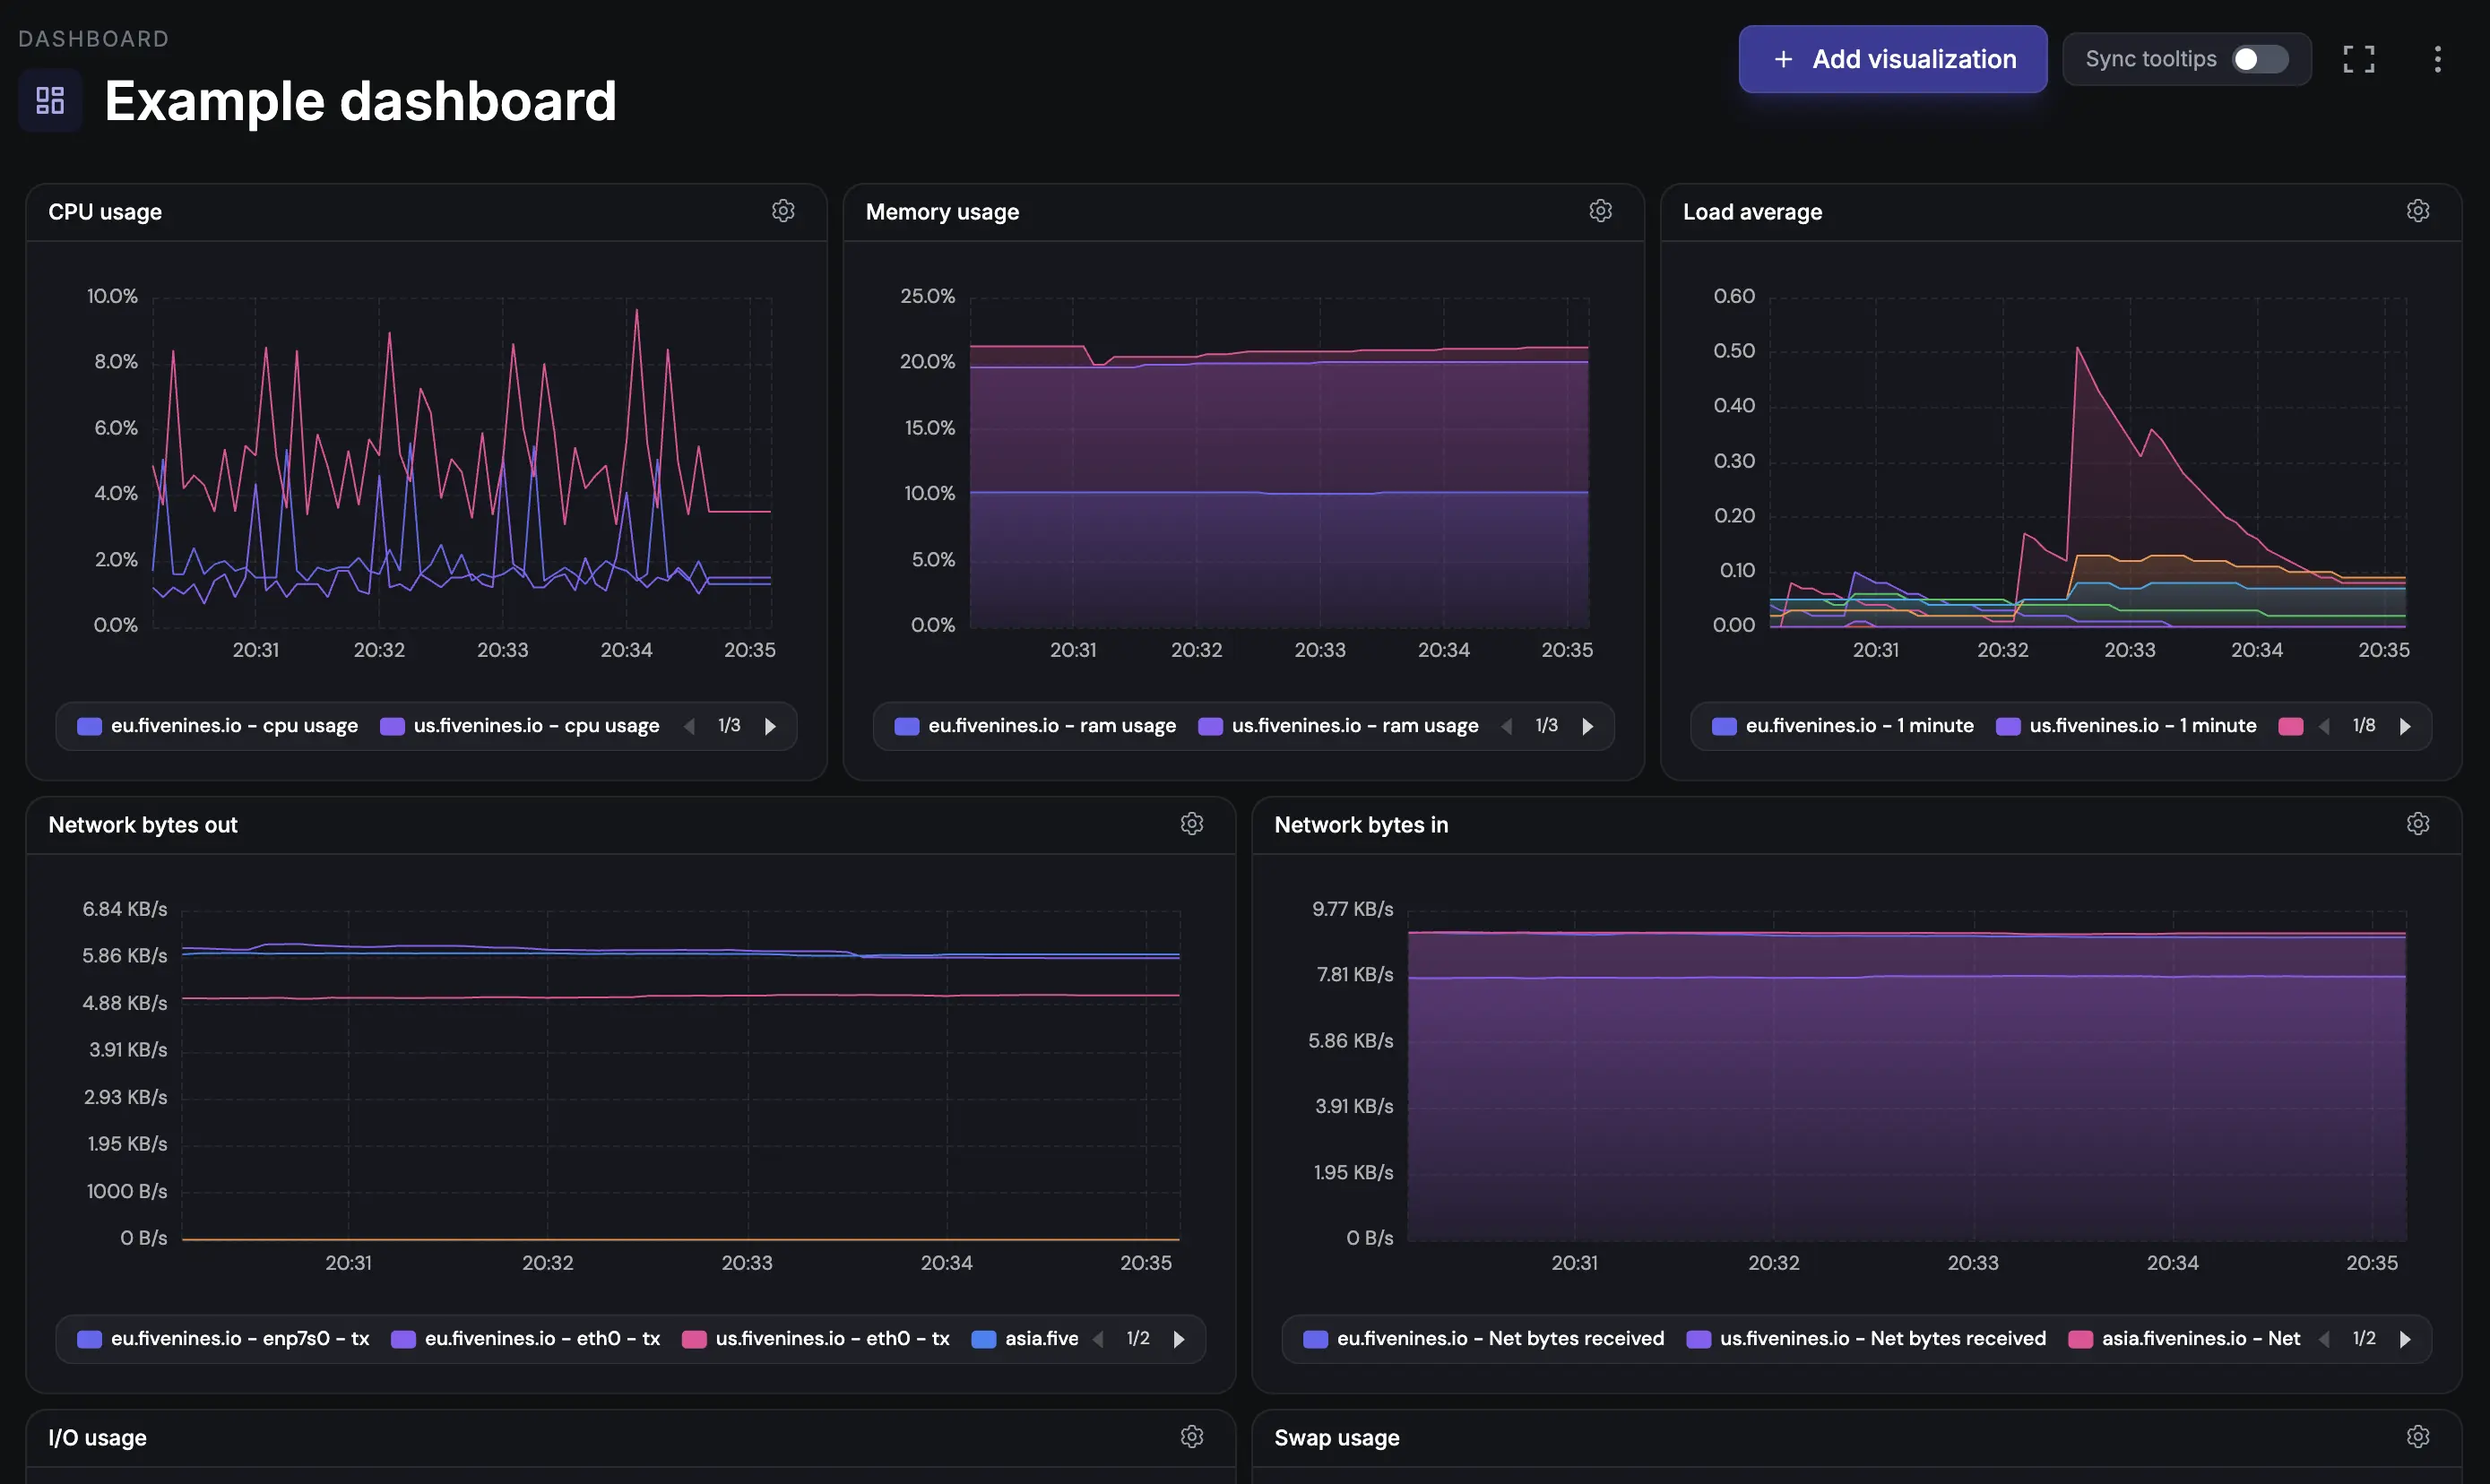
Drag-and-Drop Builder
Select any metric, drop it into a panel. Resize, rearrange, and organize until the layout shows exactly what your team needs.
-
Multi-Server Views
Combine metrics from different servers on one dashboard. Web server CPU next to database disk I/O next to cache memory - all in one view.
-
Shareable Public Links
Generate a public link for any dashboard. Share with your team, clients, or embed it in your wiki. No login required for viewers.
Deep dive
Pre-Built Templates
Don't want to start from scratch? Use pre-made dashboard templates for common scenarios:
Server overview
CPU, memory, disk, and network for a single server
Fleet overview
Key health metrics across all your servers
Docker host
Container resource usage alongside host metrics
Storage health
Disk space, I/O, RAID status, and S.M.A.R.T. data
Customize any template by adding, removing, or rearranging panels.
Deep dive
Real-Time & Historical Views
Dashboards update in real-time with live metric streaming. Switch to historical views to investigate past incidents - zoom into a 5-minute window or zoom out to see 6-month trends. All from the same interface.
What Teams Use Public Dashboards For
Status pages
Show clients that their infrastructure is healthy
Team visibility
Put a dashboard on the office TV for at-a-glance monitoring
Client reporting
Share monthly performance snapshots with stakeholders
How It Compares
| Feature | Grafana | Datadog | Fivenines |
|---|---|---|---|
| Setup time | Hours (+ Prometheus) | 30 min | 2 min |
| Query language required | PromQL | DQL | None |
| Drag-and-drop builder | Limited | ||
| Public sharing | Plugin required | Paid add-on | Built-in |
| Starting price | Free (self-hosted) | $15/host/mo | 14-day trial |
Frequently Asked Questions
Can I create multiple dashboards? +
Can other team members edit dashboards? +
What chart types are available? +
Can I embed dashboards in other tools? +
Is there an API for dashboards? +
Explore next
Related Features
Docker Monitoring
Visualize per-container CPU, memory, and network metrics in your dashboards.
Explore ->Proxmox Monitoring
Build unified views combining VM metrics, host data, and storage health.
Explore ->Server Alerts
Set thresholds on dashboard metrics and get notified via multiple channels.
Explore ->Cron Job Monitoring
Track cron job health and visualize execution history in your dashboards.
Explore ->See how Fivenines compares to other tools
Read our guide to the best infrastructure monitoring tools in 2026.
Build your first dashboard in 2 minutes
14-day trial. No credit card required.
No credit card · 2-minute setup · Cancel anytime