GPU Monitoring Without the nvidia-smi SSH Ritual
Stop SSH-ing into servers to run watch nvidia-smi. The Fivenines agent auto-detects your NVIDIA GPUs and streams utilization, temperature, VRAM, and power metrics on the default 60-second collection interval. No DCGM, no Prometheus exporters, no YAML files.
Built for teams monitoring production infrastructure
No credit card · 2-minute setup
-
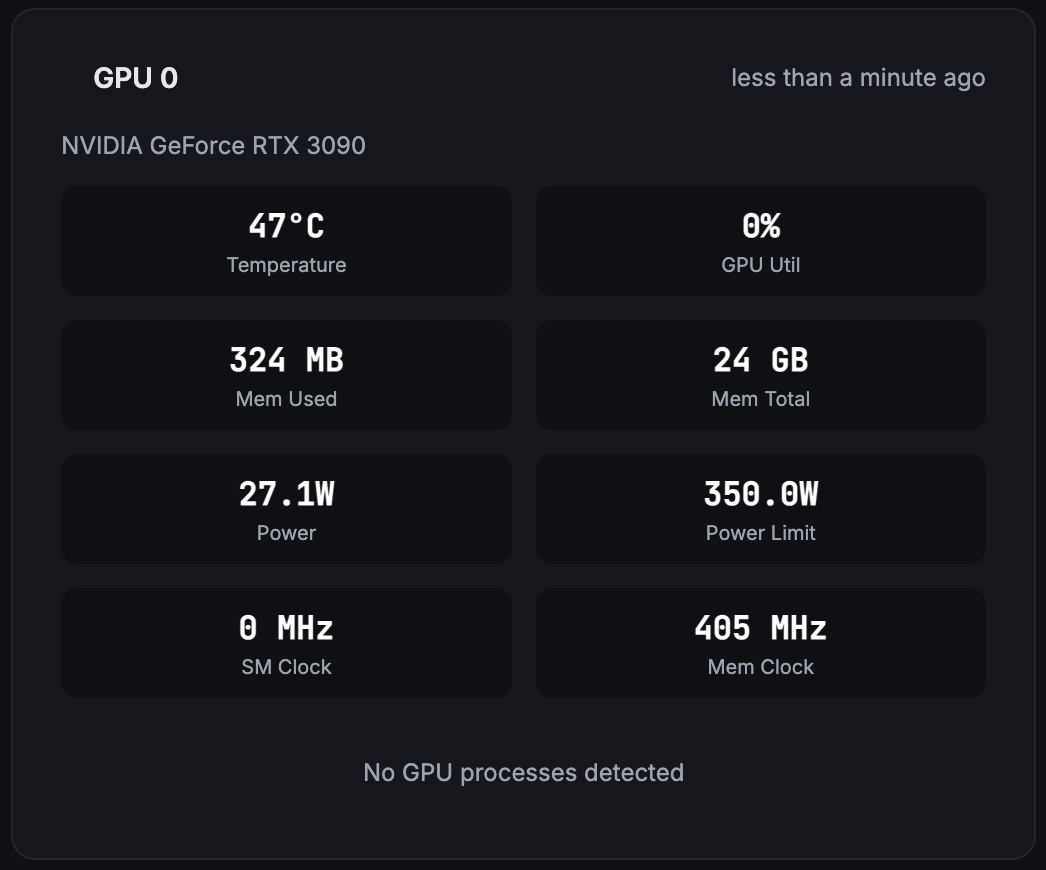
Utilization & Memory
GPU SM utilization percentage, VRAM used vs. total, and per-GPU tracking so you know exactly which card is busy and which is idle.
-
Temperature & Power
Real-time temperature in °C, power draw vs. power cap in watts, fan speed percentage, and GPU performance state (P-state).
-
Multi-GPU & Processes
Per-GPU metrics for multi-GPU servers, per-process VRAM usage, and graphics/SM clock speeds for every card in the system.
Deep dive
Auto-Detection, Zero Configuration
The Fivenines agent detects NVIDIA GPUs automatically when available. No config files to edit, no exporters to install, no Prometheus scrape targets to define. Install the agent and GPU metrics appear in your dashboard within 60 seconds.
Deep dive
Per-GPU Alerting
Set custom thresholds for each metric: alert when GPU temperature exceeds 85°C, when utilization drops below 10% (idle GPUs = wasted money), when VRAM usage crosses 90%, or when power draw spikes.
Alerts go where your team works: email, Slack, Telegram, Discord, Pushover, or webhooks.
Deep dive
Historical Data, Not Just Snapshots
Unlike nvidia-smi which shows a point-in-time snapshot, Fivenines stores full time-series data. See GPU utilization trends over hours, days, or weeks. Correlate temperature spikes with training job starts. Prove that your GPUs were idle at 3 AM.
GPU Monitoring Use Cases
AI/ML Training Servers
An idle GPU is wasted money. Track utilization across training runs, detect jobs that finished early or crashed silently, and prove GPU usage for cloud cost justification.
GPU Hosting Providers
Per-customer GPU visibility. Monitor temperature and power draw across your fleet, detect thermal throttling before customers complain, and track utilization for capacity planning.
Inference Servers
Prevent thermal throttling on always-on inference workloads. Monitor VRAM pressure to catch out-of-memory risks before they crash your model server.
Rendering & HPC Clusters
Track GPU utilization across rendering nodes. Identify bottlenecks, balance workloads, and monitor power consumption for cost management.
Homelab GPU Passthrough
Monitor GPUs passed through to Proxmox/KVM virtual machines. Get the same visibility inside VMs as you would on bare metal.
How It Compares
| Approach | Setup | History | Multi-GPU | Alerting | Cost |
|---|---|---|---|---|---|
| nvidia-smi | Built-in | Free | |||
| Prometheus + DCGM | 1-2 hours | Manual | Self-hosted | ||
| Netdata | 10 min | Limited | Basic | Free / Paid | |
| Datadog | 15 min | $15+/host | |||
| Fivenines | 2 min | 60s default | Built-in | 14-day trial |
Frequently Asked Questions
Which NVIDIA GPUs are supported? +
Does the agent need NVIDIA drivers installed? +
Can I monitor multiple GPUs in a single server? +
Does GPU monitoring work with GPU passthrough (Proxmox/KVM)? +
How much overhead does GPU monitoring add? +
Explore next
Related Features
Server Alerts
Set per-GPU thresholds for temperature, utilization, and memory with multi-channel notifications.
Explore ->Custom Dashboards
Build GPU monitoring dashboards combining utilization, temperature, and power metrics.
Explore ->Proxmox Monitoring
Monitor Proxmox hosts with GPU passthrough - combine hypervisor and GPU metrics.
Explore ->Docker Monitoring
Track GPU-accelerated containers alongside standard Docker container metrics.
Explore ->Start monitoring your GPUs in 2 minutes
14-day trial. No credit card required.
No credit card · 2-minute setup · Cancel anytime