Docker Container Monitoring Without the Observability Tax
Per-container CPU, memory, network, and disk metrics. No Prometheus, no cAdvisor, no Grafana dashboards to maintain. Install the agent, see every container in 2 minutes.
Built for teams monitoring production infrastructure
No credit card · 2-minute setup
-
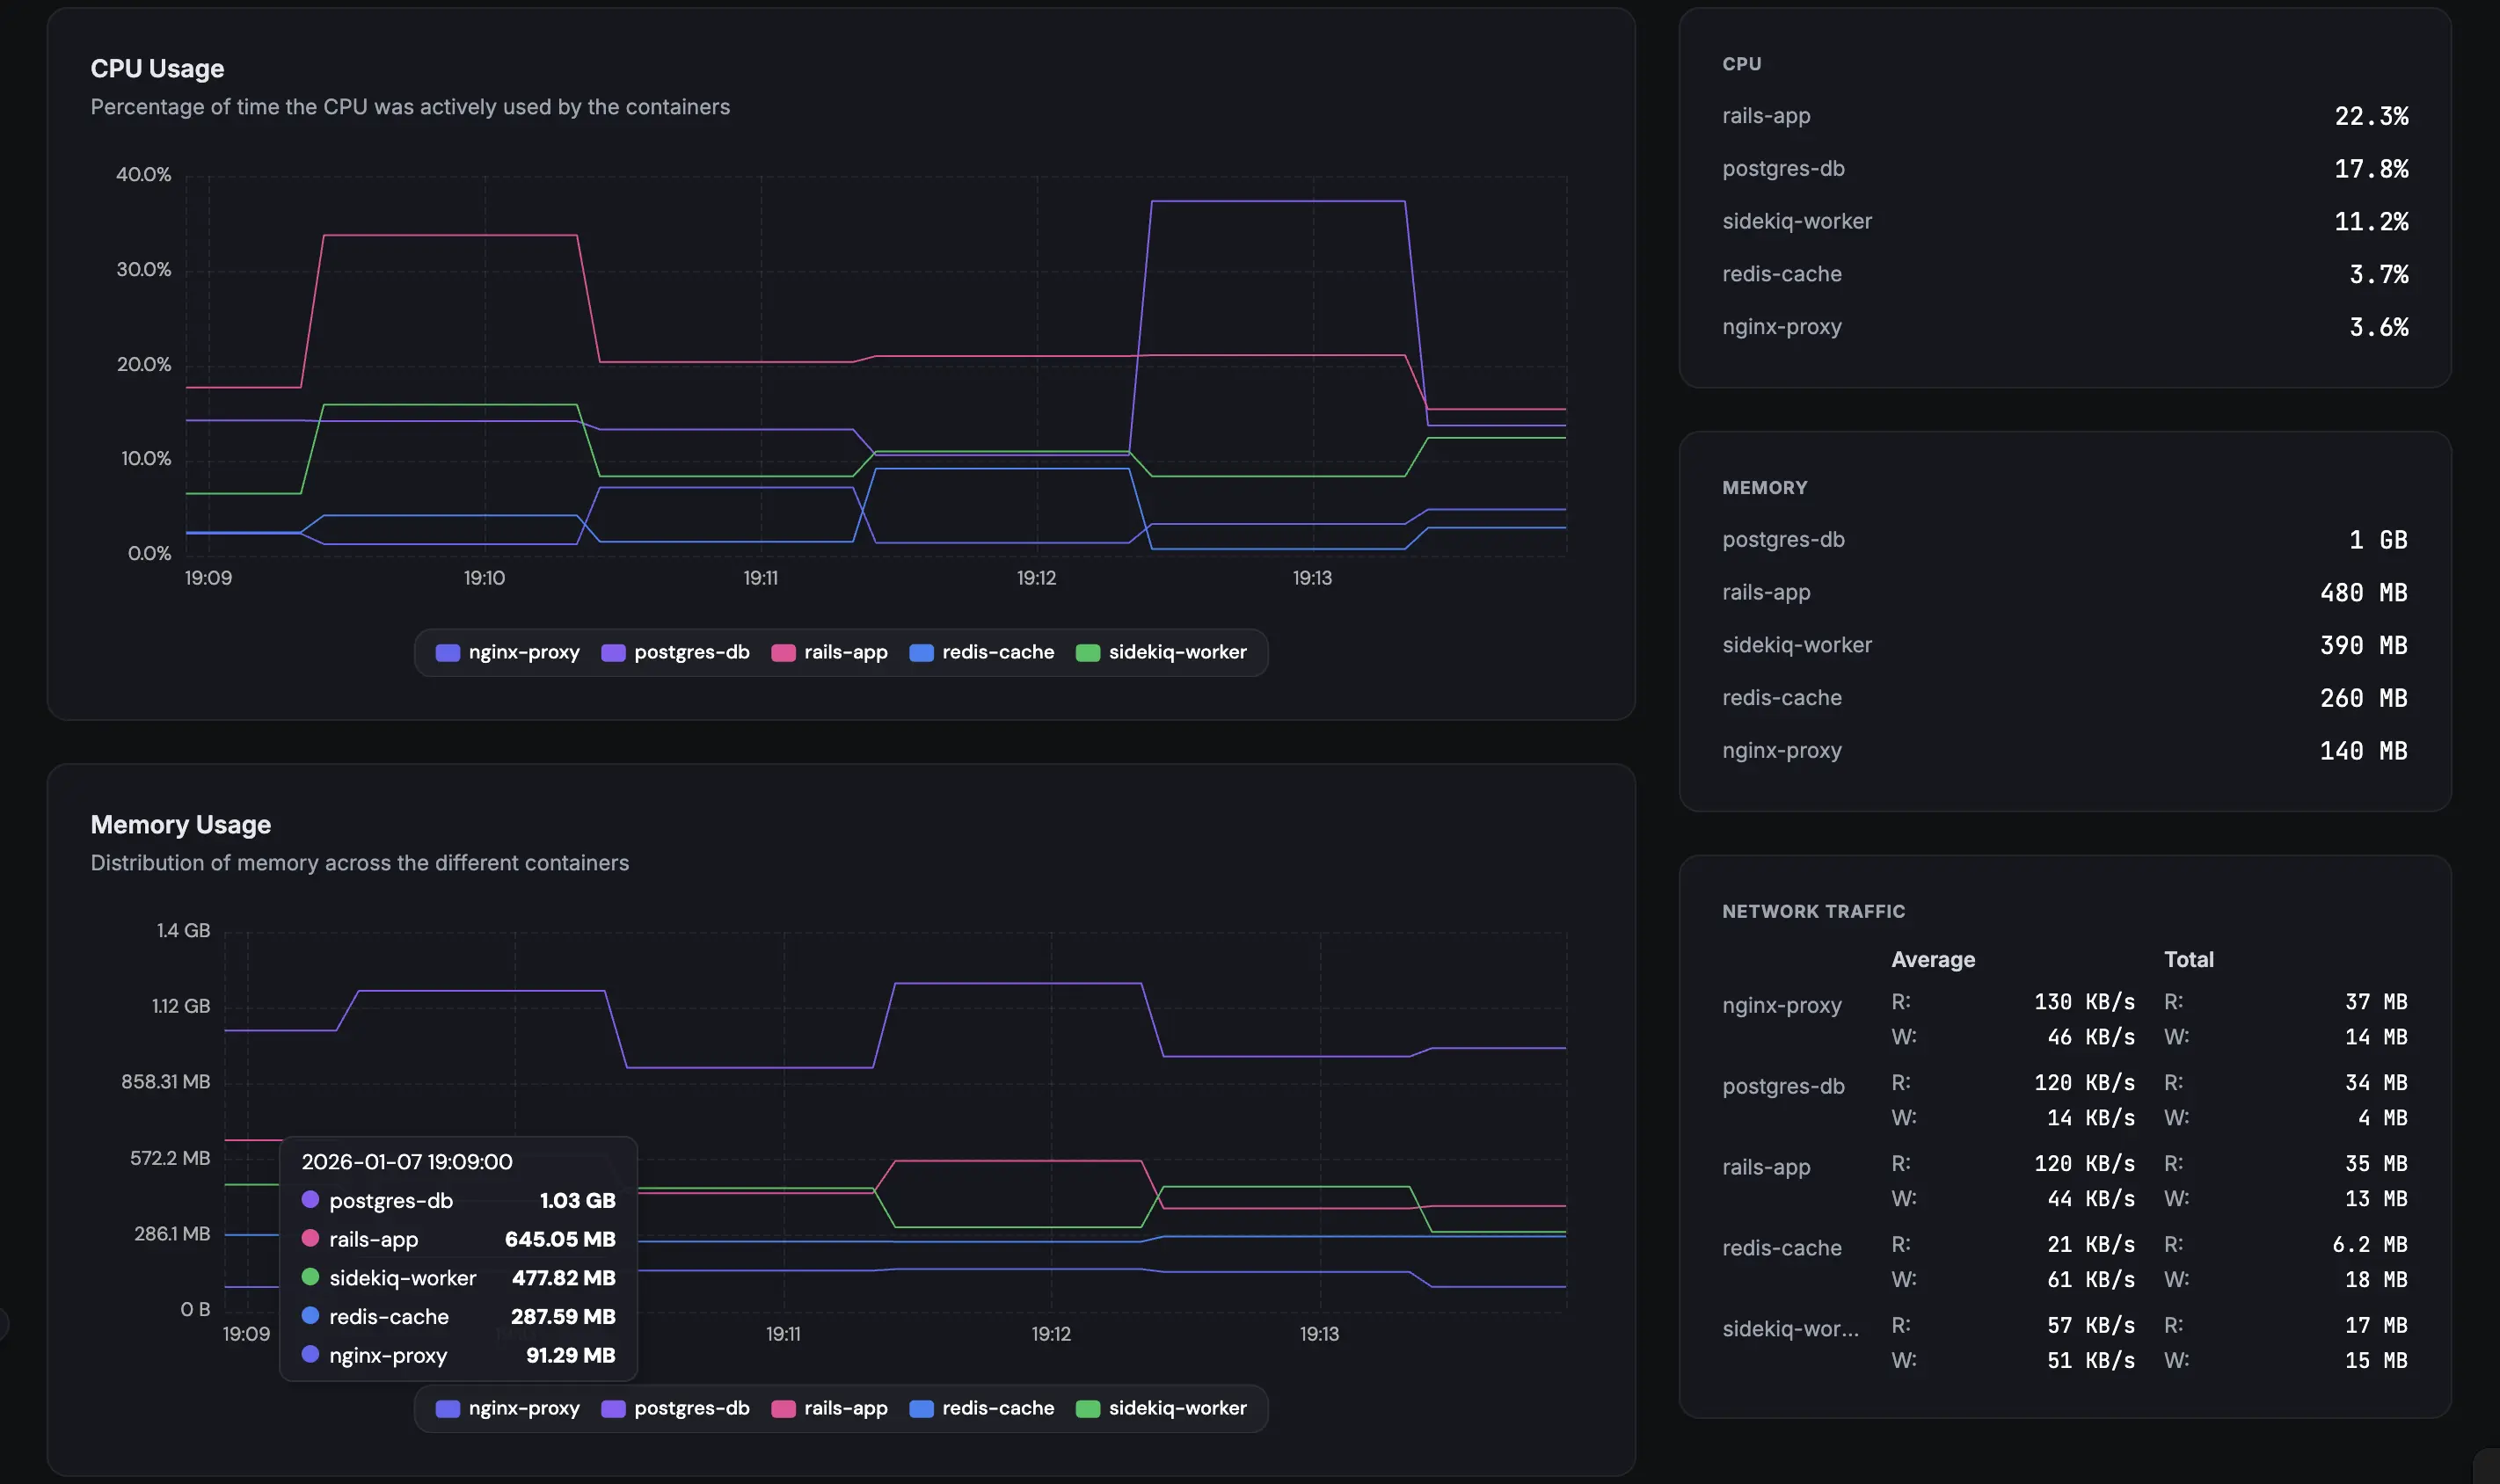
Per-Container Metrics
CPU, memory, network I/O, and disk read/write for every running container - individually, not just host-level aggregates.
-
60-Second Default Collection
Collect regular per-container samples without running Prometheus, cAdvisor, or Grafana. See sustained CPU, memory, network, and disk pressure from one dashboard.
-
Container Health Tracking
Know instantly when a container stops, restarts, or enters an unhealthy state. Correlate restarts with the memory spike that caused them.
Deep dive
Alerting That Actually Works
Set per-container thresholds for any metric. Get notified via email, Slack, Telegram, Discord, Pushover, or webhooks when a container exceeds CPU limits, runs low on memory, or stops responding.
No alert fatigue - you define the thresholds that matter to your infrastructure, not some ML model's opinion of what looks "anomalous."
Deep dive
Historical Data & Trends
Unlike docker stats, Fivenines stores your container metrics with up to 24 months of retention (depending on your plan). Spot memory leaks that develop over days, track resource growth as traffic scales, and plan capacity based on real data.
How It Compares
| Approach | Setup Time | Per-Container | Alerting | Retention |
|---|---|---|---|---|
docker stats |
0 min | Live only | ||
| cAdvisor + Prometheus + Grafana | 2-4 hours | Manual config | Self-managed | |
| Datadog | 30 min | Expensive at scale | ||
| Fivenines | 2 min | Built-in | Up to 24 months |
Setup Takes One Command
$ wget -qO- https://releases.fivenines.io/latest/fivenines_setup.sh | sudo sh -s ENROLLMENT_TOKEN
✓ Agent v2.x installed. Sending metrics to fivenines.io...
✓ [docker] Detected running containers. Metrics flowing in 60 seconds.
The agent auto-detects Docker and starts collecting container metrics immediately. No additional configuration needed. See your containers in the dashboard within 60 seconds of installation.
Beyond container metrics, the agent also scans your host's installed packages for known CVEs - see package vulnerability scanning.
Frequently Asked Questions
Does the agent run inside a container or on the host? +
What Docker metrics are tracked? +
Does it work with Docker Compose and Docker Swarm? +
Will it slow down my containers? +
Can I monitor containers across multiple servers? +
Explore next
Related Features
Server Alerts
Get notified via email, Slack, or Telegram when container metrics cross your thresholds.
Explore ->Custom Dashboards
Build dashboards combining container metrics with host-level data in a drag-and-drop builder.
Explore ->Cron Job Monitoring
Track scheduled tasks running inside or alongside your containers.
Explore ->Proxmox Monitoring
Monitor Proxmox VMs, LXC containers, and hypervisor health alongside Docker.
Explore ->See how Fivenines compares to other tools
Read our guide to the best infrastructure monitoring tools in 2026.
Start monitoring your Docker containers in 2 minutes
14-day trial. No credit card required.
No credit card · 2-minute setup · Cancel anytime
How to build a complete monitoring stack with Docker Compose