Website & API Uptime Monitoring
Monitor your websites and APIs from multiple regions around the world. Know within seconds when a service goes down - not when your customers tell you. Multi-region probes eliminate false positives, and alerts reach you via Email, Slack, Discord, Telegram, Pushover, or Webhooks.
Built for teams monitoring production infrastructure
No credit card · 2-minute setup
How It Works
Step 1
Configure URL
Add the URL, choose check interval and alert preferences.
Step 2
Probes Check
Multiple probes from different regions check your service independently.
Step 3
Alert If Down
When probes confirm an outage, you're notified on your chosen channels.
Step 4
Create Incident
An incident is created automatically with a full timeline.
-
Multi-Region Verification
Probes from multiple geographic regions confirm outages before alerting. No more 3 AM wake-ups because a single network hop had a hiccup.
-
Response Time Tracking
Track response times over hours, days, and weeks. Spot performance degradation before it becomes an outage. Historical data with full retention on your plan.
-
SSL Certificate Monitoring
Automatic SSL expiration tracking with configurable warning thresholds. Get alerted days or weeks before your certificate expires.
Deep dive
Alerts on Every Channel Your Team Uses
When an outage is confirmed, Fivenines sends notifications to the channels you have configured: Email, Slack, Discord, Telegram, Pushover, and Webhooks. Route different monitors to different channels - production endpoints to PagerDuty via webhook, staging to a Slack channel.
Each alert includes the URL that failed, which regions detected the outage, response time data, and the HTTP status code returned. When the service recovers, you get a resolution notification with the total downtime duration.
Deep dive
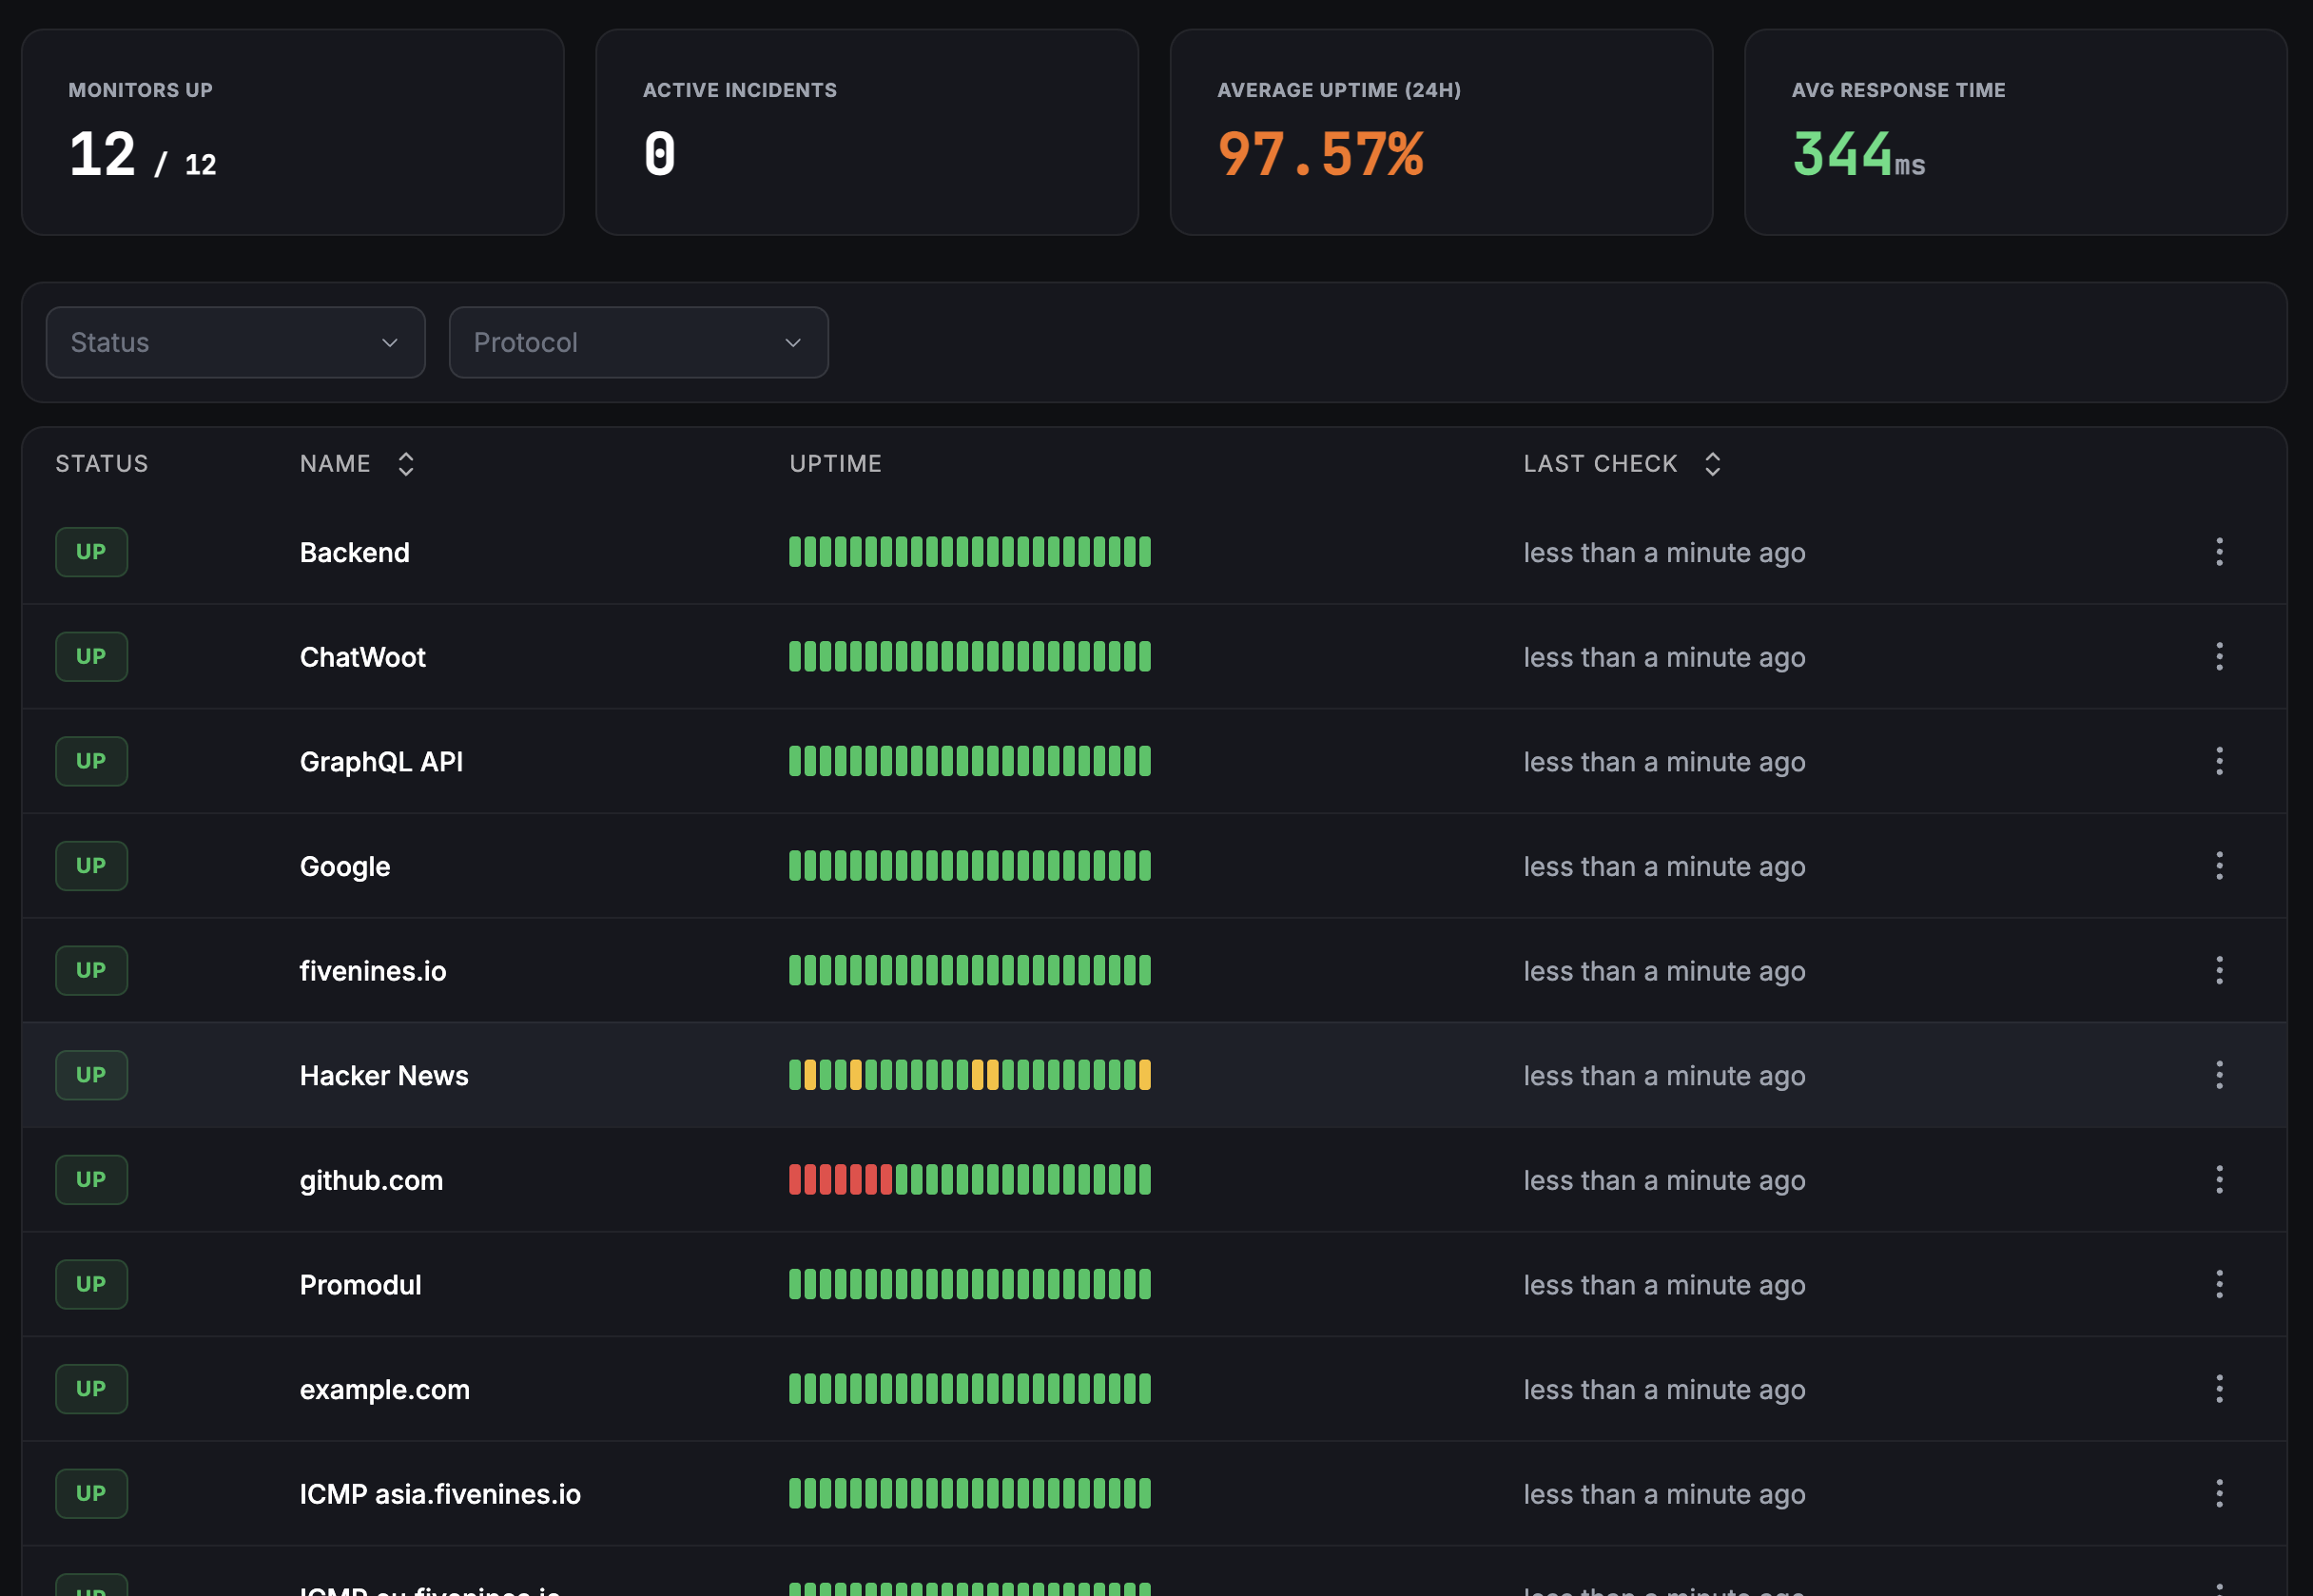
Response Time Graphs & Uptime History
Every check records the full response time, not just up/down status. View response time graphs over any time range to spot trends - a gradually increasing response time often predicts an upcoming outage.
Uptime percentages are calculated automatically. See your 7-day, 30-day, and 90-day uptime at a glance. Share these numbers with stakeholders or display them on your public status page.
How It Compares
| Approach | Multi-Region | SSL Monitoring | Status Pages | Server Metrics | Cost |
|---|---|---|---|---|---|
| Manual Checking | Free | ||||
| UptimeRobot | Limited | $7+/mo | |||
| Uptime Kuma | Self-hosted | ||||
| Fivenines | Built-in | From €9/mo |
Included on Starter, Pro, and Enterprise plans
Starting at €9/month
Frequently Asked Questions
How does multi-region uptime monitoring work? +
What check intervals are available? +
Does Fivenines monitor SSL certificates? +
How are false positives handled? +
Can I display uptime data on a public status page? +
Explore next
Related Features
Status Pages
Share real-time uptime data with your users on a branded public status page.
Explore ->Server Alerts
Combine uptime monitoring with server-level metric alerts for complete coverage.
Explore ->Custom Dashboards
Build dashboards combining uptime data, response times, and server metrics.
Explore ->See how Fivenines compares to other tools
Read our guide to the best infrastructure monitoring tools in 2026.
Start monitoring your websites and APIs in 2 minutes
14-day trial. No credit card required.
No credit card · 2-minute setup · Cancel anytime