Server monitoring for hosting providers
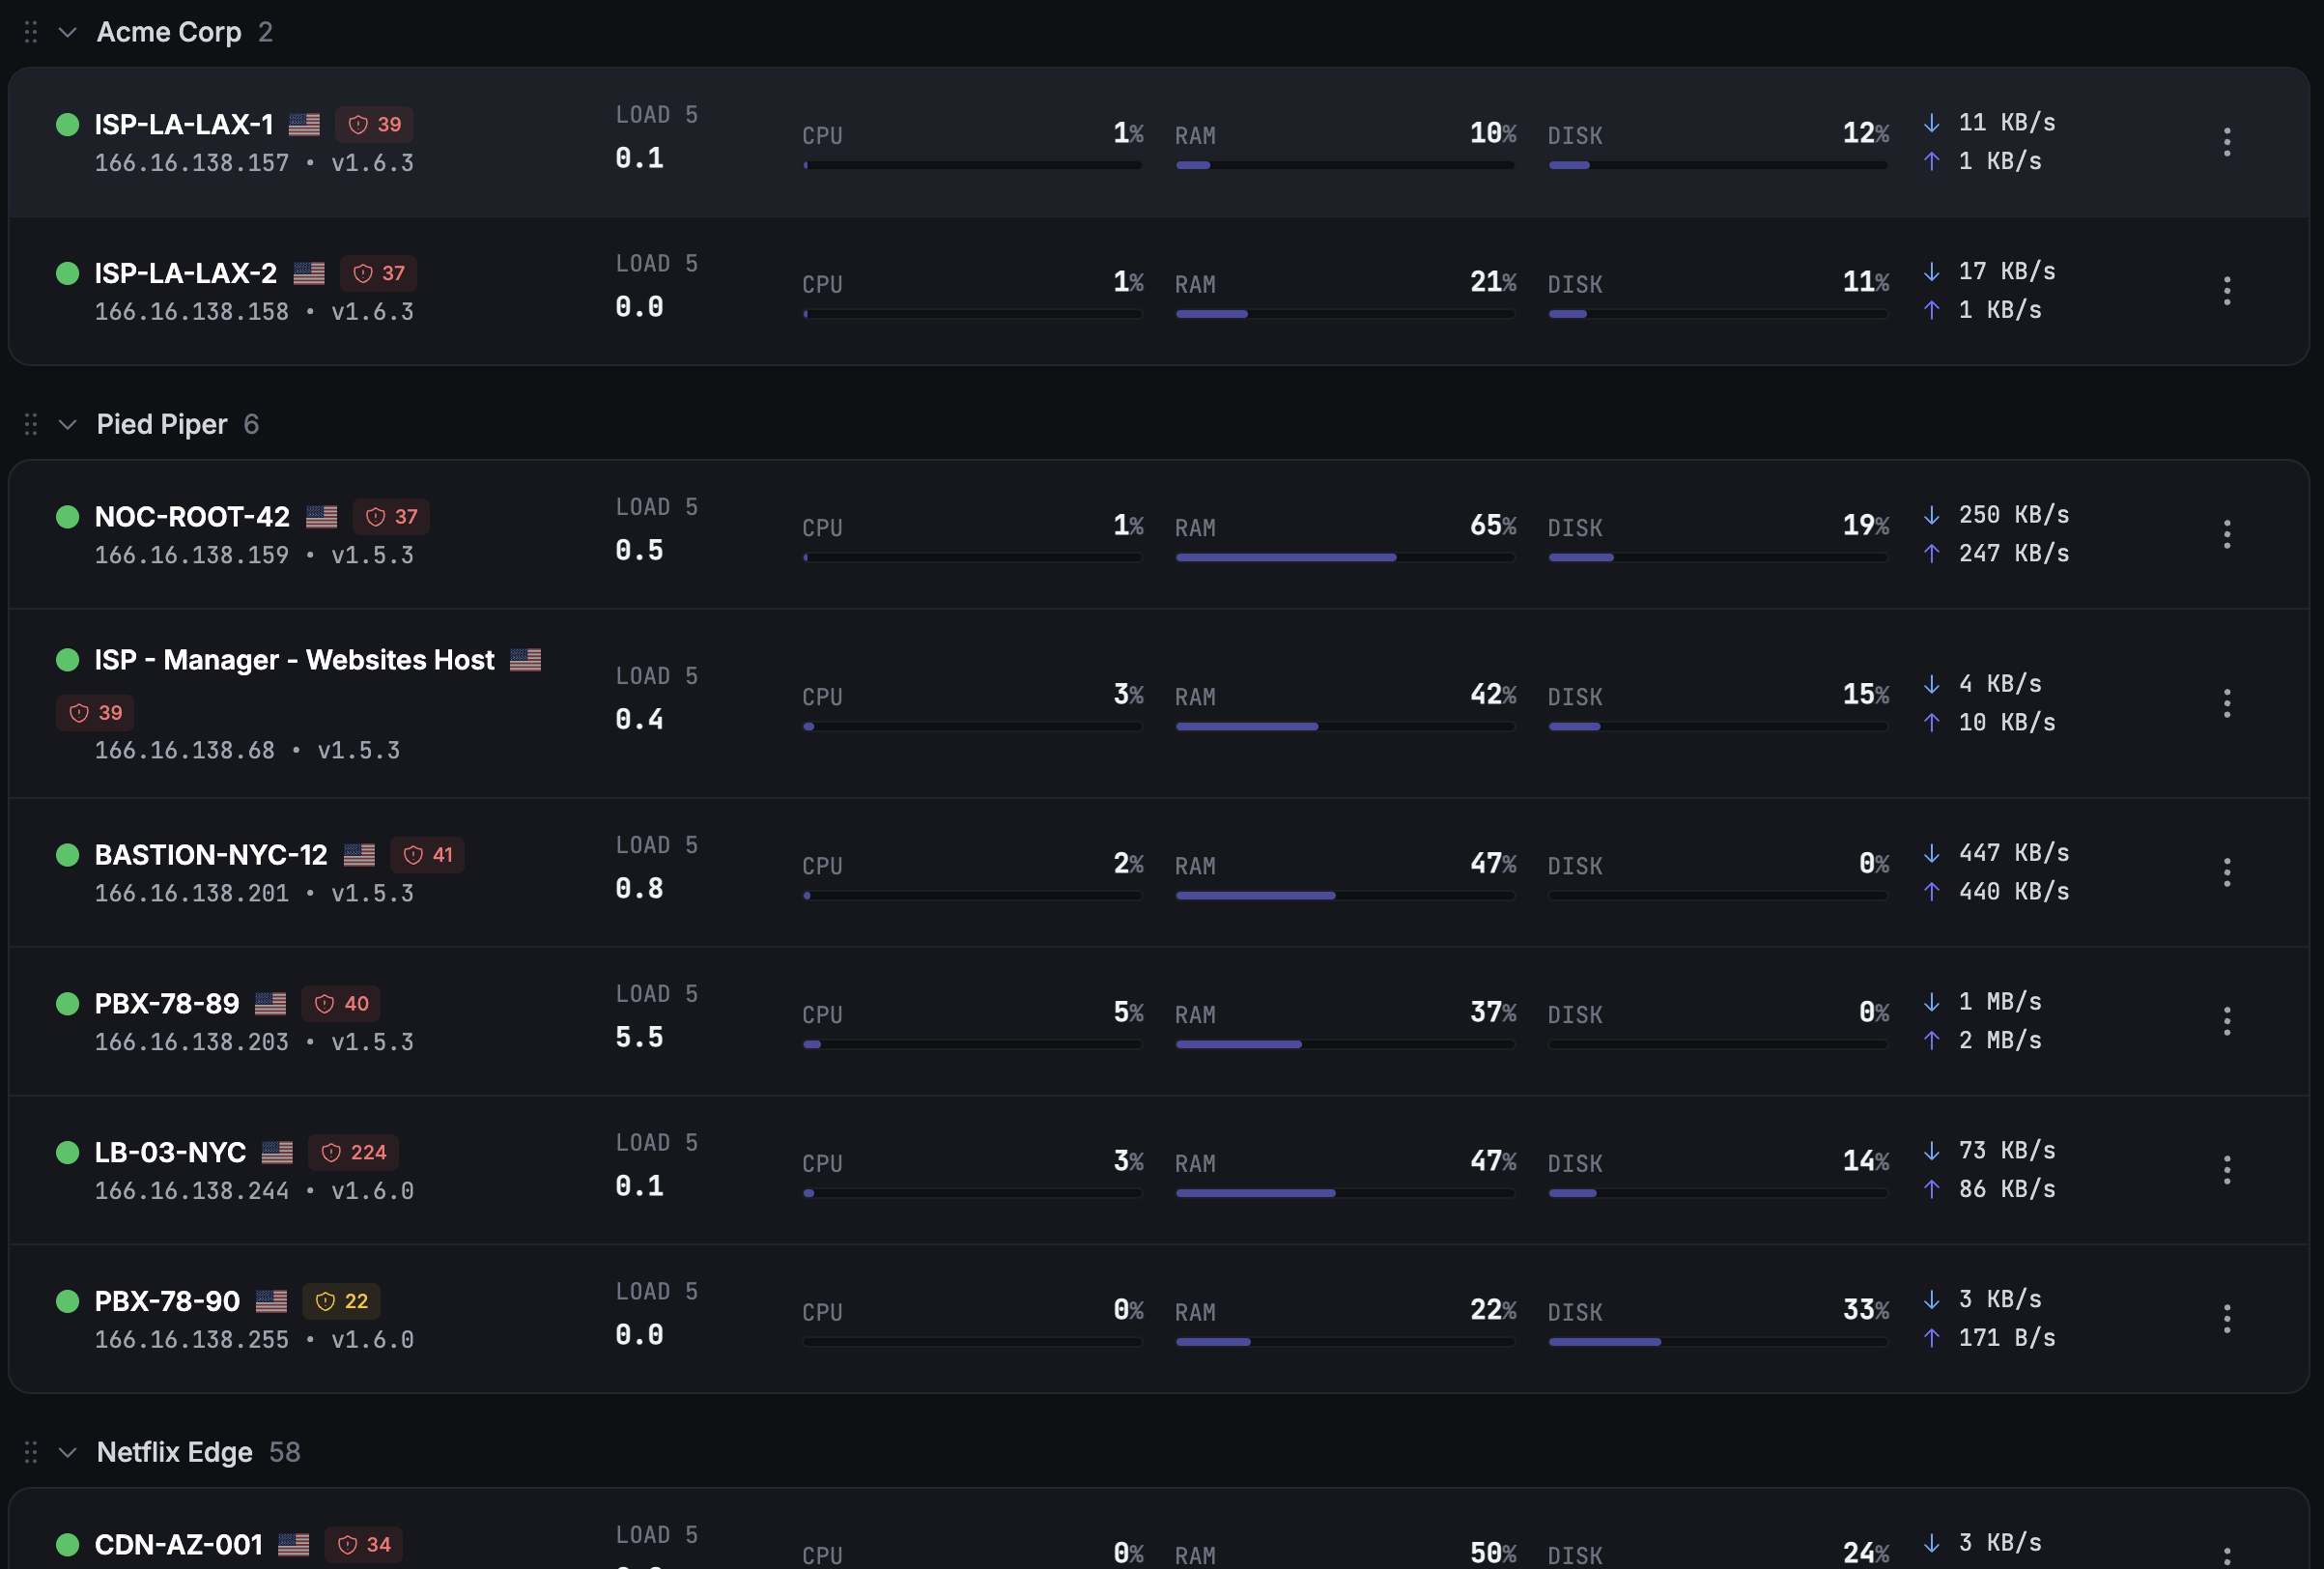
Bulk-provision the open-source agent across customer servers. Add branded status pages, SNMP network monitoring, uptime checks and API-first automation without stitching together three tools.
Built for VPS, bare-metal, shared hosting and managed hosting fleets
No credit card · Live in 2 minutes · Volume plans available for larger fleets

“Fivenines helped us catch customer VPS that had been compromised and were running mining workloads: the disk I/O and CPU signals were there immediately. And because the agent only sends data outbound, we could deploy it across our infrastructure without touching firewall, NAT, or port-forwarding rules.”

Fatih Gülsuyu CTO at Hosting.com.tr / Fastpanda
Before
PRTG + Zabbix + Checkmk
Three tools · SNMP, firewall, NAT overhead · Expensive at scale
After
Fivenines
One platform · Outbound-only agent · Compromised VPS caught
- < 5 min
- to deploy in production
- 3 → 1
- tools consolidated
- 1 VPS
- caught running crypto-miners
Built for hosting providers who...
If these constraints describe your fleet, Fivenines is built for the way your team operates.
-
Manage hundreds or thousands of customer servers
Bare metal, VPS, containers and shared hosting nodes. Track CPU, memory, disk, network and availability from one dashboard.
-
Need bulk agent provisioning at scale
Roll out the open-source agent with Ansible, Terraform, cloud-init, a shell script or your control panel's post-install hook.
-
Want public status pages your customers can rely on
White-label status pages on your domain with uptime, incident history, maintenance windows and embeddable badges.
-
Run customer-facing infrastructure on Linux or Windows
Use the agent on mainstream Linux distributions and Windows Server behind cPanel, Plesk, HestiaCP, Virtualizor, SolusVM, Proxmox or your own panel.
-
Serve LAMP and LEMP stacks all day
Apache, Nginx, MySQL/MariaDB and PHP-FPM are monitored as themselves, not inferred from CPU. PHP-FPM is watched per pool, so an exhausted worker pool or a growing listen queue is an alert with the pool name on it, which is the usual reason a customer site is "down" while the server looks perfectly healthy.
-
Put proxies and load balancers in front of it
HAProxy backends and the servers behind them each report their own state, so you pick what pages you: the whole pool going down, or any single member dropping out while the rest still serve. Either way, servers you have put into MAINT or DRAIN are read as planned work rather than an outage.
-
Need predictable costs as the fleet grows
Start with published self-serve plans, then move to a volume plan when your fleet needs custom limits, retention or support.
-
Want API access for provisioning and reporting
Use the public REST API and Terraform provider to manage monitoring in your organization. The partner program adds customer provisioning and usage data for your billing integration.
Trusted by hosting providers worldwide








Everything you need to monitor a hosting fleet
Bulk provisioning, branded status, network depth, package vulnerability scanning and API-first automation in one operational platform.
Bulk agent provisioning
Install the open-source agent on new customer servers through your provisioning workflow. No manual SSH session per host.
$ ansible hosting_fleet -m shell -a "install-fivenines-agent"
✓ 47 agents registered
✓ metrics flowing at 60-second intervals
Uptime monitoring
HTTPS, TCP, ICMP and DNS checks from multiple regions, with SSL certificate tracking and quorum confirmation.
White-label status pages
Branded status pages on your domain for customer-facing incidents, planned maintenance and SLA communication.
status.your-host.com
All systems operational
Alert automation
Route alerts by service, severity and escalation path using visual workflows, webhooks and team channels.
REST API + Terraform
Provision, list, update and delete monitors from code. Keep monitoring aligned with the servers your panel creates.
$ terraform apply
+ fivenines_host.vps_nodes[47]
Apply complete. Resources: 47 added.
Server and network dashboards
Bring server metrics, uptime checks, cron heartbeats and SNMP network devices into a single operational view.
CPU
34%
Memory
62%
Disk I/O
128 MB/s
Alerts
0 open
Package vulnerability scanning
Separate the CVEs you can fix today from the ones your distro has not patched yet. The headline counts packages with an available fix; the rest is listed with the vendor's own verdict, and container images are scanned alongside the host.
openssl
Critical CVE
Patch available
curl
High CVE
Update recommended
linux-image
No known CVEs
Current
Database and cache monitoring
MySQL and MariaDB, PostgreSQL, Redis or Valkey and Memcached, read over their own interfaces with no exporter per server. Connections, buffer pool, replication lag and cache hit rate per customer box.
MariaDB
142 / 200 conn
Collecting
Redis
hit rate 99.1%
Collecting
PostgreSQL
auth failed
Config error
Fivenines vs HetrixTools, Pingdom and Netdata Cloud
Hosting providers usually evaluate uptime tools, server agents and network monitoring at the same time. Fivenines brings server, SNMP, uptime and cron monitoring together for a hosting fleet.
| Capability | Fivenines | HetrixTools | Pingdom | Netdata Cloud |
|---|---|---|---|---|
| Primary focus | Server, network, uptime and cron monitoring | Uptime, blacklist and server monitoring | Website uptime and performance monitoring | Infrastructure observability |
| Server monitoring agent | Open-source agent | Agent for Linux, Windows and macOS | Separate product (SolarWinds Observability SaaS) | Open-source agent |
| Terraform provider | Vendor-published | Community-maintained | Community-maintained | Vendor-published, for Netdata Cloud resources |
Vendor-published providers come from the vendor itself; community-maintained ones from third parties. Compare the resources each provider supports for your provisioning workflow. Sources checked September 25, 2026: HetrixTools · Pingdom · AppOptics retirement (SolarWinds) · Netdata · HetrixTools Terraform provider · Pingdom Terraform provider · Netdata Terraform provider
How hosting providers roll out monitoring across a fleet
The workflow is built for automation first: install once, repeat through your provisioning system, then report through the API.
Day 0
Hook the agent into provisioning
Add the installer to your post-install script, Ansible playbook, cloud-init template or Terraform workflow.
wget -qO- https://releases.fivenines.io/latest/fivenines_setup.sh | sudo sh -s ENROLLMENT_TOKEN
✓ Agent installed on new-vps-042
Day 0
Backfill the existing fleet
Run the same install path across existing servers. Metrics start flowing at 60-second intervals by default once each host registers.
Week 1
Publish customer-facing status
Create branded status pages for public services, customer portals or premium hosting plans.
status.customer-domain.com
All systems operational
Month 1
Automate reporting and usage
Use the public API for uptime and incident data in your organization. Partners can also read customer host counts and fleet monitor usage through the partner API; billing and report formatting stay in your tooling.
Connect your reporting tools
Organization: uptime and incident data
Partner fleet: monitor-usage history
Your tools: reports and invoicing
Monitor your fleet or offer monitoring under your brand
Use the self-serve plans below to monitor the infrastructure your team operates. Organize resources and alerts around your clients, and publish branded status pages from Pro.
Separate customer accounts and a branded portal
The partner program provides customer organizations, a portal under your brand, and provisioning through WHMCS or the partner API. Partner onboarding and wholesale pricing per monitor are separate from the self-serve plans.
Explore the partner program →Pricing that scales from self-serve to volume
Start on published plans, then talk to us when your hosting fleet needs higher limits, custom retention, onboarding help or dedicated support.
Pro
For smaller hosting teams starting with core monitoring
- ✓50 monitors
- ✓10 team members
- ✓White-label status pages
- ✓24 months data retention
- ✓Slack, Microsoft Teams, Telegram, Discord, Pushover and email alerts
Business
For growing hosting providers and VPS operators
- ✓100 monitors
- ✓25 team members
- ✓24 months data retention
- ✓Everything in Pro
- ✓PagerDuty and webhook alerts
- ✓SAML SSO
Volume
For larger fleets, custom limits and onboarding help
- ✓300+ monitors
- ✓50+ team members
- ✓Custom check intervals down to 5 seconds
- ✓Dedicated support contact
- ✓Custom SLA and onboarding
All paid plans include a 14-day free trial. No credit card required. See full pricing details →
What engineers, MSPs and operators say
Real Trustpilot reviews from people using Fivenines for infrastructure monitoring.
Fivenines has been completely reliable...
Fivenines has been completely reliable and the service continues adding features at a fast clip. My subscription just keeps gaining value, which is a great thing!
Mike Horgan
United States · May 1, 2026
Been with the service from ground...
Been with the service from ground floor; the dev is really nice and insanely effective - more than once I've been reporting bugs and assisting with testing while things were being fixed LIVE! It's obvious that he has aspirations and he's been delivering over expectations constantly. The actual product works perfectly along the other monitoring solutions I'm using (currently Hetrixtools and Komari) and for those who are more wary of unknown code running on their prods the code is available via Git. Nothing but recommendations from me!
ZalnT
Sweden · Apr 14, 2026
We have been very happy with Fivenines
The interface is clear and setup was straightforward. Support has been responsive, and alerts arrive promptly when issues arise, enabling quick incident response. Reliability at fair pricing.
Philipp
Germany · Jan 2026
Finally Found a Versatile Server Monitoring at a Sensible Price
After years searching for adequate monitoring tools, Fivenines stands out with its balanced feature set, clean design, reasonable pricing, and genuinely helpful customer support.
T George
Netherlands · Aug 2025
One of the best server monitoring tools I've used
The tool is continuously improving with dedicated developer support. They're responsive to user feedback and I've successfully deployed it as a replacement for our hosting provider's monitoring.
Ahmed
Egypt · Aug 2025
Finally an affordable and pleasant server monitoring tool!
After several competitors closed or declined, Fivenines emerged as the perfect alternative. Easy installation, fast performance with historical charts. Exactly what I was looking for.
Adrien
France · Sep 2025
I have been using Fivenines practically since the beginning
The platform has evolved rapidly with attractive pricing and responsive creator support. It's become a solid alternative to larger competitors for our infrastructure monitoring needs.
Lee
Poland · Jan 2026
Great tool with responsive development
Fivenines has become an essential part of our infrastructure monitoring. The clean interface and reliable alerts make it easy to stay on top of server health.
Dmitriy
Russia · Aug 2025
Frequently asked questions from hosting providers
Provisioning & integration
Does Fivenines integrate with cPanel, Plesk, HestiaCP, Virtualizor or SolusVM? +
Can I bulk-install the agent across an existing fleet? +
How does the agent behave on shared hosting servers? +
Pricing & billing
How does pricing work for 1,000+ customer servers? +
Can I bill monitoring back to my customers via the API? +
What happens if I add a large batch of servers in one day? +
Operations & trust
Can I publish a branded status page on my own domain? +
Is the Fivenines agent really open-source? +
Where is Fivenines hosted? +
Do you support two-factor authentication and SSO? +
What about SOC 2, ISO 27001 or PCI DSS? +
What happens at the end of the 14-day trial? +
Ready to monitor your hosting fleet?
Try Fivenines free for 14 days, no credit card. Or book a 15-minute call to discuss bulk rollout, API provisioning and volume pricing for your fleet.
No credit card · 2-minute setup · Volume plans available
Made in Montpellier · Hosted in the EU · Open-source agent on GitHub