Linux Server Monitoring Without the Prometheus Stack
CPU, memory, disk, network and process metrics on every Linux server, with an open-source agent that installs in one command. No scrape configs, no Grafana dashboards to maintain.
Built for teams monitoring production infrastructure
No credit card · 2-minute setup
-
One-command install
A single curl command sets up the agent, registers the host and starts pushing metrics. The same command works across every supported distro.
-
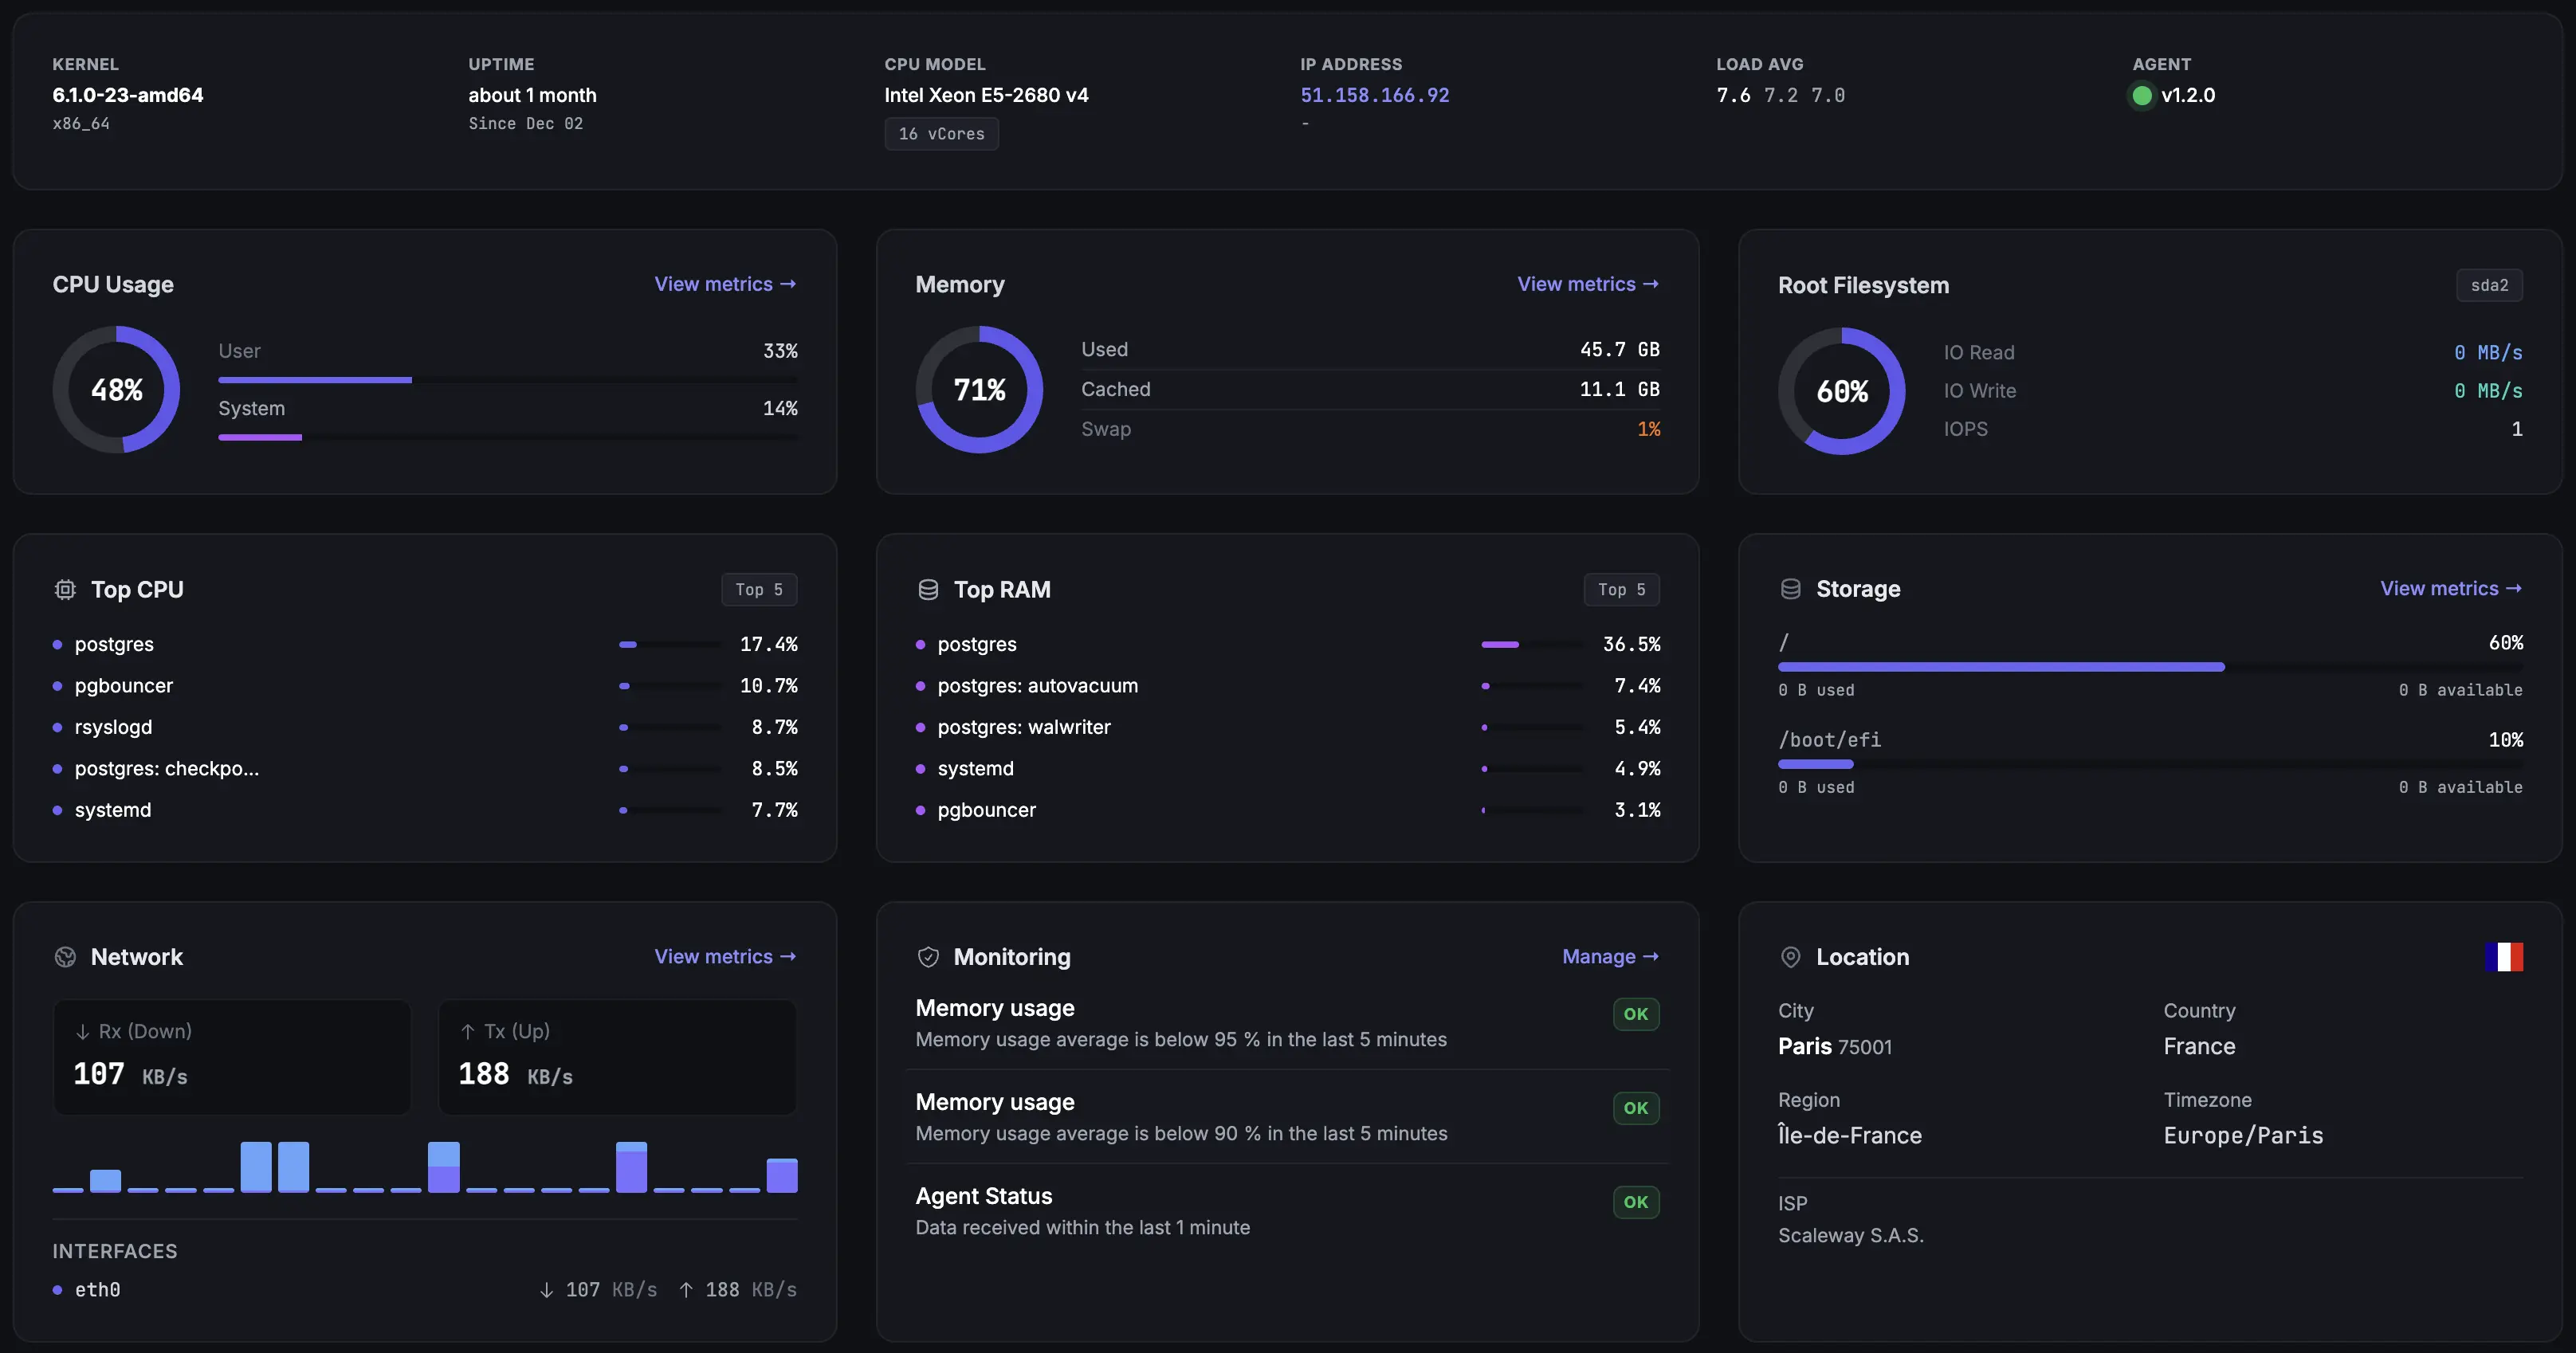
Per-host and per-process metrics
CPU, memory, swap, load, disk I/O, partitions, network counters and the top processes by resource use. See what's running, not just that something is wrong.
-
Open-source agent
The Linux agent source is public on GitHub. Audit it, fork it, or pin a specific version in your config management before rolling it out.
Deep dive
Alerting that actually works
Set per-host thresholds on any metric: CPU sustained over 90%, free memory under 10%, disk filling within 24 hours, network drops, swap usage, process count. Alerts ship via email, Slack, Microsoft Teams, Telegram, Discord, Pushover, SMS or webhooks, depending on plan.
Workflows let you add rechecks, mute windows, escalation paths and routing rules. Critical alerts go to PagerDuty or SMS; informational ones go to a #ops-noise channel. You decide the thresholds, not an ML model that thinks anything outside ±2σ is an anomaly.
Deep dive
Historical data and capacity planning
Unlike top, htop or a fresh Prometheus install, Fivenines stores Linux metrics with up to 24 months of retention depending on plan. Spot the memory leak that grew over six weeks, correlate a recent latency regression with a kernel upgrade, and plan capacity from real data instead of vibes.
The agent also reports installed package names and versions, which feed package vulnerability scanning for CVE detection on the same hosts you're already monitoring.
Common Linux Server Monitoring Scenarios
Solo operator with 5 to 50 servers
One dashboard for every VPS, bare-metal box and Raspberry Pi. Alerts in Telegram or Discord, no PagerDuty contract required, no enterprise sales call before pricing.
MSP managing client fleets
Group Linux servers by client, publish white-label status pages, and export usage data when monitoring becomes a billable line. Each client sees only their own infrastructure.
SRE team running production
Replace Prometheus + node_exporter + Alertmanager for the core fleet monitoring use case. Define monitors in Terraform alongside the infrastructure they watch.
How It Compares
| Approach | Setup Time | Linux Metrics | Alerting | Retention |
|---|---|---|---|---|
htop / top / vmstat |
0 min | Live only | ||
| Prometheus + node_exporter + Grafana | 2-4 hours | Manual config | Self-managed | |
| Zabbix | 1-2 hours | Template-based | Self-managed | |
| Datadog | 30+ min | Agent-based | Expensive at scale | |
| Fivenines | 2 min | Open-source agent | Built-in | Up to 24 months |
Setup takes one command
$ curl -s https://releases.fivenines.io/latest/fivenines_setup.sh | sudo bash
✓ Agent installed. Sending metrics to fivenines.io...
✓ Detected modules: docker, smart, postgres. Metrics flowing in 60 seconds.
The setup wizard generates the command with your organization key already embedded. Metrics start appearing in the dashboard within 60 seconds. Detected Docker daemons, Proxmox nodes, NVIDIA GPUs, PostgreSQL instances and SMART-reporting disks are picked up automatically - no extra config files to write.
User-level install is available if you don't want to run the agent as root. See the agent security model for the full permissions breakdown.
Frequently Asked Questions
What Linux distributions does the Fivenines agent support? +
Is the Linux agent really open source? +
How much overhead does the agent add to my Linux server? +
Does the agent need root or a public inbound port? +
What Linux metrics does Fivenines collect by default? +
Explore next
Related Features
Windows Server Monitoring
Same agent-based approach across Windows Server 2016, 2019, 2022 and 2025.
Explore ->Docker Monitoring
Per-container CPU, memory, network and disk stats on your Linux hosts.
Explore ->Proxmox Monitoring
VM resource usage, storage pools and host health on Proxmox nodes.
Explore ->Server Alerts
Route Linux alerts to Slack, Telegram, Discord, Teams, SMS or webhooks.
Explore ->See how Fivenines compares to other tools
Read our guide to the best infrastructure monitoring tools in 2026.
Start monitoring your Linux servers in 2 minutes
14-day trial. No credit card required.
No credit card · 2-minute setup · Cancel anytime