Production monitoring for SaaS teams who'd rather ship features than maintain Prometheus.
Server metrics, uptime checks, cron jobs and customer-facing status pages in one platform. No PromQL. No Grafana dashboards to build. No Alertmanager rules to maintain.
Used by teams running Rails, Django, Node.js and Go in production
No credit card · Live in 2 minutes · From €27/month
The true cost
Prometheus + Grafana is "free". Until you count the hours.
Self-hosting is a valid choice. It just means your team owns storage, dashboards, alert rules, upgrades and the monitoring stack's own incidents.
Self-host Prometheus stack
- ·Setup and initial config: 1 to 3 days
- ·Retention and storage strategy: recurring decision
- ·Grafana dashboard maintenance: 2-5h/month
- ·Alertmanager rule tuning: 1-3h/month
- ·On-call ownership for monitoring itself
- ·Engineer hours not spent shipping features
Real cost: 5-15h/month of senior engineer time
Fivenines
- ✓Setup: one shell command
- ✓Storage retention included
- ✓Dashboards work out of the box
- ✓Useful alert defaults without PromQL
- ✓No on-call for the monitoring stack
- ✓Engineer hours back in your sprint
From €27/month · monitoring without the maintenance backlog
Planning estimate only; your stack and team's Prometheus expertise will change the actual maintenance cost.
Built for engineering teams that...
The page is for teams responsible for production uptime without a dedicated observability platform team.
-
Running production servers
App servers, databases, queue workers and cron runners across AWS, GCP, Hetzner, OVH or bare metal. The agent runs on Linux and Windows.
-
Do not want to babysit Prometheus and Grafana
Get production coverage without maintaining storage, dashboards, alert rules and retention policies yourself.
-
Have a customer-facing SLA to honor
Track uptime, SSL certificates and incidents for the services your customers actually depend on.
-
Run dev, staging and production differently
Keep production alerts urgent while staging goes to a channel and dev stays quiet.
-
Need a status page for customer trust
Publish a branded status page on your domain with incident updates and scheduled maintenance.
-
Build everything as code
Use the public REST API and Terraform provider to keep monitoring aligned with your CI/CD and infrastructure changes.
Trusted by engineering teams running production


Everything you need to monitor production
Server metrics, uptime checks, cron heartbeats, status pages, workflows and infrastructure-as-code support.
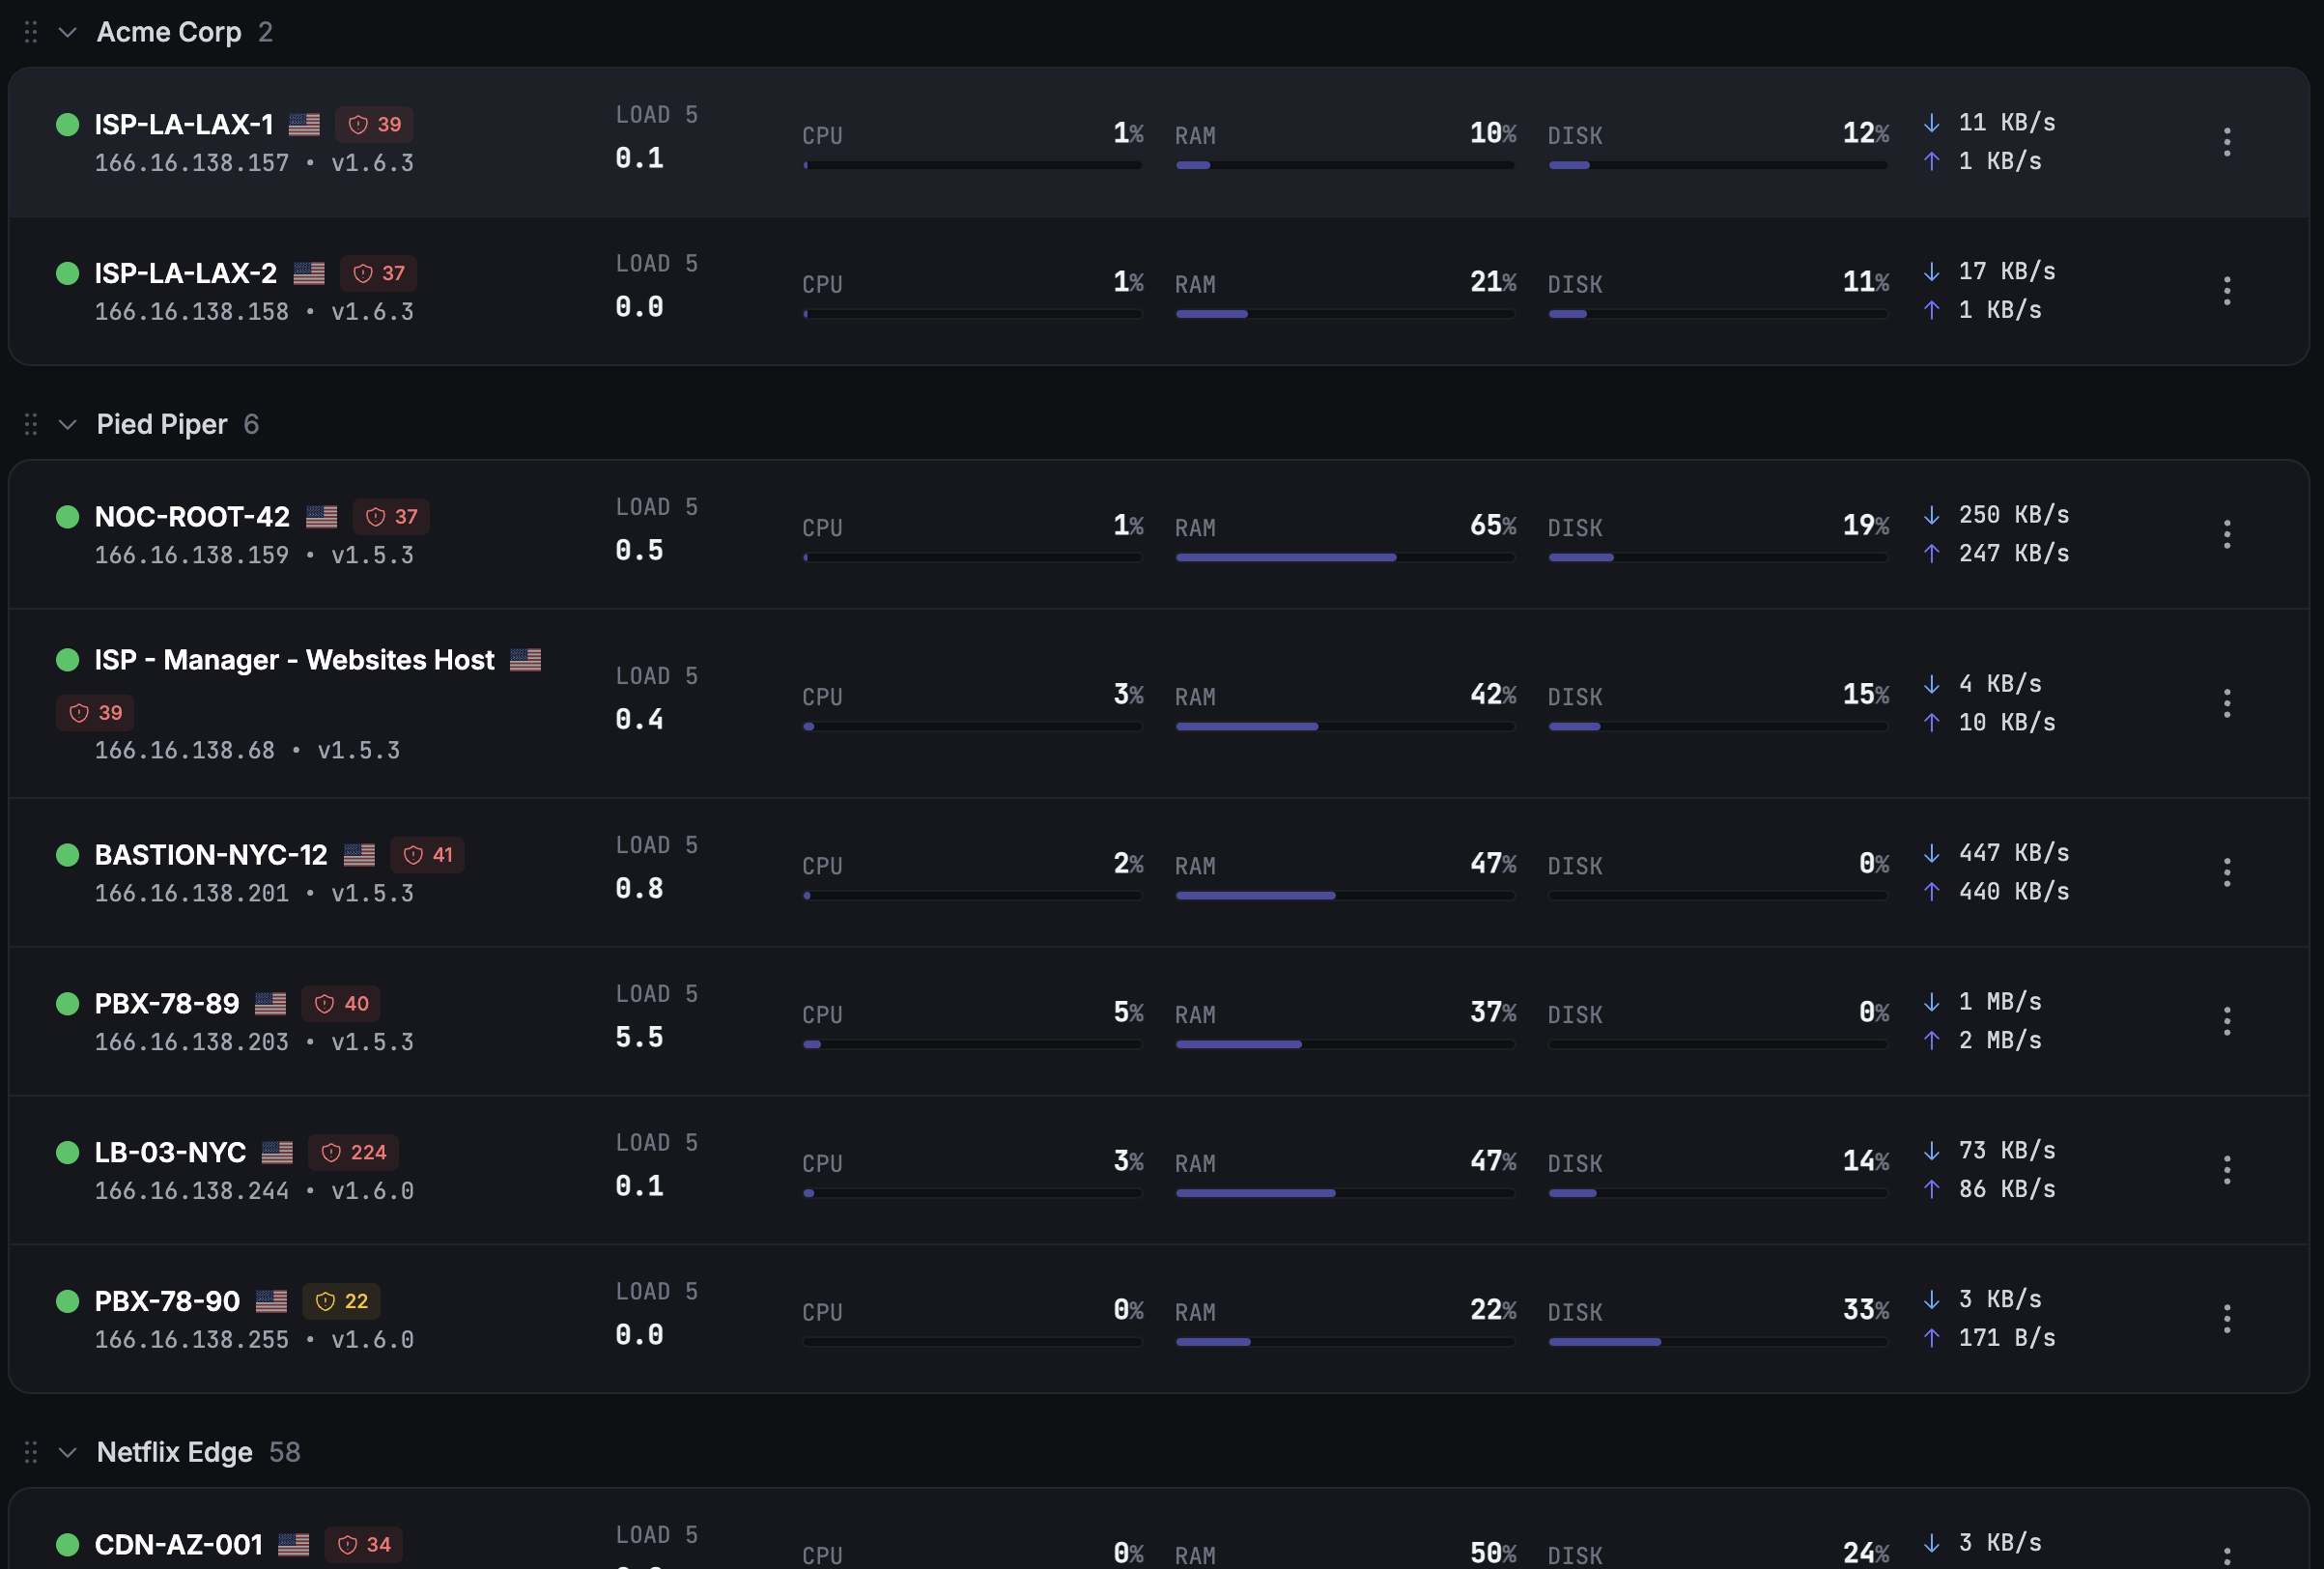
Server metrics
CPU, memory, disk, network, processes and services out of the box on Linux and Windows. Track Docker, Proxmox, GPU and package security where your stack needs it.
CPU
34%
RAM
62%
Disk
48%
Uptime + SSL
HTTPS, TCP, ICMP and DNS checks from multiple regions with SSL certificate expiry tracking.
Cron job monitoring
Heartbeat monitoring for scheduled jobs. Alert when a job fails, runs late or hangs.
$ curl https://fivenines.io/hb/nightly-billing
✓ heartbeat received · 02:00 UTC
Multi-environment alerting
Route production incidents differently from staging and dev. Keep noisy non-prod alerts away from the 3 AM path.
REST API + Terraform
Manage monitors as code, provision checks from CI/CD and keep monitoring versioned with your infrastructure.
$ terraform apply
+ fivenines_uptime_check.api
Apply complete. Resources: 4 added.
Customer status page
Branded status page on your domain with uptime, incidents and scheduled maintenance.
status.yoursaas.com
All systems operational
Kill 3 AM staging alerts
Different environments, different alerting policies.
Production should page. Staging should inform. Development should usually stay quiet. Keep those paths separate without maintaining another Alertmanager rule file.
- ✓Separate prod, staging and dev monitors in seconds
- ✓Route each environment to the right channel
- ✓Mute non-prod or send digest summaries only
Routing matrix
Configured via UI, REST API or Terraform
Fivenines vs Prometheus + Grafana, Datadog and Better Stack
Most SaaS teams compare a self-hosted monitoring stack, a broad enterprise observability suite and simpler uptime tools. Here is the practical tradeoff.
| Capability | Fivenines | Prometheus + Grafana | Datadog | Better Stack |
|---|---|---|---|---|
| Time to first metric | 2 minutes | 1-3 days setup | 30+ minutes | 15+ minutes |
| Server metrics agent | Open-source agent | Node exporter | Proprietary agent | Limited |
| Uptime + SSL checks | Included | Not native | Add-on | Included |
| Cron job monitoring | Included | Manual setup | Add-on | Included |
| Status pages | White-label | Not native | Add-on | Included |
| Multi-env routing | Native workflows | Alertmanager rules | Tags and monitors | Limited |
| Package vulnerability scanning | Included | Build your own | Security add-ons | Not core focus |
| Maintenance burden | Zero | High | Zero | Low |
| Terraform provider | Included | Community modules | Included | No |
| Open-source agent | Yes | Yes | No | No |
| Pricing transparency | Self-serve | Free license, engineer time | Complex | Self-serve |
| Starting price | €27/mo | Free license, 5-15h/mo | $15+/host/mo | $24/mo |
From zero to production monitoring in an afternoon
Start with production metrics, add customer-facing uptime checks, then publish a status page before the day ends.
0:00
Install the agent on production
Run one shell command per server, or use Ansible and your existing config management. Metrics start flowing within 60 seconds by default.
$ wget -qO- https://releases.fivenines.io/latest/fivenines_setup.sh | sudo sh -s ENROLLMENT_TOKEN
✓ Agent installed on api-prod-01
0:15
Add uptime checks and environments
Add customer-facing URLs, then tag or group monitors by production, staging and development.
https://api.yoursaas.com/health
1:00
Route alerts by environment
Send production to your on-call path, staging to a team channel and development to a quiet digest.
Afternoon
Publish the customer status page
Point status.yoursaas.com to Fivenines and give customers a clean place to check incidents.
status.yoursaas.com
All systems operational
Built for B2B trust
Maintain customer trust without building your own status page.
Enterprise customers expect clear incident communication. Give them a stable status page and keep security posture conversations honest from the first procurement call.
- ✓Branded status page on your domain
- ✓EU hosting with GDPR-aware data handling
- ✓Current security and compliance posture available on request
status.yoursaas.com
All systems operational
90-day uptime · 99.99%
Powered by Fivenines · Subscribe to incident updates
What engineers and operators say
Real Trustpilot reviews from teams using Fivenines for infrastructure monitoring.
Fivenines has been completely reliable...
Fivenines has been completely reliable and the service continues adding features at a fast clip. My subscription just keeps gaining value, which is a great thing!
Mike Horgan
United States · May 1, 2026
Been with the service from ground...
Been with the service from ground floor; the dev is really nice and insanely effective - more than once I've been reporting bugs and assisting with testing while things were being fixed LIVE! It's obvious that he has aspirations and he's been delivering over expectations constantly. The actual product works perfectly along the other monitoring solutions I'm using (currently Hetrixtools and Komari) and for those who are more wary of unknown code running on their prods the code is available via Git. Nothing but recommendations from me!
ZalnT
Sweden · Apr 14, 2026
We have been very happy with Fivenines
The interface is clear and setup was straightforward. Support has been responsive, and alerts arrive promptly when issues arise, enabling quick incident response. Reliability at fair pricing.
Philipp
Germany · Jan 2026
Finally Found a Versatile Server Monitoring at a Sensible Price
After years searching for adequate monitoring tools, Fivenines stands out with its balanced feature set, clean design, reasonable pricing, and genuinely helpful customer support.
T George
Netherlands · Aug 2025
One of the best server monitoring tools I've used
The tool is continuously improving with dedicated developer support. They're responsive to user feedback and I've successfully deployed it as a replacement for our hosting provider's monitoring.
Ahmed
Egypt · Aug 2025
Finally an affordable and pleasant server monitoring tool!
After several competitors closed or declined, Fivenines emerged as the perfect alternative. Easy installation, fast performance with historical charts. Exactly what I was looking for.
Adrien
France · Sep 2025
Transparent pricing. No surprise charges.
Most SaaS teams start on Pro. Move to Business for SSO, SMS/webhooks and longer retention.
Pro
For SaaS teams with 5-15 production servers
- ✓50 monitors
- ✓10 team members
- ✓White-label status page
- ✓12 months data retention
- ✓Vulnerability scanning
Business
For teams with SSO needs or larger production stacks
- ✓100 monitors
- ✓25 team members
- ✓SAML SSO
- ✓SMS and webhook alerts
- ✓24 months data retention
Enterprise
For larger fleets or compliance requirements
- ✓300+ monitors
- ✓50+ team members
- ✓Custom intervals down to 5 seconds
- ✓Dedicated support contact
- ✓Custom SLA and onboarding
All paid plans include a 14-day free trial. No credit card required.
Frequently asked questions from SaaS teams
Compare & alternatives
How is Fivenines different from self-hosting Prometheus, Grafana and Alertmanager? +
How is Fivenines different from Datadog? +
How is Fivenines different from Better Stack? +
Do you support APM, logs or traces? +
Integration & workflow
Do you have a Terraform provider? +
Do you integrate with PagerDuty, Opsgenie or Slack? +
Can I manage monitors through the API in CI/CD? +
Do you support dev, staging and production environments? +
Trust, compliance & data
Where is my data hosted? +
Are you SOC 2 or ISO 27001 certified? +
Get production monitoring back in your engineering team's hands.
Try Fivenines free for 14 days. Or try the live demo with real production data. No signup required.
No credit card · Live in 2 minutes · From €27/month
Made in Montpellier · Open-source agent on GitHub