The 15 best infrastructure monitoring tools in 2026
Written by the Fivenines team · Last updated: April 2026
What is infrastructure monitoring?
Infrastructure monitoring is the continuous observation of your servers, networks, applications, and cloud resources to detect issues before they impact your users. It is the difference between knowing your site is down and your customers telling you it is down.
Key criteria to evaluate:
- • Uptime monitoring - Detect when services go offline
- • Server metrics - CPU, RAM, disk, network I/O
- • Application performance - Response times, error rates
- • Alerting - Immediate alerts via email, Slack, PagerDuty
- • Dashboards - Real-time visibility without complexity
- • Security visibility - CVE scanning, open port detection, SSL certificate monitoring
- • Ease of setup - Agent-based vs agentless, configuration time
- • Pricing model - Per-host, per-metric, or flat-rate. Use our SLA calculator to understand uptime costs.
Too many tools costs more than you think
Most teams end up paying for 3-5 separate tools to cover uptime, server metrics, alerting, and dashboards. That is 3-5 subscriptions, 3-5 interfaces to learn, and 3-5 places where alerts can get lost. A single platform that covers everything is cheaper and simpler to operate.
The 15 best infrastructure monitoring tools
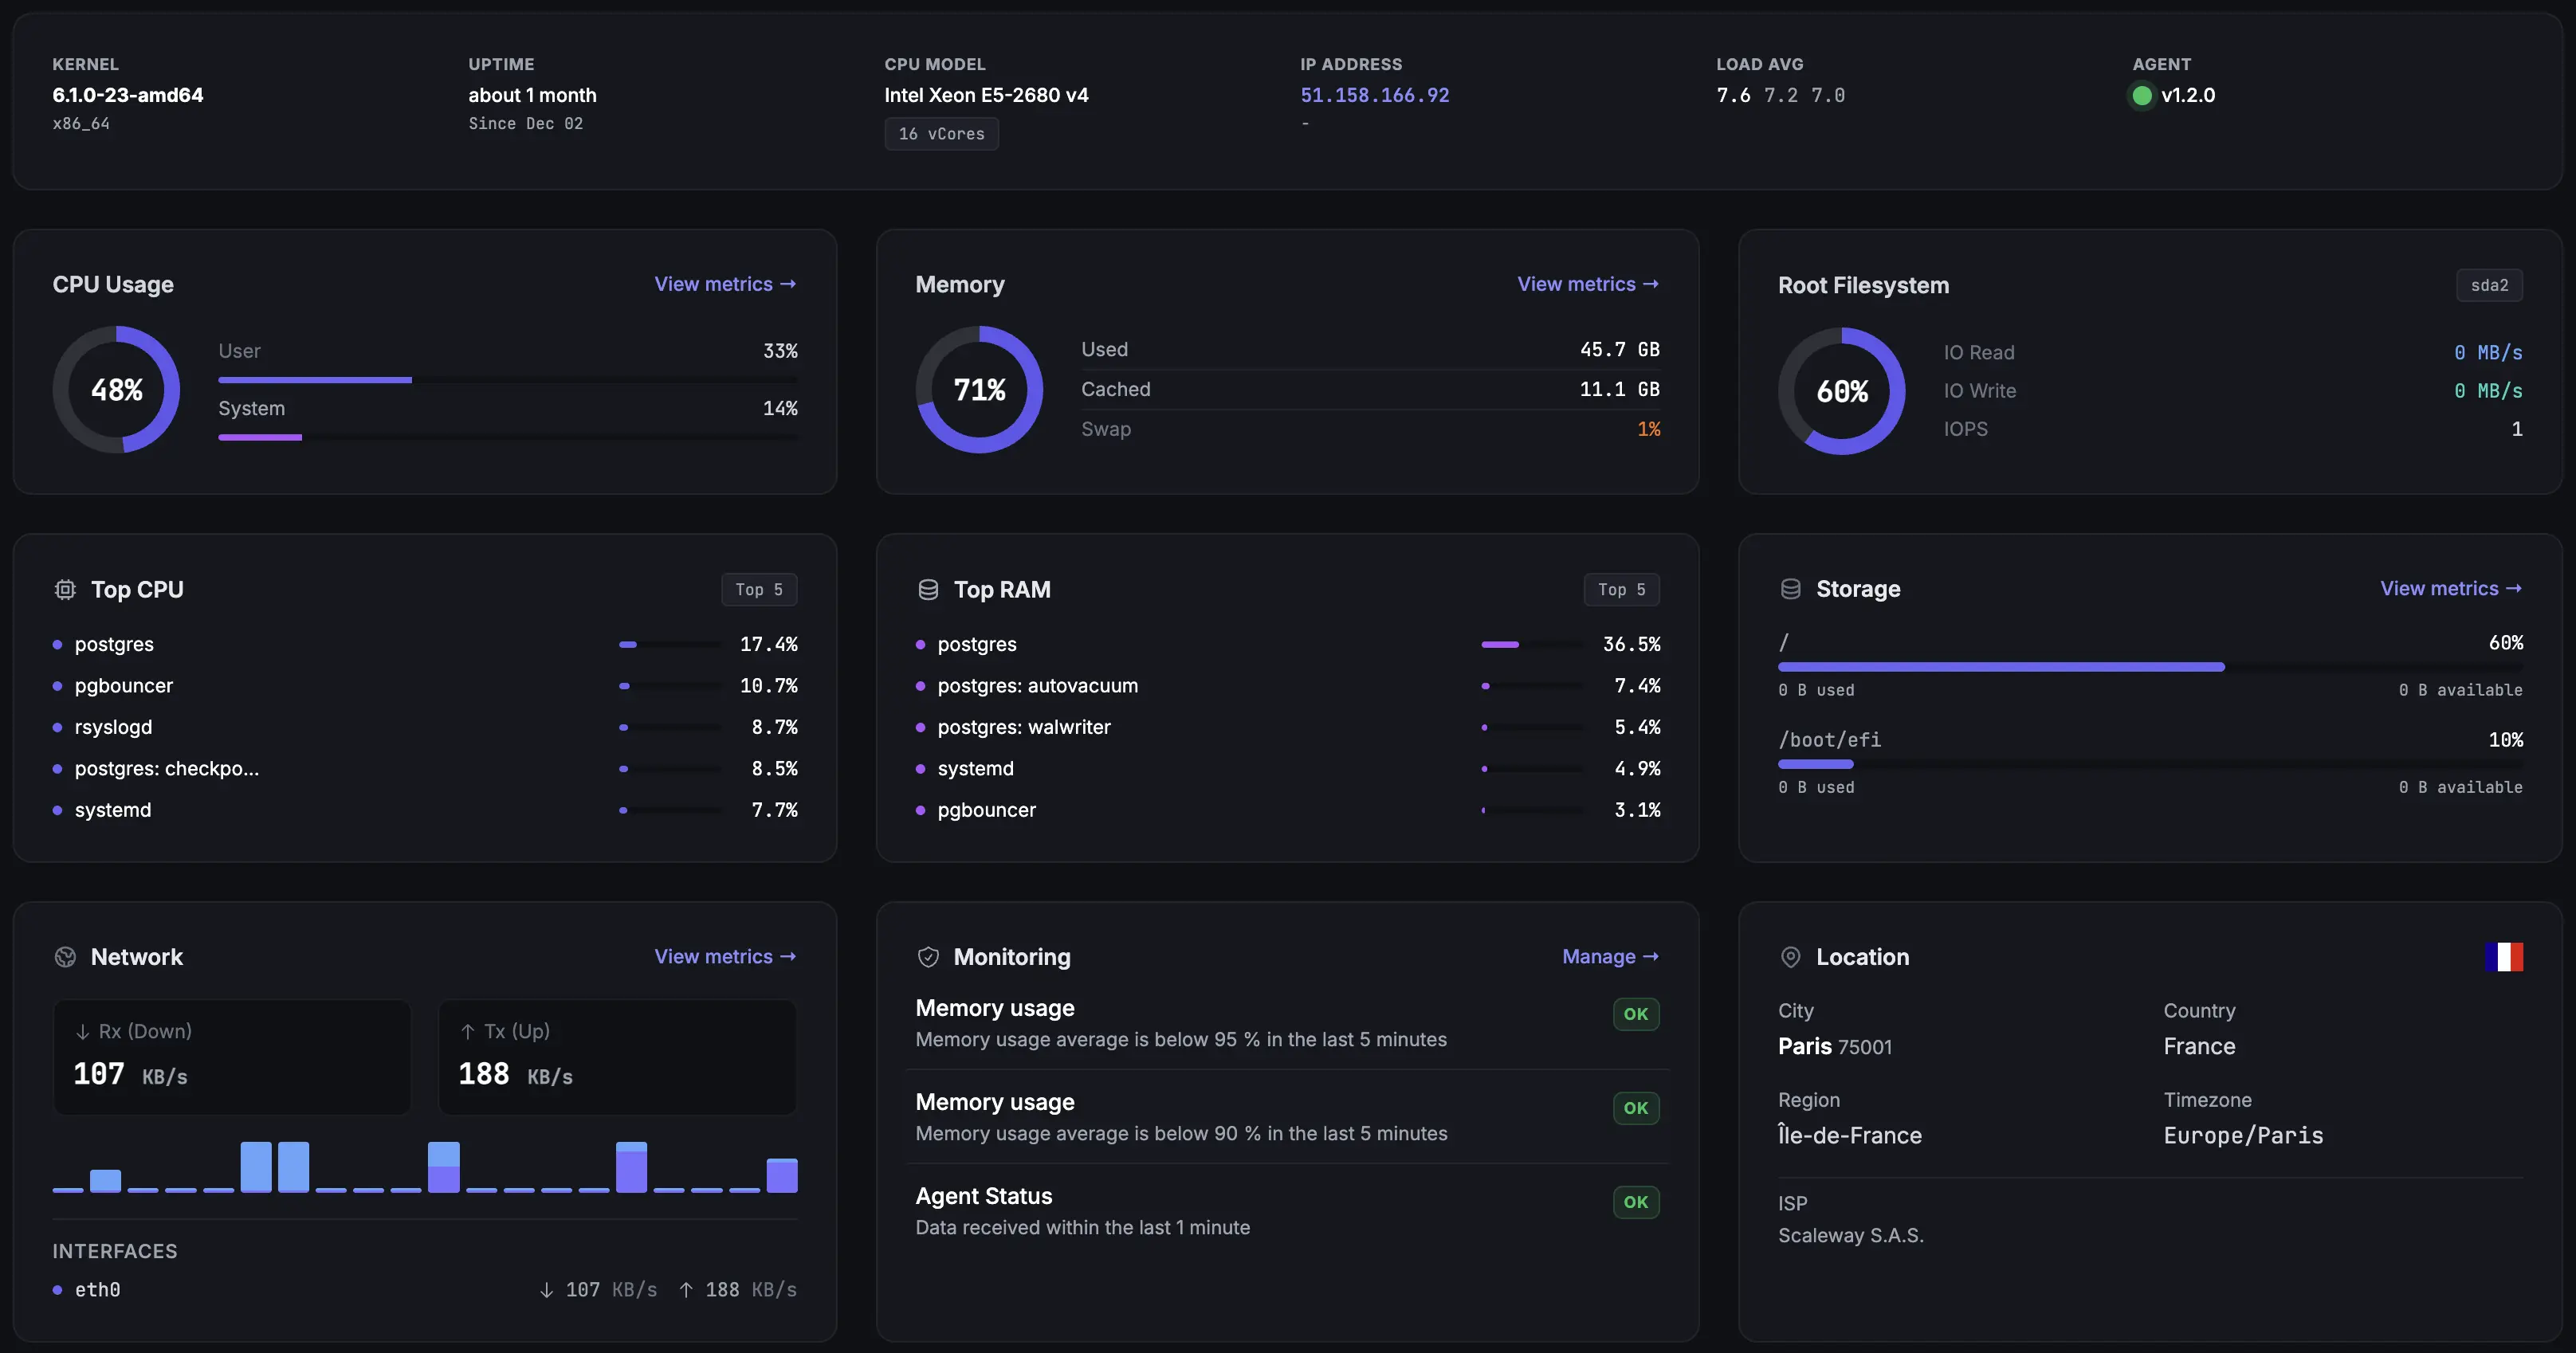
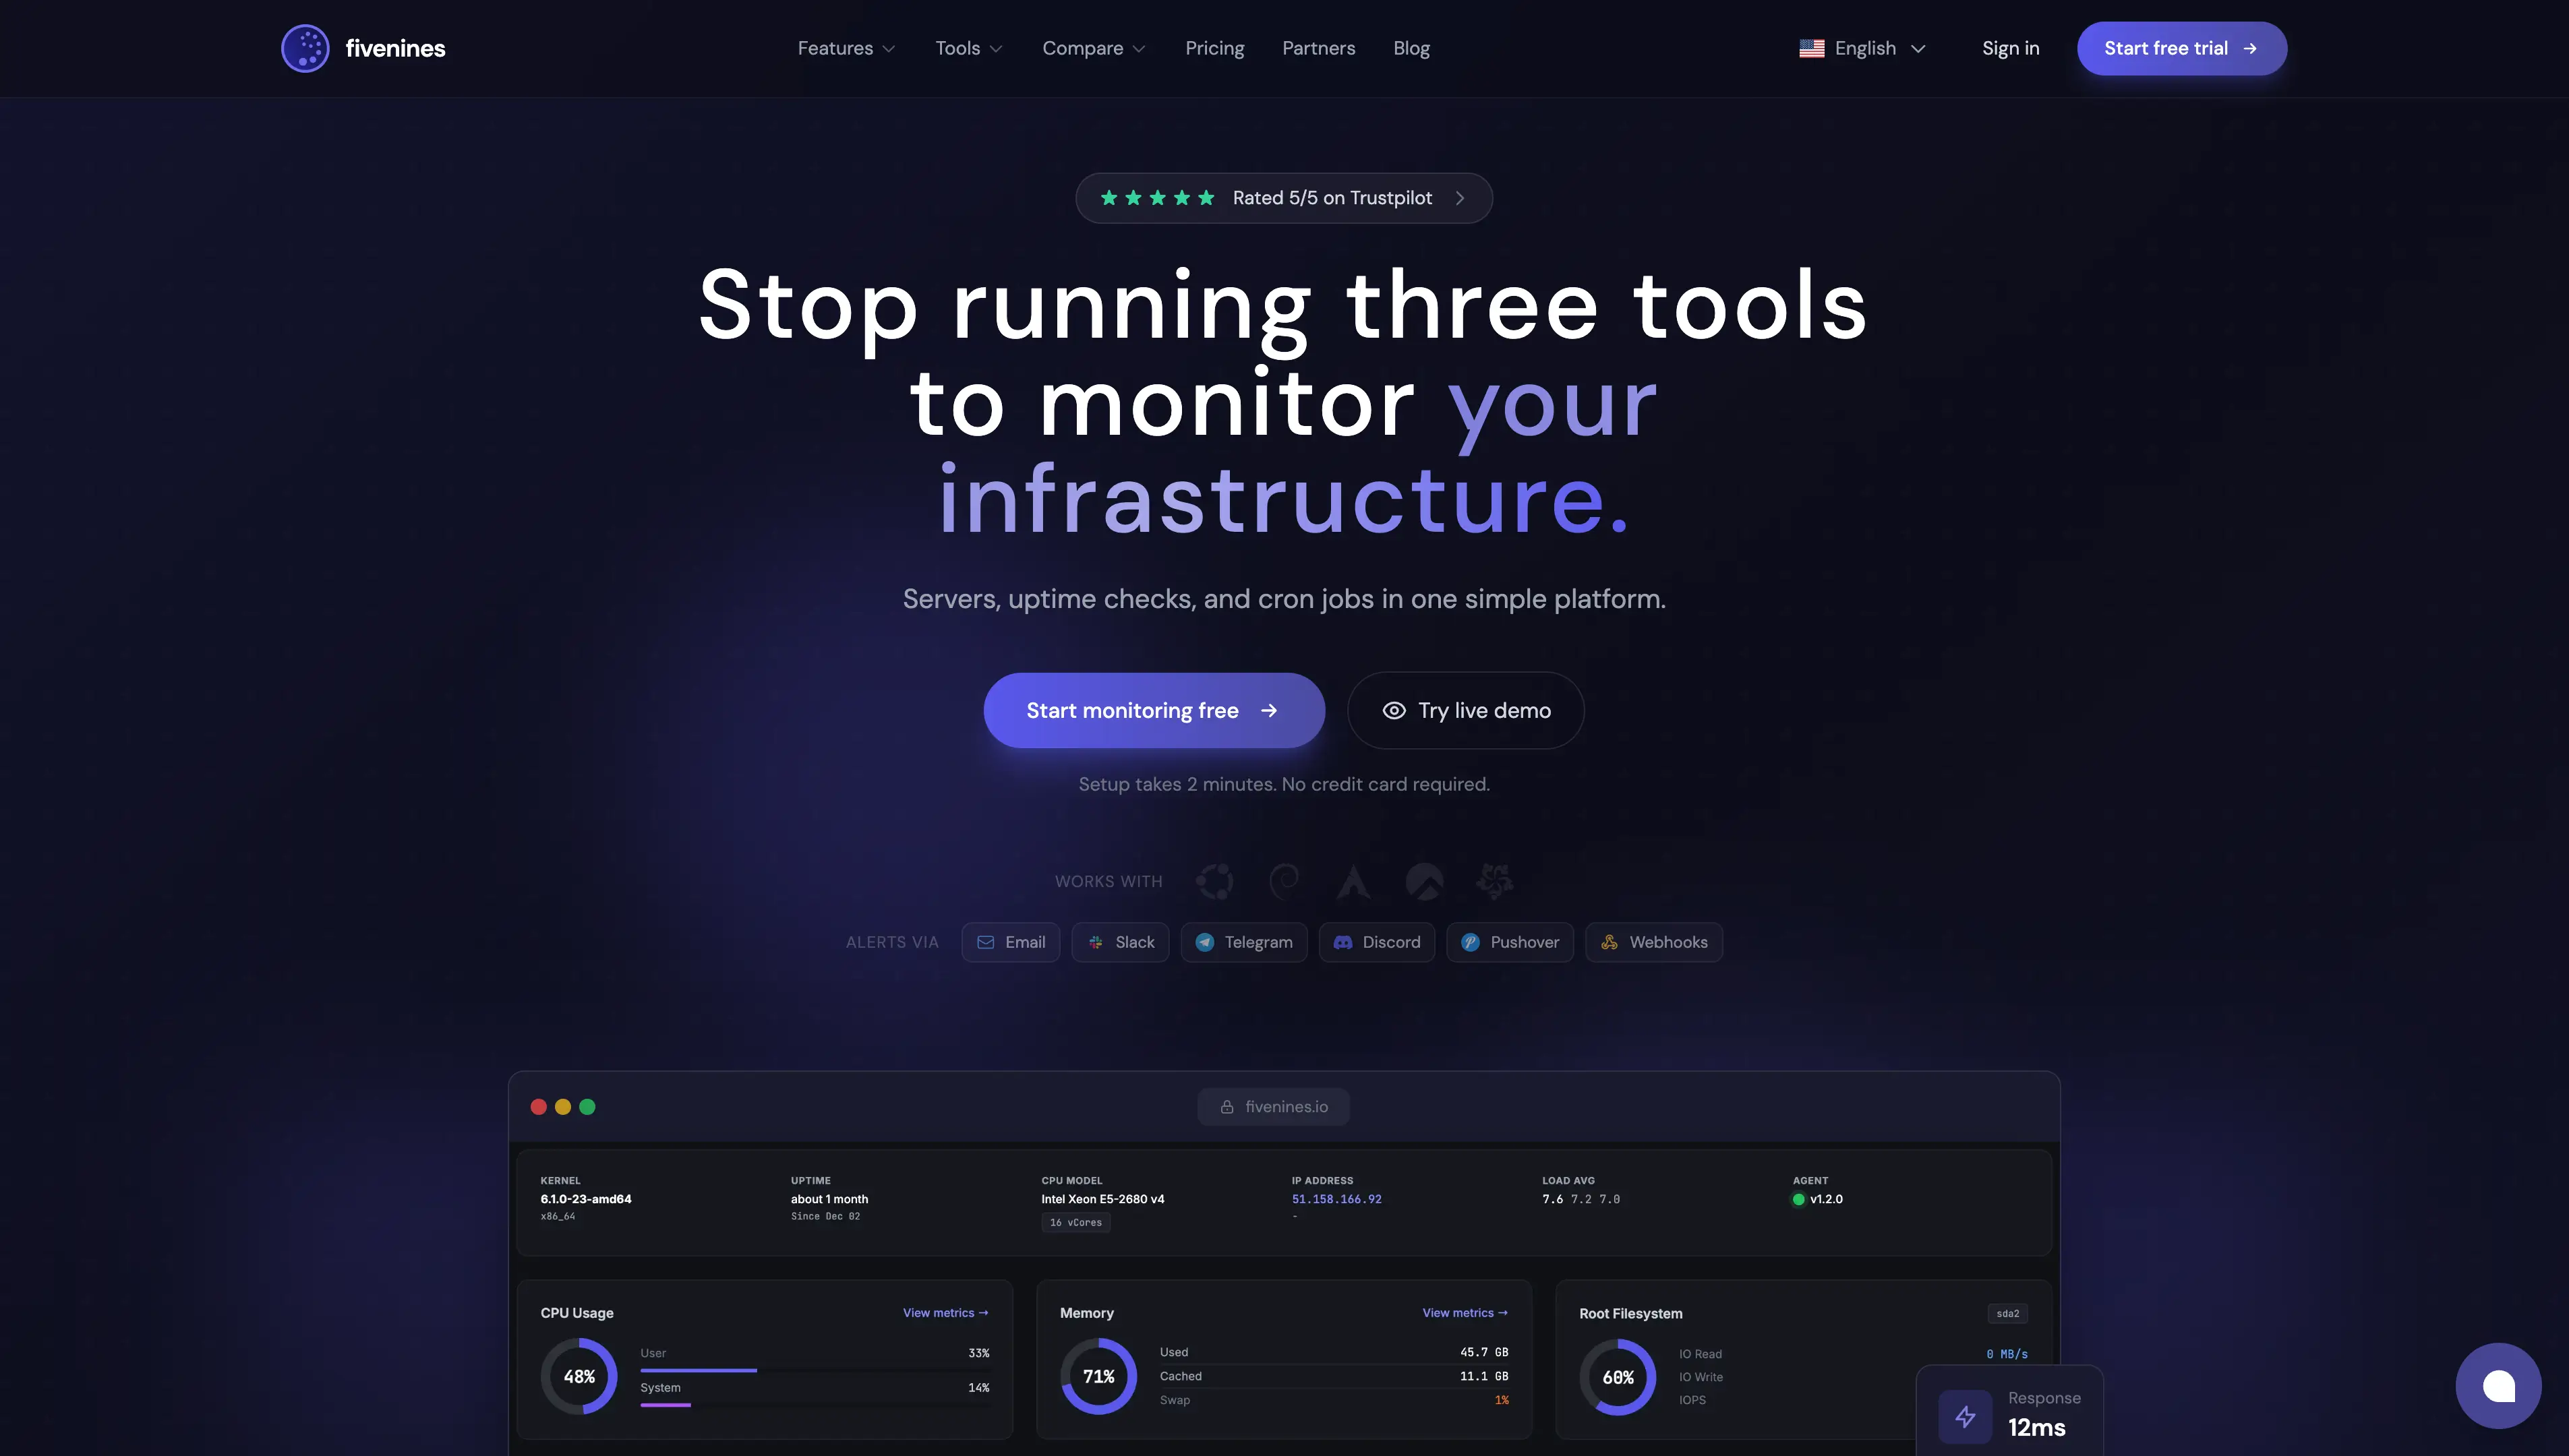
1. Fivenines
Best for: Engineering teams who want complete infrastructure visibility without the operational overhead of enterprise platforms.
Fivenines is a monitoring platform that lets you focus on building your product instead of maintaining your monitoring stack. It combines uptime monitoring, server metrics, Docker and VM monitoring, vulnerability scanning, and workflow-based alerting in a single dashboard. No agents required for uptime checks. For deeper metrics, the optional lightweight agent deploys in 2 minutes.
Key features:
- • Uptime monitoring from 3 regions (US East, EU West, Asia Pacific)
- • Server metrics (CPU, RAM, disk, network) with 5-second precision
- • Docker, Proxmox VM, and GPU monitoring
- • Vulnerability scanning (CVE detection across all servers)
- • HTTPS, TCP, DNS, and ICMP checks
- • Alerting via Email, Slack, Discord, Telegram, Pushover, and webhooks
- • SNMP network device monitoring (switches, routers, firewalls)
- • Incident timeline and status pages
- • REST API and Terraform provider
- • No per-host pricing, flat-rate plans
Pricing: 14-day trial, then Starter $9/mo (15 monitors), Pro $27/mo (50 monitors), Business $49/mo (100 monitors), Enterprise (custom). All monitor types (servers, uptime, tasks, network devices) count equally.
Pros:
- • Simple, clean interface, no learning curve
- • Affordable, predictable pricing with no hidden costs
- • Fast setup (5 minutes to first alert)
- • All-in-one: servers, containers, uptime, network, security
- • Lets your team focus on building, not maintaining monitoring
Cons:
- • Fewer advanced features than Datadog (no APM, limited log aggregation)
- • Smaller ecosystem of integrations
- • Pricing scales with your company, from free to enterprise
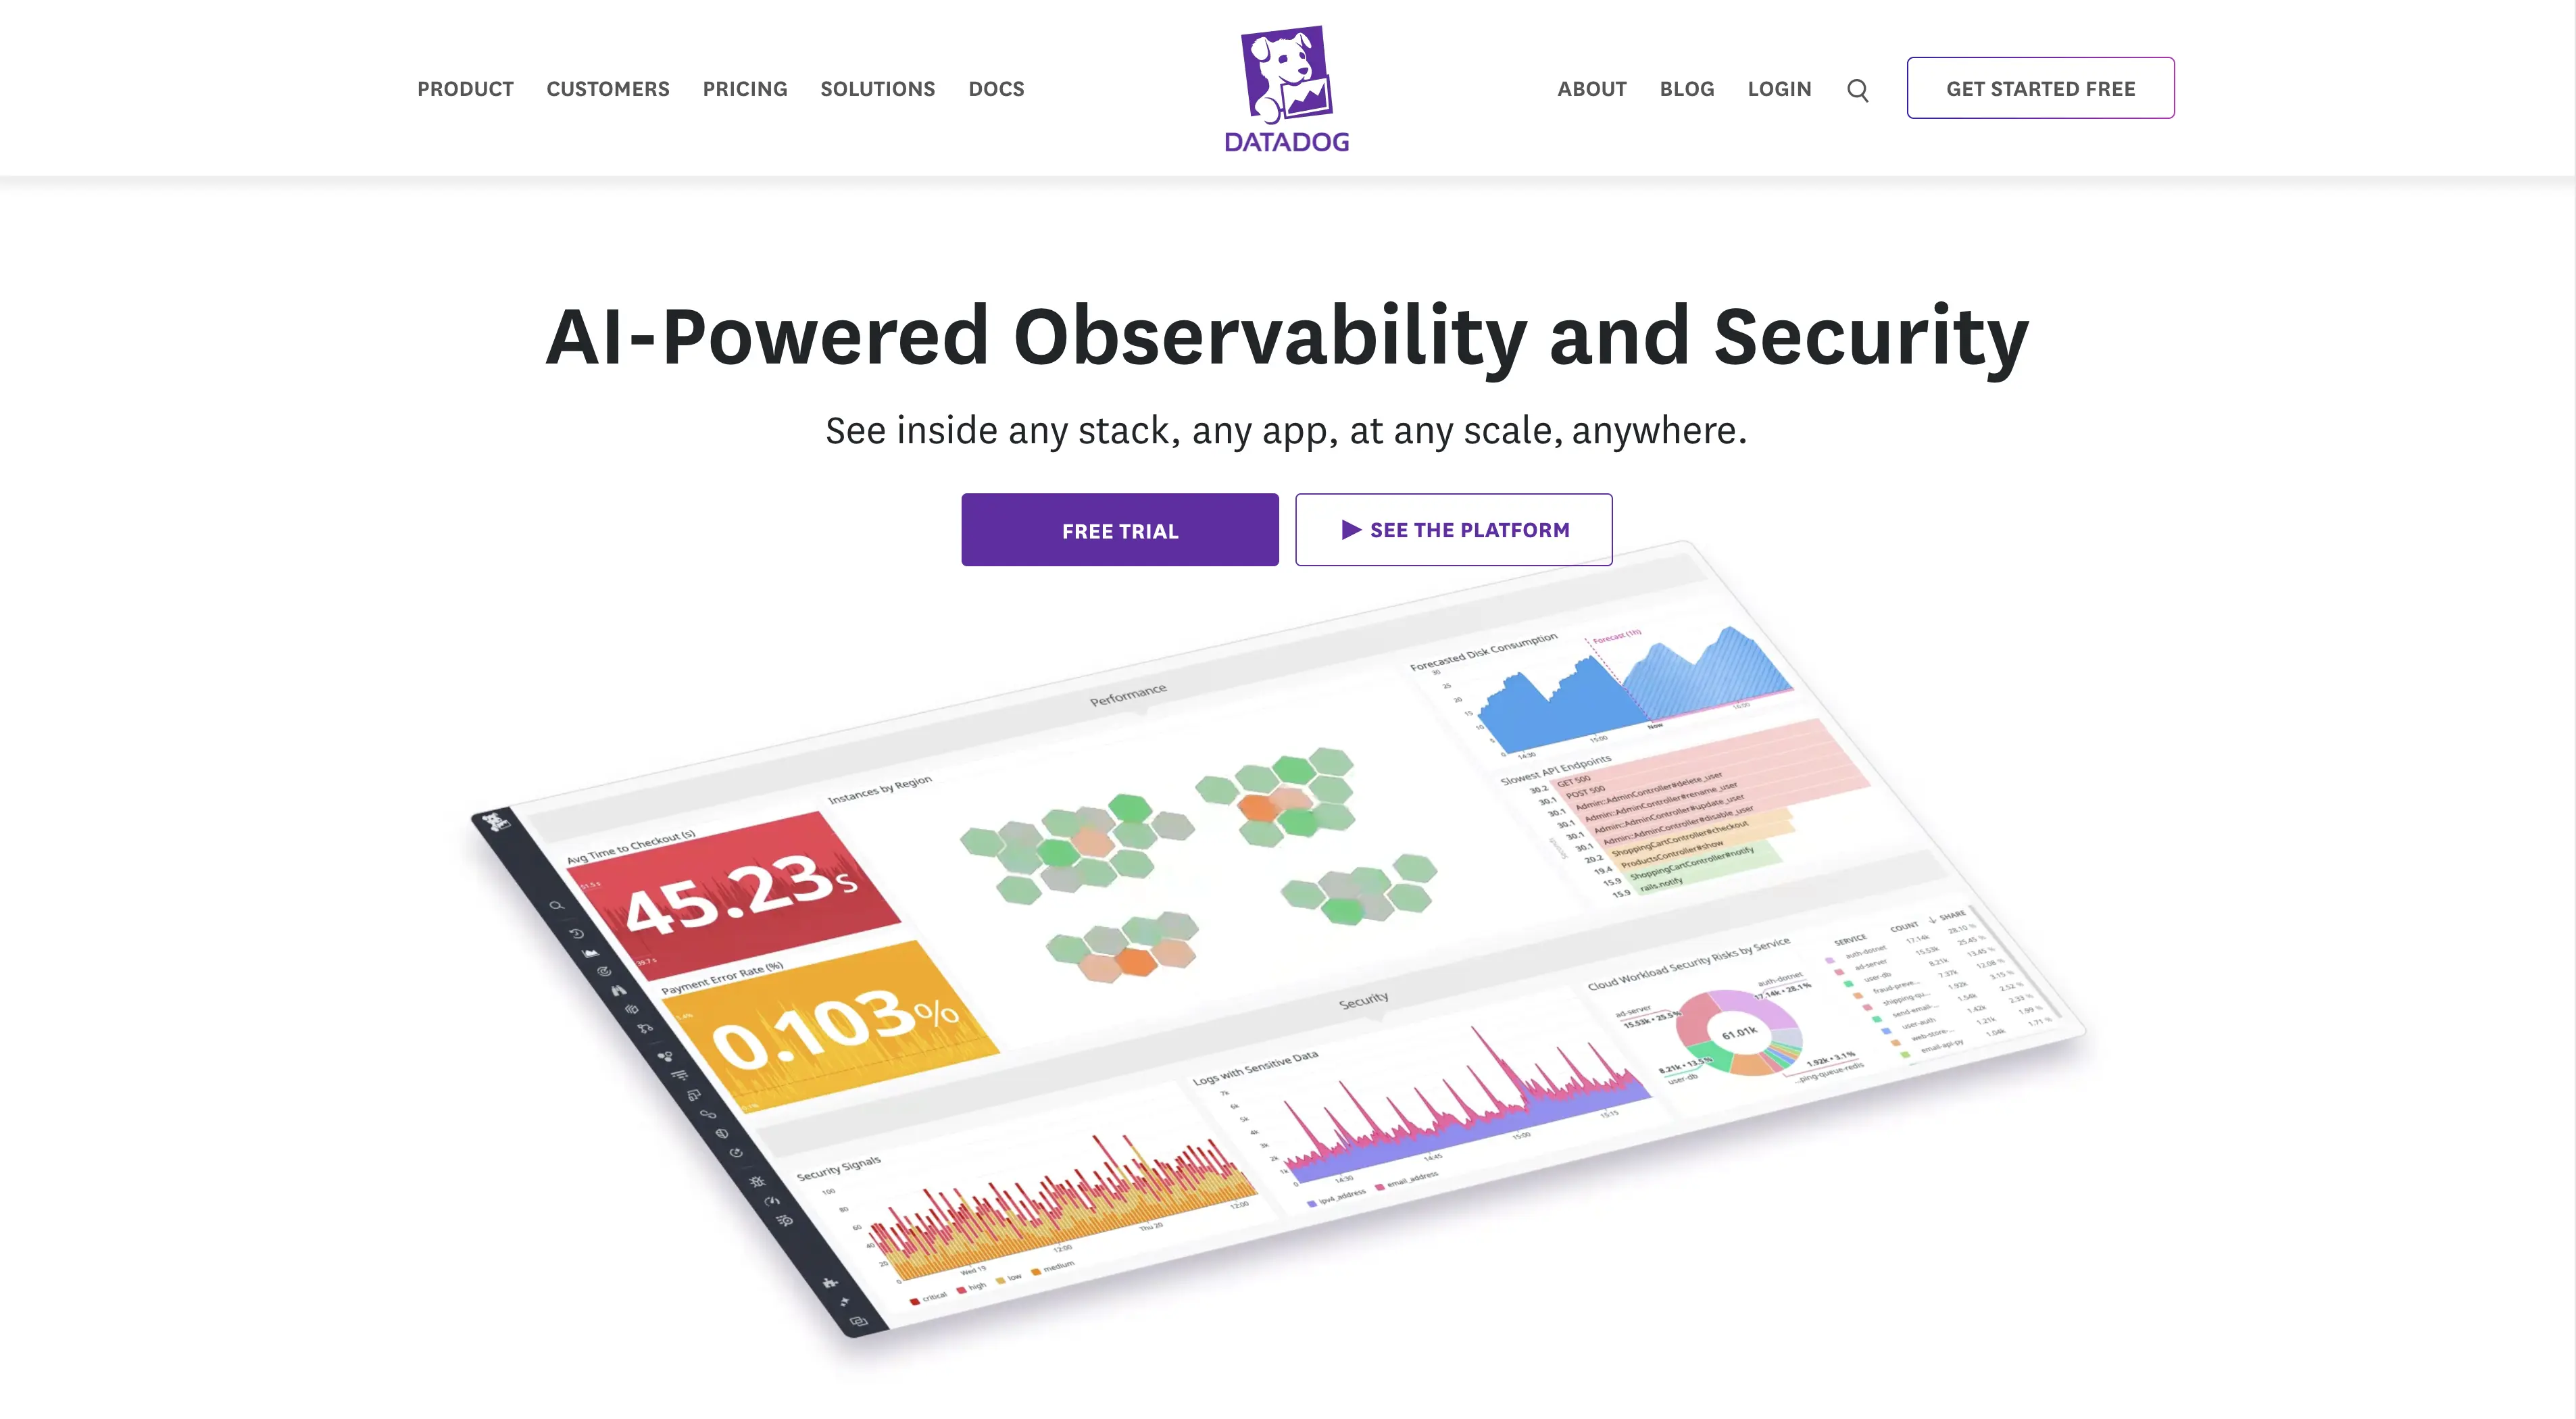
2. Datadog
Best for: Enterprise teams, complex cloud environments, and organizations needing advanced APM and log aggregation.
Datadog is the market leader in observability. It monitors infrastructure, applications, logs, and user experience from a single platform. Powerful, but comes with complexity and cost.
Pricing: $15-$23 per host/month (varies by plan), additional costs for logs, APM, RUM
Pros:
- • Most complete observability platform on the market
- • Strong Kubernetes and cloud-native support
- • 600+ integrations
Cons:
- • Steep learning curve
- • Expensive at scale (per-host + per-metric)
- • Overkill if you do not need full observability
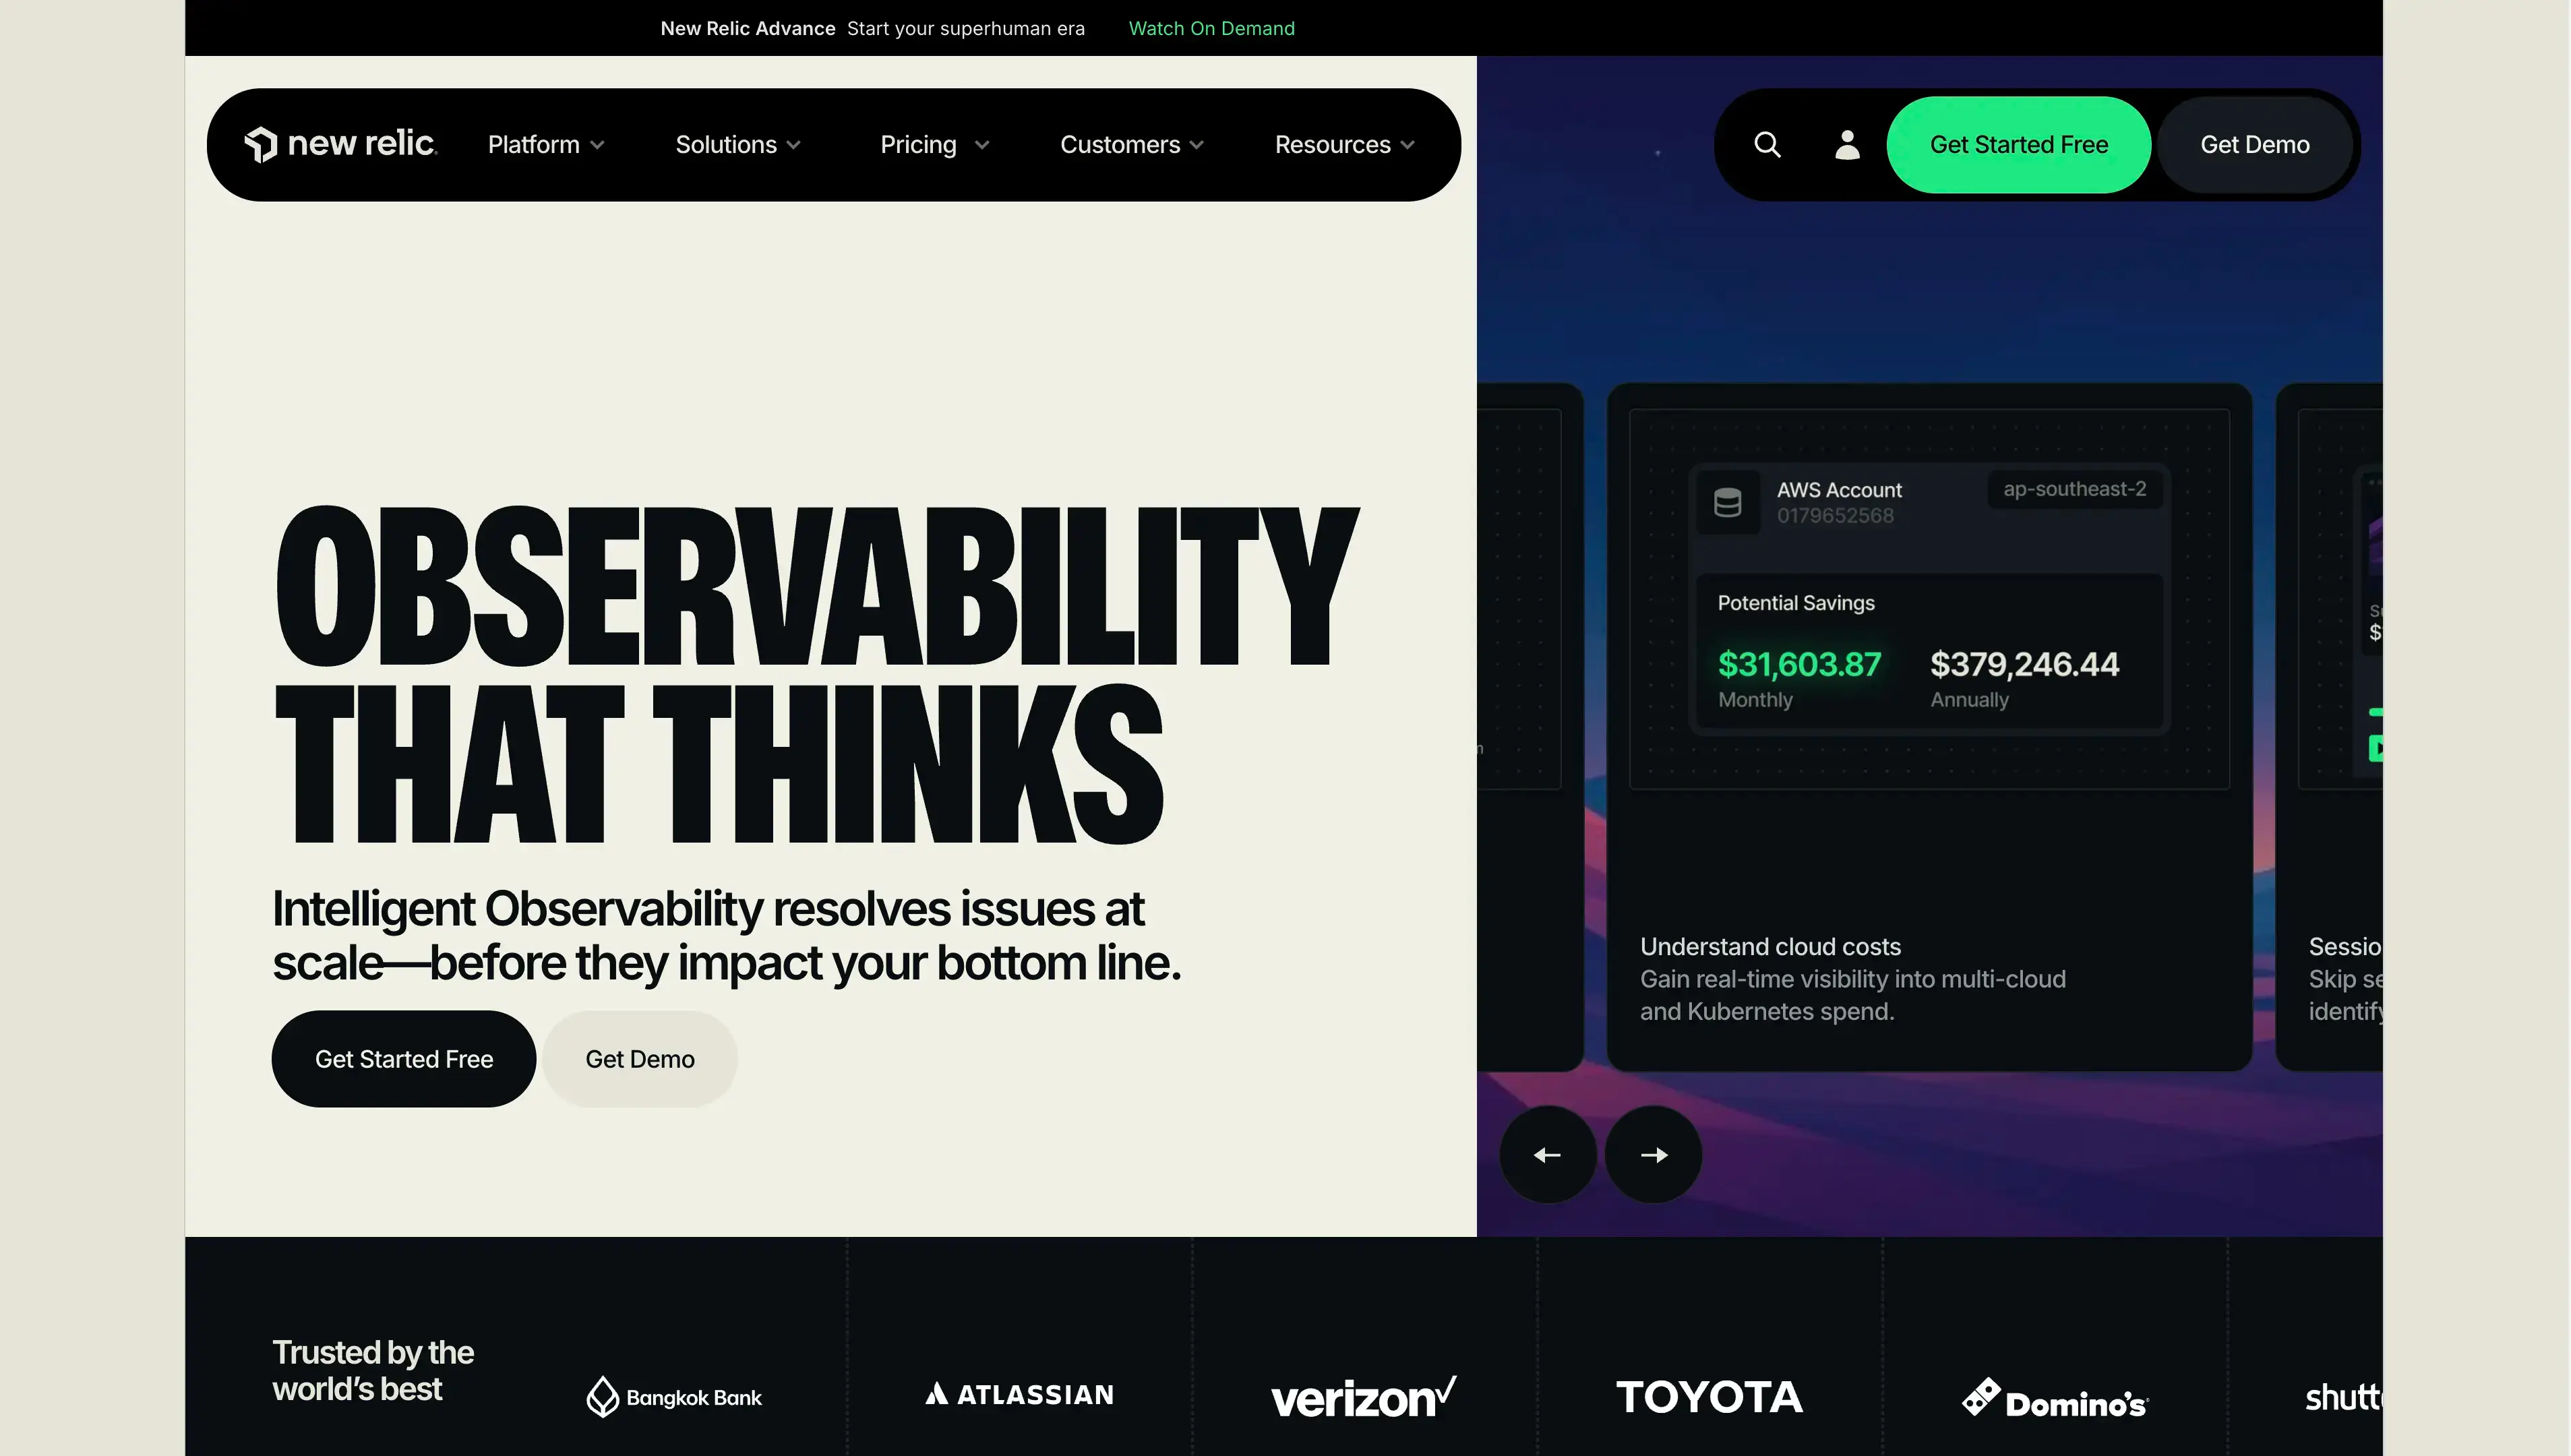
3. New Relic
Best for: DevOps teams focused on application performance and cloud infrastructure.
New Relic provides full-stack observability: infrastructure, applications, logs, and synthetics. Strong APM capabilities, but pricing can be unpredictable.
Pricing: $0.30 per GB ingested (consumption-based), minimum ~$100/month
Pros:
- • Solid APM capabilities
- • Consumption-based pricing (pay for what you use)
- • 400+ integrations
Cons:
- • Pricing can spike with high data ingestion
- • Steeper learning curve
- • Requires agents on all monitored systems
4. Grafana + Prometheus
Best for: DevOps teams, open-source advocates, and organizations with in-house infrastructure expertise.
Prometheus is the de facto standard for metrics collection in cloud-native environments. Grafana provides beautiful dashboards on top. Both are open-source and free.
Pricing: Free (self-hosted), Grafana Cloud starts at $50/month
Pros:
- • Completely free and open-source
- • Industry standard for Kubernetes
- • Highly customizable, no vendor lock-in
Cons:
- • Steep learning curve (PromQL, YAML config)
- • Requires expertise to set up and maintain
- • No built-in uptime monitoring
5. Zabbix
Best for: Enterprise IT teams, on-premise environments, and organizations needing deep customization.
Zabbix is a mature, open-source monitoring platform used by large enterprises. Powerful but complex.
Pricing: Free (open-source), commercial support available
Pros:
- • Free and open-source
- • Highly customizable
- • Covers on-premise and network monitoring
Cons:
- • Steep learning curve
- • UI feels dated
- • Not ideal for cloud-native environments
6. Nagios
Best for: Legacy environments, on-premise infrastructure, and teams with deep Nagios expertise.
Nagios is one of the oldest monitoring platforms. Still widely used in enterprises, but newer alternatives are often better.
Pricing: Free (open-source), commercial support available
Pros:
- • Free and open-source
- • Massive plugin ecosystem (5000+)
- • Proven in large enterprises
Cons:
- • Very steep learning curve
- • UI is outdated
- • Configuration is complex (text files)
7. Checkmk
Best for: Enterprise IT teams needing a modern alternative to Nagios.
Checkmk is a modern monitoring platform built on Nagios core. It simplifies configuration and adds modern features.
Pricing: Free (open-source), commercial editions start at €240/month
Pros:
- • Modern UI vs Nagios
- • Automatic service discovery
- • Good for on-premise
Cons:
- • Smaller community
- • Still requires operational expertise
- • Not ideal for cloud-native
8. Dynatrace
Best for: Large enterprises needing AI-powered insights.
Dynatrace is an enterprise-grade observability platform with strong AI capabilities. Expensive but powerful.
Pricing: Custom pricing (typically $10,000+/year for small deployments)
Pros:
- • AI-powered anomaly detection
- • Full-featured APM
- • Dedicated support
Cons:
- • Very expensive
- • Steep learning curve
- • Overkill if you do not need full observability
9. Site24x7
Best for: Mid-market teams, hybrid environments, and affordable all-in-one monitoring.
Site24x7 is a cloud-based monitoring platform that combines uptime, infrastructure, and application monitoring.
Pricing: Starting at $25/month for uptime, infrastructure monitoring starts at $60/month
Pros:
- • Affordable all-in-one platform
- • Good for hybrid environments
- • Decent UI
Cons:
- • Less powerful than Datadog or New Relic
- • Smaller ecosystem
- • Support can be slow
10. Pingdom
Best for: Teams and startups focused on uptime monitoring.
Pingdom is a simple uptime monitoring tool. Good for basic needs, but limited for deeper infrastructure monitoring.
Pricing: Starting at $10/month
Pros:
- • Simple to use
- • Affordable
- • Fast setup
Cons:
- • Limited to uptime monitoring
- • No server metrics
- • Limited customization
11. Netdata
Best for: DevOps teams needing real-time metrics with minimal overhead.
Netdata is a lightweight, open-source monitoring agent that provides real-time metrics with minimal resource usage.
Pricing: Free (open-source), Netdata Cloud starts at $20/month
Pros:
- • Lightweight agent
- • Real-time metrics
- • Open-source
Cons:
- • Limited to metrics (no logs or APM)
- • Requires infrastructure expertise
- • Limited enterprise features
12. Better Stack
Best for: DevOps teams and startups wanting a modern alternative to legacy monitoring.
Better Stack is a modern monitoring platform combining uptime checks, infrastructure monitoring, and incident management.
Pricing: Starting at $29/month
Pros:
- • Modern interface
- • Built-in incident management
- • Responsive support
Cons:
- • Smaller ecosystem than Datadog
- • Limited APM
- • Newer platform (less battle-tested)
13. UptimeRobot
Best for: Freelancers, small businesses, and teams needing free uptime monitoring.
UptimeRobot is a free uptime monitoring tool. Simple, reliable, and perfect for basic needs.
Pricing: Free (with limitations), Pro starts at $5/month
Pros:
- • Free tier available
- • Simple to use
- • Reliable
Cons:
- • Limited to uptime monitoring
- • No infrastructure metrics
- • Limited customization
14. Paessler PRTG
Best for: Enterprise IT teams needing network-focused monitoring.
PRTG is a comprehensive monitoring platform with strong network monitoring capabilities.
Pricing: Free for up to 100 sensors, commercial licenses start at €1,600/year
Pros:
- • Covers network monitoring well
- • Wide feature set
- • Works for on-premise
Cons:
- • Steep learning curve
- • UI feels dated
- • Expensive for large deployments
15. OpenObserve
Best for: DevOps teams needing a lightweight alternative to Elasticsearch for logs and metrics.
OpenObserve is a newer open-source observability platform designed as a lightweight alternative to Elasticsearch and Splunk.
Pricing: Free (open-source), managed service pricing available
Pros:
- • Lightweight and fast
- • Open-source
- • Modern architecture
Cons:
- • Newer platform (less mature)
- • Smaller community
- • Limited APM
How all 15 tools compare
Scroll sideways to see all tools →
| Tool | Uptime | Server Metrics | APM | Alerting | Docker | Workflows | Vuln Scan | SNMP | Pricing |
|---|---|---|---|---|---|---|---|---|---|
| Fivenines | Free+ | ||||||||
| Datadog | $15-23/host | ||||||||
| New Relic | $0.30/GB | ||||||||
| Grafana+Prom | Free | ||||||||
| Zabbix | Free | ||||||||
| Nagios | Free | ||||||||
| Checkmk | Free+ | ||||||||
| Dynatrace | Custom | ||||||||
| Site24x7 | $25/mo+ | ||||||||
| Pingdom | $10/mo | ||||||||
| Netdata | Free | ||||||||
| Better Stack | $29/mo | ||||||||
| UptimeRobot | Free+ | ||||||||
| PRTG | €1,600/yr | ||||||||
| OpenObserve | Free |
Ready to try the monitoring tool built for your team?
14-day trial. No credit card required.
No credit card · 2-minute setup · Cancel anytime
How to choose the right tool for your situation
Best for teams that value efficiency
If your priority is spending time on your product instead of configuring monitoring infrastructure, you need a tool that works out of the box with predictable pricing.
Recommended: Fivenines, UptimeRobot, Better Stack
Best for DevOps and cloud-native teams
If you are running Kubernetes, microservices, or cloud infrastructure, you need a metrics-first approach with scalability.
Recommended: Prometheus + Grafana, Datadog, New Relic
Best for enterprise IT
If you are managing large on-premise infrastructure with complex requirements.
Recommended: Zabbix, Checkmk, PRTG, Dynatrace
Best open-source options
Recommended: Prometheus + Grafana (metrics), Zabbix (comprehensive), Netdata (lightweight), OpenObserve (logs)
Best for cost-effective monitoring
Open-source (no license fee): Prometheus + Grafana, Zabbix, Nagios, Netdata, OpenObserve. Keep in mind these require dedicated servers to run, engineering time to install and configure, and ongoing maintenance for updates, backups, and access management. The total cost of ownership is often higher than a managed solution.
Managed (predictable cost, zero ops): Fivenines ($9/month), UptimeRobot ($5/month), Better Stack ($29/month). No infrastructure to maintain, no configuration overhead, working in minutes.
Common mistakes when choosing monitoring software
Mistake #1: Paying for features you do not use
Datadog and New Relic are powerful, but they include APM, log aggregation, RUM, and synthetics. If you only need uptime and server metrics, you are paying for bloat. Start with what you actually need.
Mistake #2: Ignoring the total cost of ownership
Per-host pricing adds up fast. A $15/host/month tool becomes $1,500/month with 100 servers. And "free" open-source tools are not free either: you need servers to run them, engineers to install and configure them, and ongoing time for updates, security patches, backups, and access management. Use our SLA calculator to understand the real cost of downtime.
Managed tools like Fivenines have a predictable monthly cost, zero infrastructure overhead, and work in minutes. The real question is not "what does the license cost?" but "what does it cost my team to operate?"
Mistake #3: Confusing uptime monitoring with infrastructure monitoring
Uptime monitoring (is my website up?) is different from infrastructure monitoring (what is my CPU usage?). Define what you actually need. Uptime only? Pingdom, UptimeRobot. Uptime + metrics? Fivenines, Site24x7. Full observability? Datadog, New Relic.
Mistake #4: Choosing a tool that is too complex for your team
Prometheus, Zabbix, and Nagios are powerful but require expertise. No DevOps expertise? Fivenines, Datadog, New Relic (managed). DevOps available? Prometheus + Grafana, Zabbix.
Mistake #5: Not considering scalability
A tool that works for 10 servers might not work for 1,000. Up to 100 monitors: Fivenines, UptimeRobot. 100-500: Datadog, New Relic, Zabbix. 500+: Datadog, Dynatrace, Zabbix, PRTG.
Frequently asked questions
Questions
What is the difference between uptime monitoring and infrastructure monitoring? +
What is the best free infrastructure monitoring tool? +
How much does infrastructure monitoring software cost? +
Do I need an agent to monitor my servers? +
What is the best monitoring tool for teams that want efficiency? +
Pricing verified as of April 2026. Check each tool's website for current pricing.
Ready to get started?
14-day trial. No credit card required.
No credit card · 2-minute setup · Cancel anytime