The 12 best Proxmox monitoring tools in 2026
Written by the Fivenines team · Last updated: September 2026
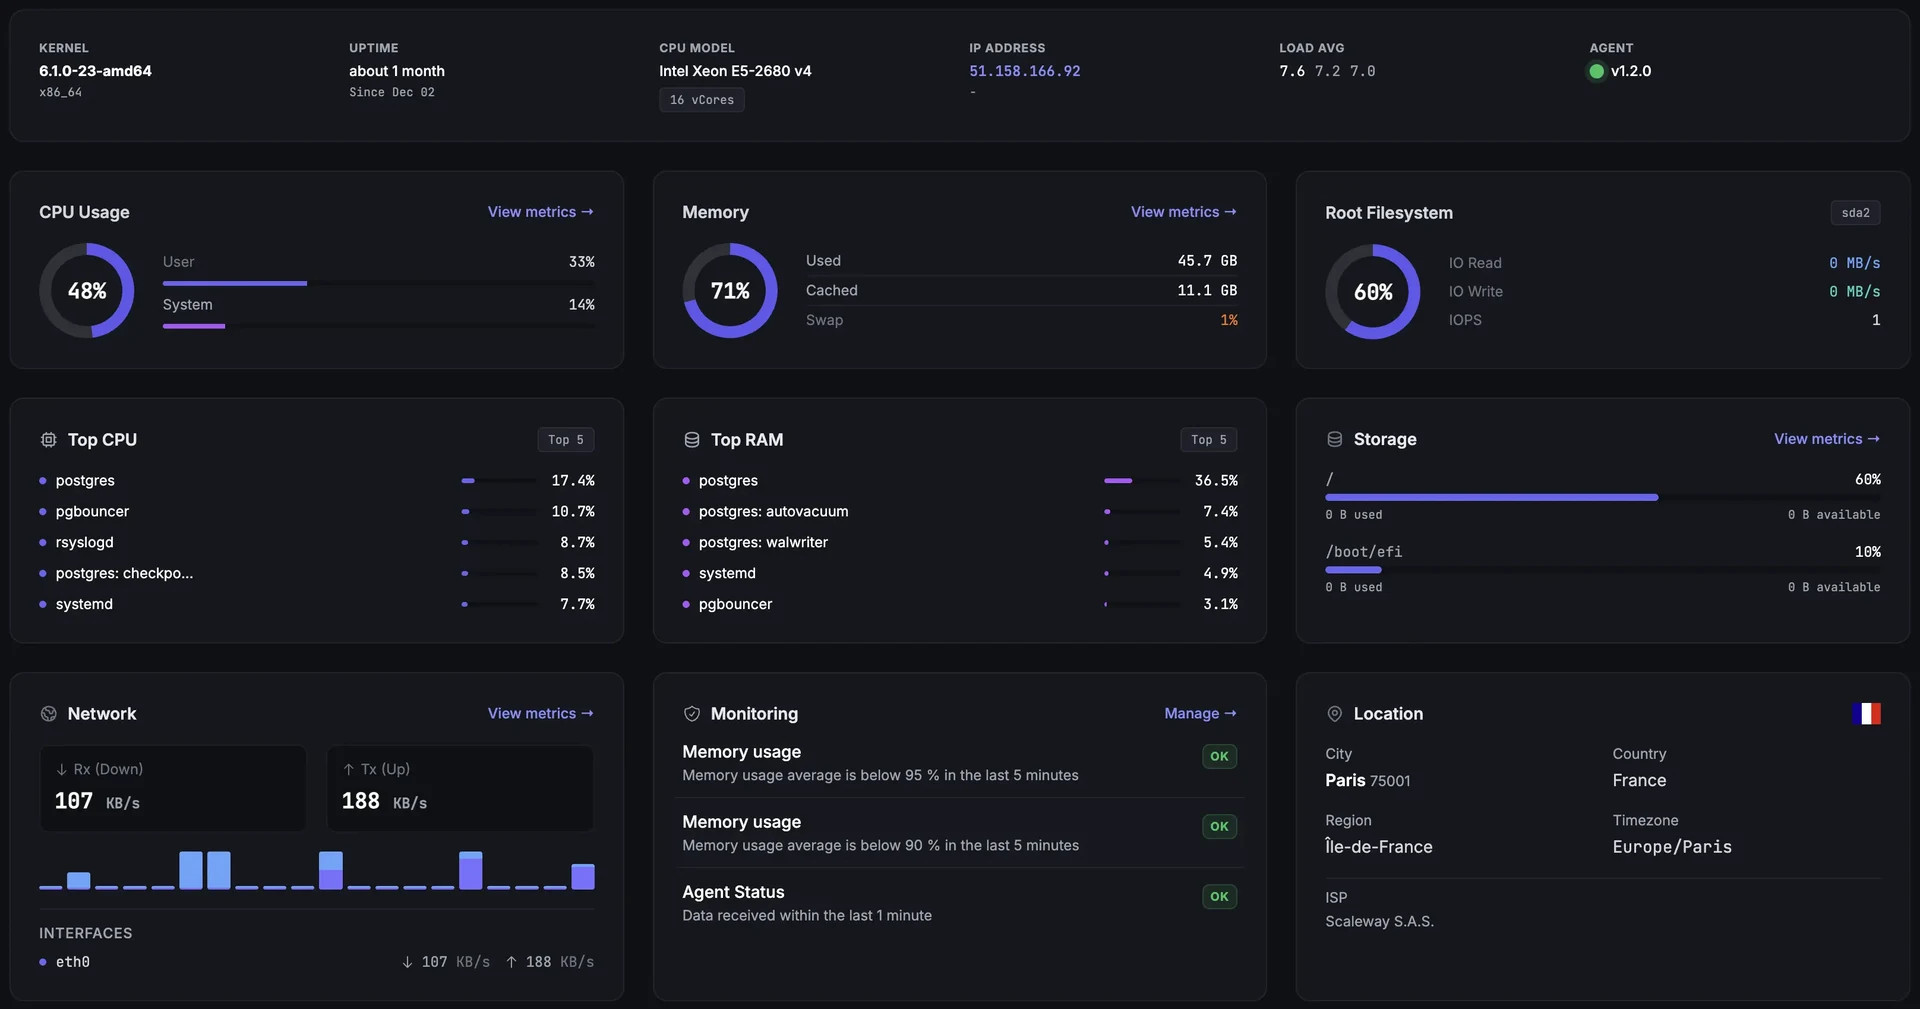
What is Proxmox monitoring?
A VM can be running while the application inside it stopped answering. A node can have memory to spare while the shared storage underneath it is degraded. A Proxmox Backup Server can be reachable while a critical VM has not had a successful backup in a week. None of those show up if you only watch one layer.
Proxmox monitoring is the practice of watching all of them at once, so that you learn about a cluster incident before your users do, understand what it is doing to the guests, and get the right person notified. The tools below differ mostly in which layers they see natively and what you have to add to cover the rest. For monitoring beyond the hypervisor, see our guide to the best infrastructure monitoring tools.
The six layers a Proxmox setup needs watched
| Layer | Questions it must answer |
|---|---|
| Cluster and hypervisors | Does the cluster have quorum? Which nodes are unavailable? Do the resources and the storage allow it to keep running? |
| VMs and LXC containers | Which guests are stopped? Which ones saturate CPU, memory, disk or network? Are new guests discovered without anyone registering them? |
| Guest OS and applications | Is the filesystem full? Is the service or the database running? Does the application actually respond? |
| Tasks and scheduled jobs | Do Proxmox operations finish cleanly? Do scheduled jobs start, and do they produce their result on time? |
| Backups | Does every critical VM have a recent backup? Did the off-site copies and the verifications succeed? Has a restore ever been tested? |
| Availability from outside | Can users reach the service? Will anyone be alerted if the whole cluster, or its network, goes away? |
What Proxmox already gives you
Proxmox VE ships resource graphs and event notifications, notably for backups, fencing and replication. Proxmox Backup Server has its own notifications for verification, sync, prune and garbage collection. What an extra tool adds is metric rules with durations, consolidation across clusters, history, diagnosis context and, above all, a watcher that does not live inside the thing it watches. A comparison that says Proxmox cannot alert at all has not read the PVE notification docs or the PBS ones.
Key criteria to evaluate:
- • Real Proxmox coverage - Official API, exporter, community plugin, local agent, or plain Linux monitoring dressed up? Name the component that actually collects.
- • Cluster and inventory - Quorum, nodes, QEMU VMs, LXC containers, discovery, several clusters, identity kept across a migration, and an expected state per guest.
- • Storage depth, in three levels - PVE storage capacity, ZFS / Ceph / SMART / RAID health, and used space inside the guest OS. A single "storage: yes" hides too much.
- • Tasks, backups and jobs - Compare separately PVE task results, backup coverage and freshness, PBS jobs, and heartbeat monitoring of scheduled scripts. Distinguish a run that never happened, an explicit failure, and a run that overran.
- • Useful alerts - Bundled rules, thresholds with a duration, maintenance windows, deduplication, routing, escalation, acknowledgement, and what happens when data goes missing.
- • Monitoring resilience - What happens to collection when the queried node dies? Does the alert engine depend on the cluster it watches? How is a silent collector detected?
- • Deployment and operations - Permissions, network access, hosting, updates, metric storage, retention and the granularity it keeps. Comparative "install time" figures were deliberately not invented.
- • Cost for the same scope - Hosts, agents, discovered guests, services, sensors, series or ingestion: name the unit and the extras.
- • MSP needs - Customer separation, access rights and alert destinations. A multi-cluster view does not prove multi-tenant isolation; check that separately per platform.
This grid is how the tool sections below were assessed. Where a capability could not be confirmed in the documentation, it is marked "not established in the integration examined", never "impossible".
The alerts that make the criteria concrete
Check that the integration you pick can raise these, and how: on a signal, after a duration, with a maintenance window, to a named recipient, and with a clean return to normal.
- • Quorum lost, or a node that became unavailable.
- • A production VM stopped while its expected state is "running", excluding templates and guests that are meant to be off.
- • A storage that went inactive, or a free-space reserve that is too small given how fast it is growing.
- • A degraded ZFS pool, a disk failing SMART, or a Ceph incident that matters to the workloads.
- • Sustained CPU or memory saturation, or degraded disk performance, with a duration and context rather than one universal instant threshold.
- • A critical VM whose last backup is older than its protection objective, a failed job, or a verification in error.
- • A Proxmox task that failed or ran abnormally long, keeping the node, the guest and the final result for diagnosis.
- • A scheduled job with no success confirmation by its deadline: a database dump, an off-site sync, a periodic maintenance script.
- • An application that is unreachable even though its VM is running.
- • A collector or metric source that has gone silent past its expected window.
These ten scenarios are also the protocol we would use to turn this documentation review into a tested comparison.
The 12 best Proxmox monitoring tools
1. Fivenines
Best for: Managed Proxmox monitoring for teams and MSPs.
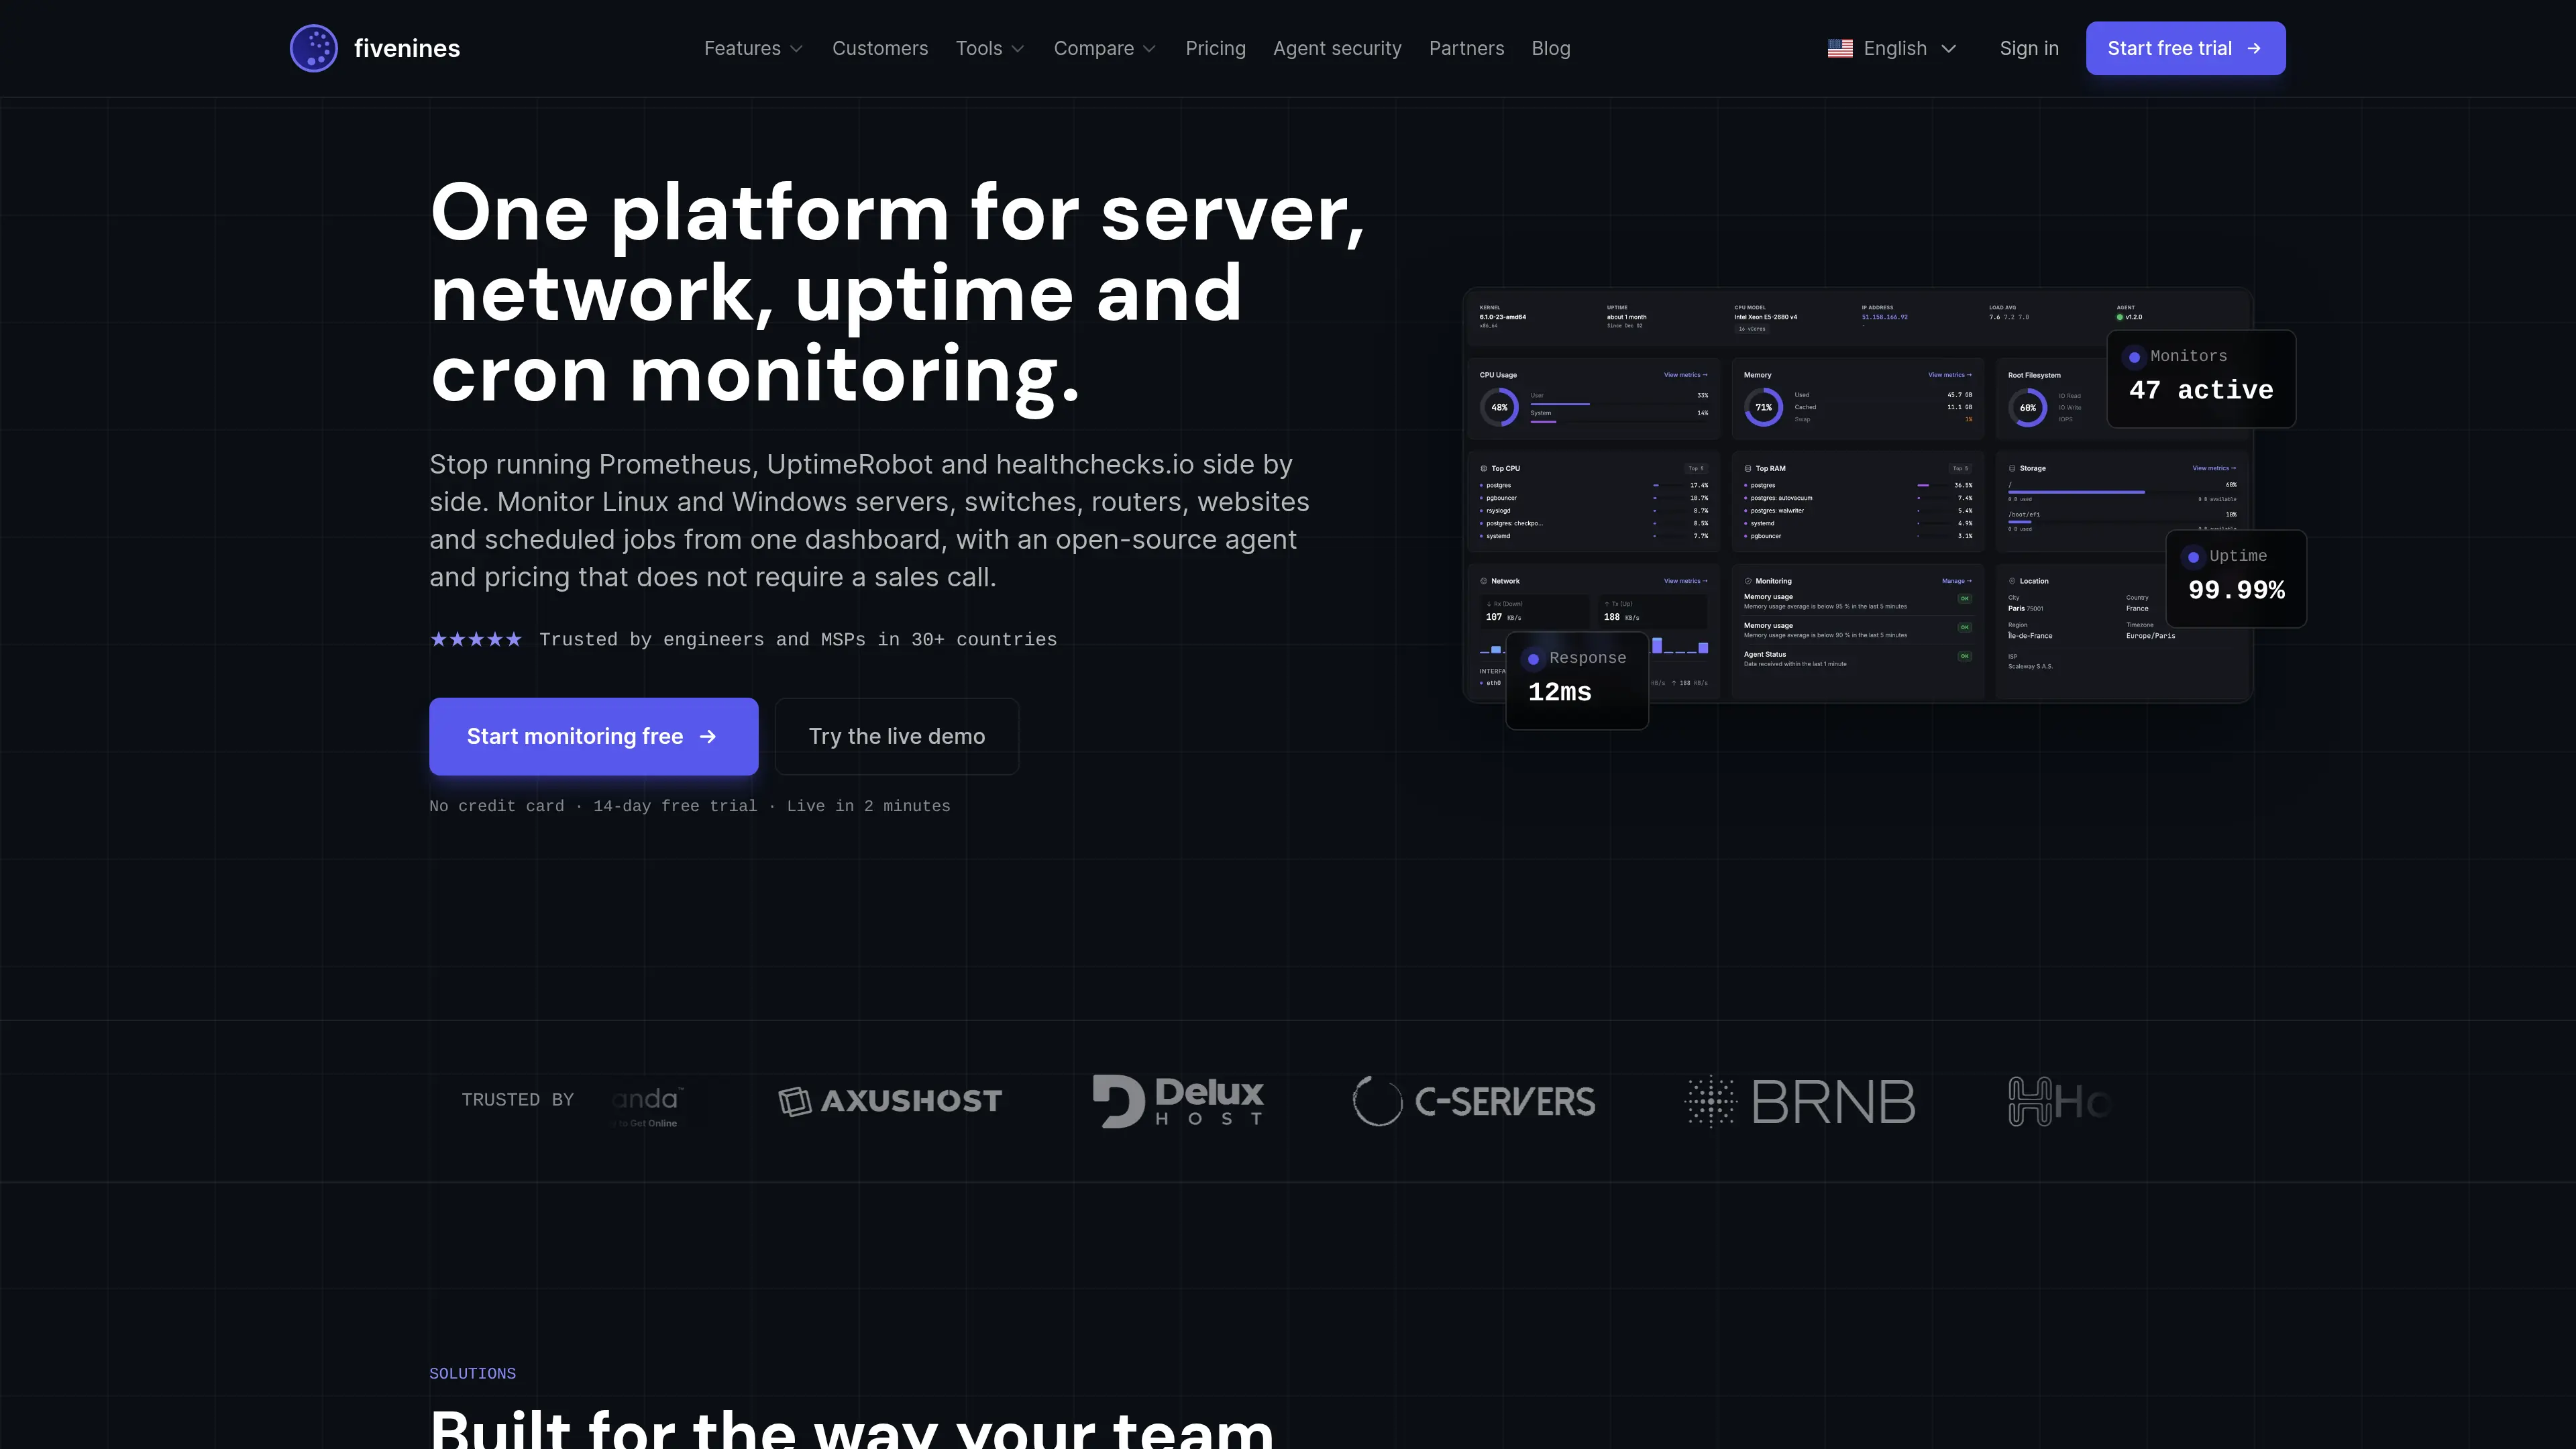
Fivenines monitors a Proxmox cluster through its API with one agent installed on a node. Agents on further nodes act as redundant reporters, so collection survives the loss of the node that was being queried, and the most complete reporter is authoritative at any moment. Clusters, nodes, VMs, LXC containers and storage pools appear on one fleet page across clusters, and every alert names the resource it is about: one incident for a lost quorum, one per node or guest with a problem, never one per reporting node. Incidents follow a guest when it migrates. Read the Proxmox monitoring feature page.
The collector exposes quorum, nodes, QEMU and LXC guests, and the capacity and active state of every storage, and it tells a partial collection apart from a genuinely empty inventory so that a half-configured node never reads as "no guests". Per-guest CPU, memory, disk I/O and network come from the hypervisor, with nothing to install inside the guests; used space inside a guest, and its processes, services and application checks, need an agent in the guest. ZFS and Ceph health come from their own collectors, because pool health cannot be inferred from free space, and SMART plus RAID health are watched on nodes running the agent. The agent talks outbound HTTPS only; optional modules and the permissions they need are enabled per host. Infrastructure services · Agent security model · open-source agent.
Key features:
- • Cluster quorum, node status, running-guest counts and per-node CPU and memory, with reporter failover between agents
- • Per-VM and per-LXC CPU, memory, disk I/O and network, discovered through the API with no registration step
- • Storage from the node: PVE capacity and active state, plus ZFS / Ceph / SMART / RAID health; used space inside a guest needs an agent in the guest, not the hypervisor
- • Alerts that name the cluster, node or guest, built as workflows with rechecks, delays, mute windows and escalation, delivered by email, Slack, Microsoft Teams, Telegram, Discord, Pushover, PagerDuty or webhooks depending on plan
- • Task monitoring for Proxmox backups, PBS jobs and your own scripts: a cron schedule with timezone or a fixed interval, a grace period, an alert when the success ping does not arrive, and a failure URL that carries the reason. PVE and PBS post their own notifications to it, no plugin needed
- • Uptime checks from outside the cluster (HTTPS, TCP, DNS, ICMP), custom dashboards and status pages
- • Proxmox Backup Server monitored as a server (resources, datastore capacity) and through its jobs: verify, sync, prune and garbage collection report to a task via the native webhook target
- • Per-guest backup freshness read by the agent on a PVE node: each guest's last successful backup and its age across every storage the node can see, an alert when a critical guest passes its maximum backup age, and a flag for any guest in no backup job
Tasks, backups and jobs:
Two layers, not one. The agent on a PVE node reads each guest's most recent backup and its age directly, so a critical VM past its maximum backup age - or with no successful backup at all - alerts on its own, no webhook required, and a guest in no backup job is flagged as well. For the job results themselves, Proxmox VE and Proxmox Backup Server send their own notifications to a Fivenines task through their built-in webhook target: success to the task's ping URL, failure to its /fail URL with Proxmox's own message as the reason. A failed vzdump backup, or a PBS verify, sync, prune or garbage-collection run that errors, turns the task Failed; a Task Failed workflow opens an incident carrying the reason, and the next successful run resolves it. Give each result you want to alert on its own task, because a task holds one state: any success ping clears a prior failure and resets its clock. A nightly prune sharing a task with a weekly verify hides a missed verify, and a job that runs across several nodes needs one task per node so a success on node B cannot clear node A's failure. Once a task has checked in at least once, a run that then does not arrive within the grace period trips it, which is the alert that matters most. Database dumps, rclone copies and restore-validation scripts use the same two URLs. Each task counts as one monitor.
Pricing: 14-day trial, then Starter €19/mo (€15/mo billed annually) with 15 monitors, Pro €49/mo (€40/mo billed annually) with 50 monitors, Business €99/mo (€79/mo billed annually) with 100 monitors. Enterprise holds 300 monitors (contact us). Alert channels depend on the plan.
What counts: VMs and LXC containers discovered through the Proxmox API do not count as monitors. Each monitor you add counts once, such as a server running the agent, an uptime check, a task monitor or a network device. See the worked example below.
Pros:
- • Cluster-scoped alerts: one incident per problem, named for the node or guest, surviving migrations
- • Discovered guests are included in the price, so the bill does not grow with every VM
- • Proxmox, guest services, uptime checks and scheduled jobs in one managed platform, no server to run
- • Reporter redundancy keeps collecting when the queried node is the one that died
- • PVE and PBS notifications land as tasks and incidents with the failure reason, no plugin or exporter needed
- • Per-guest backup freshness read from the cluster, so a VM with no recent backup pages even when no job reported a failure
Cons:
- • No free tier: paid plans start at €19/mo after the 14-day trial
- • PVE replication status and Proxmox Mail Gateway are not covered
2. Pulse
Best for: Self-hosted Proxmox-focused monitoring.
Pulse is the Proxmox specialist in this list. It reads the Proxmox API for PVE, PBS and PMG: nodes, VMs and LXC containers, storage, replication and backups. On the PBS side it covers datastores and tracks jobs and verification. An optional agent adds hardware visibility on the host. Community is MIT-licensed; the Pro features are commercial.
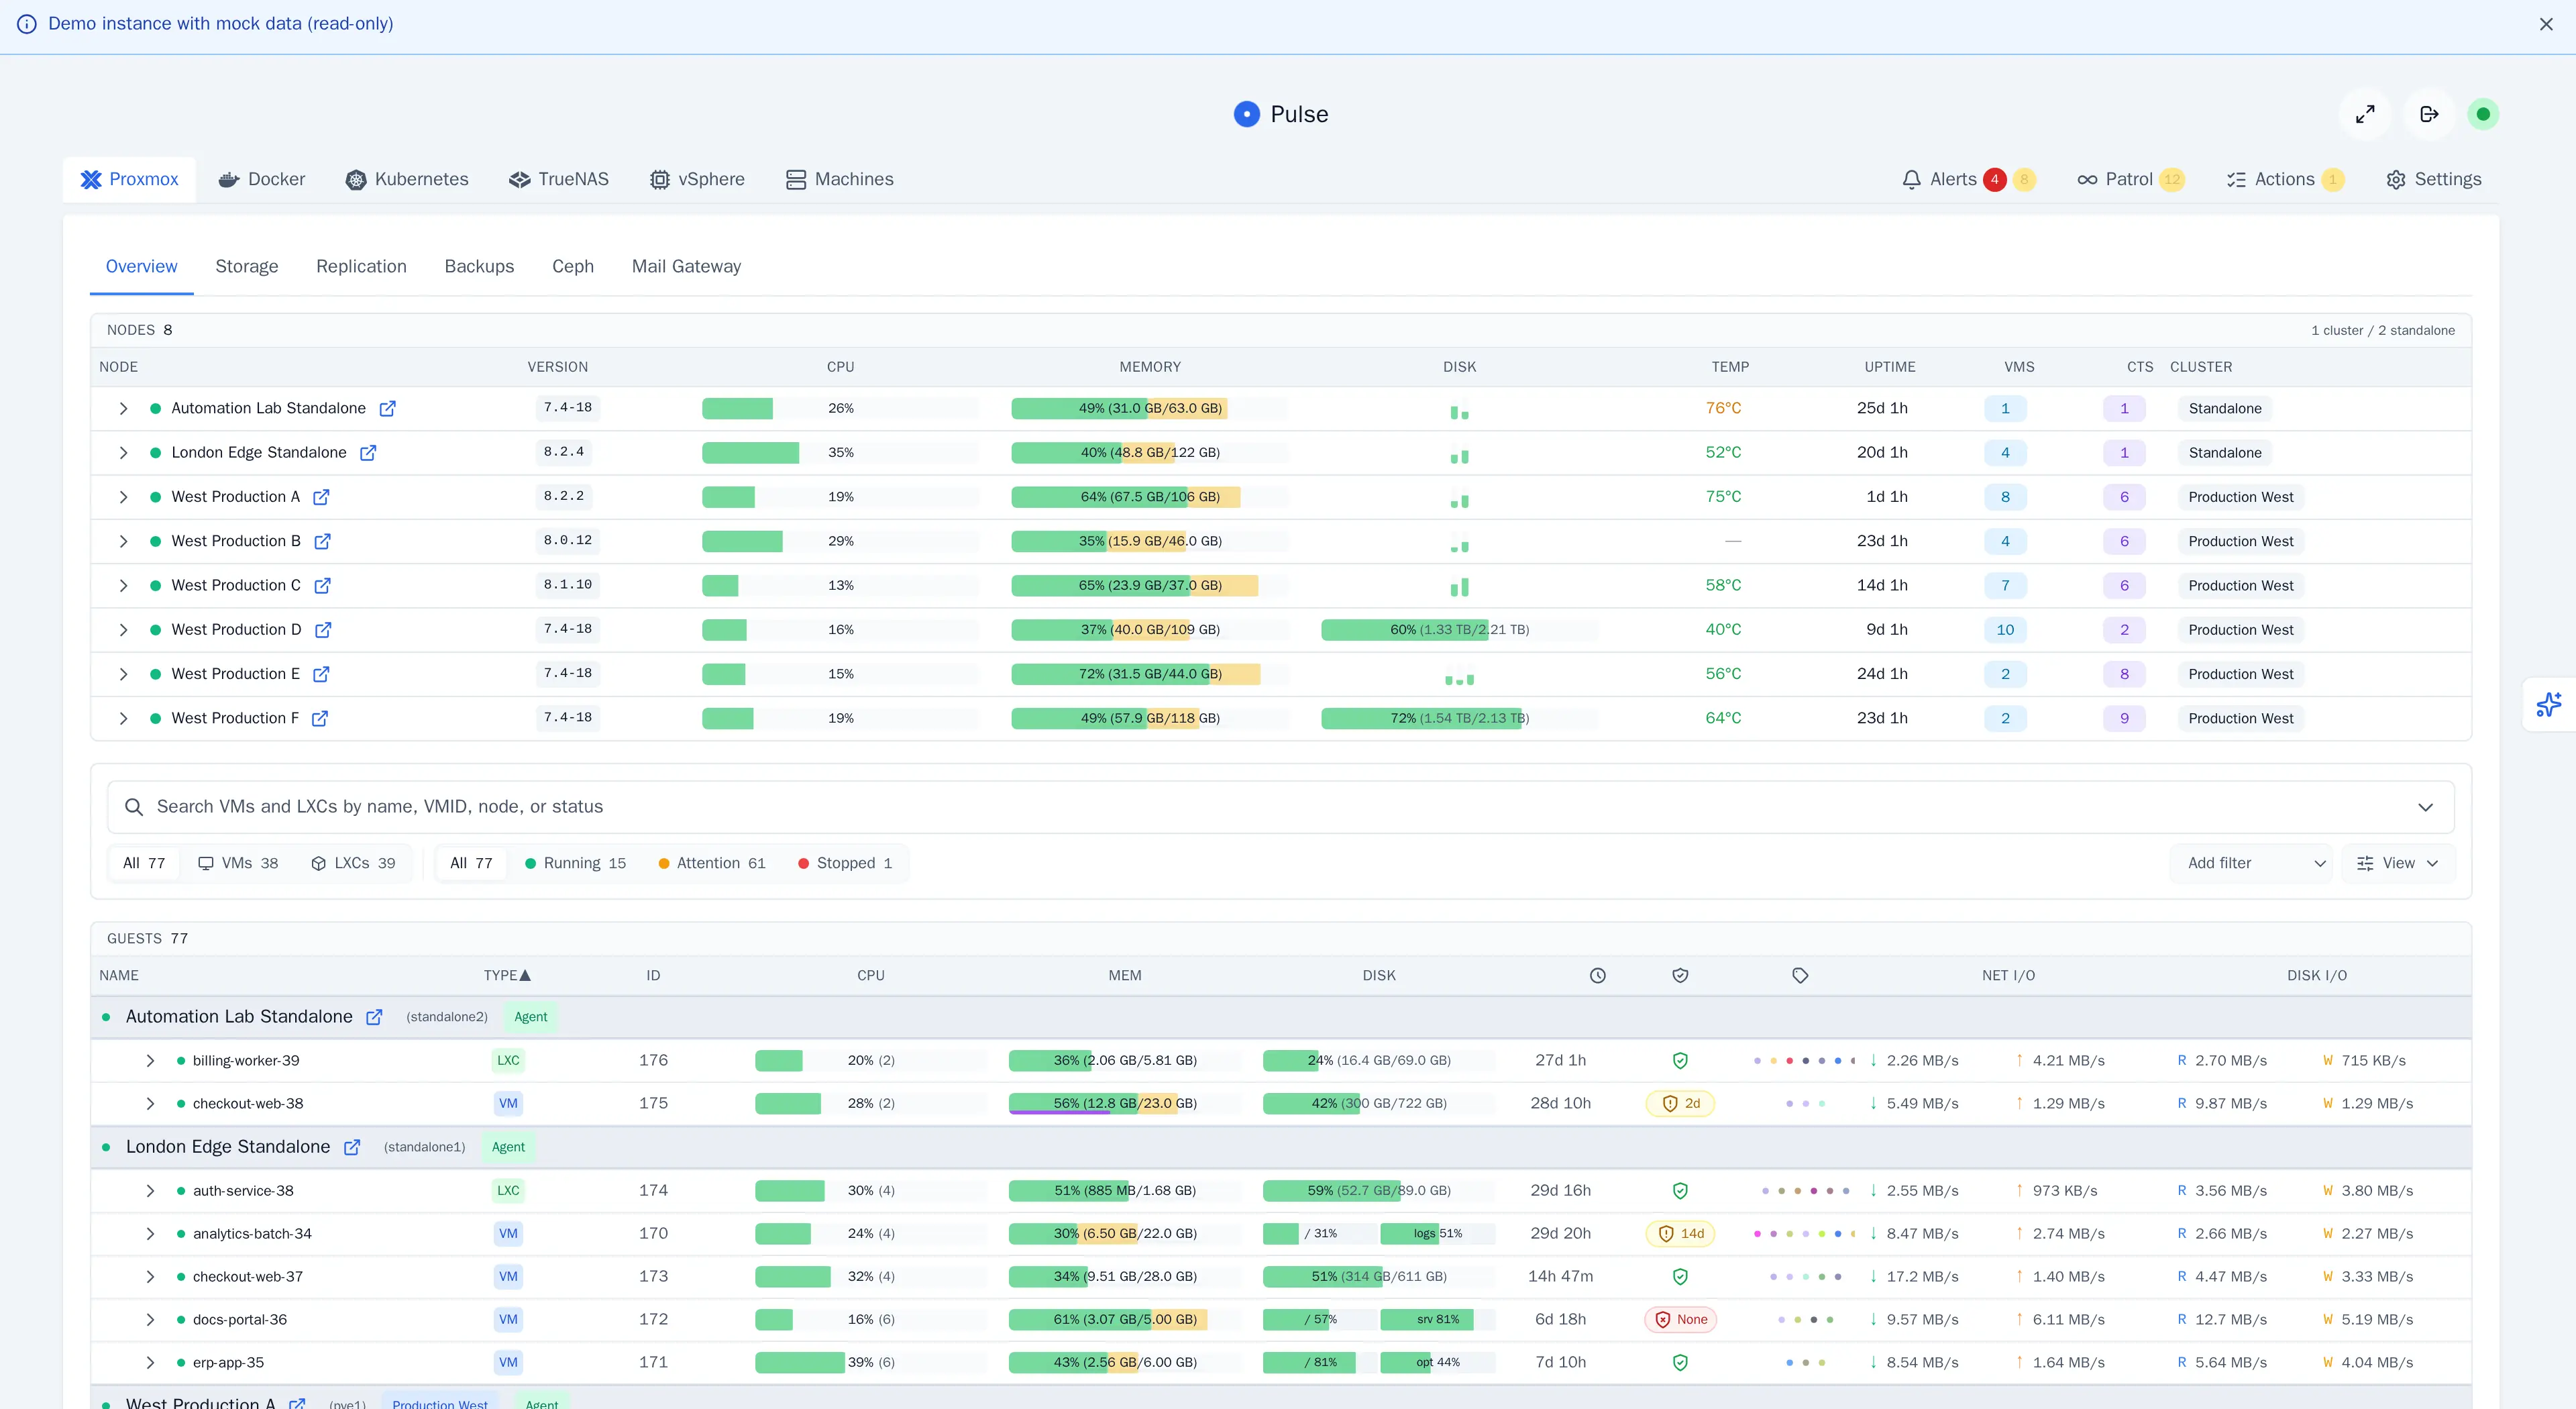
Pricing: Community free with 7 days of metric history; Relay $39/year or $4.99/month with 14 days; Pro $79/year or $8.99/month with 90 days. The self-hosted edition has no paid cap on the number of systems. A hosted Pulse Cloud is described in the documentation but not presented as generally available, so it is not treated as a SaaS option here.
Pros:
- • Built for Proxmox: PVE, PBS and PMG in one tool
- • Backup and PBS job coverage that most generalists lack
- • Alerts included, low licence cost, MIT community edition
Cons:
- • You host, update and back up the monitoring server yourself
- • Used space inside a VM depends on the QEMU Guest Agent and its permissions (see the VM disk monitoring doc)
- • No external synthetic uptime checks (HTTPS/TCP/DNS from outside), and short history on the free tier
3. Zabbix
Best for: Open-source monitoring with an official Proxmox template.
Zabbix ships an official "Proxmox VE by HTTP" template that works with an API token and low-level discovery. The 7.4 template documents nodes, QEMU and LXC guests, storage, quorum, SMART and some guest information through the QEMU Guest Agent, and it comes with triggers. The tested PVE version it lists is 8.4.0, which does not by itself mean it is incompatible with PVE 9. The capabilities of the 7.4 template should not be attributed to older templates.
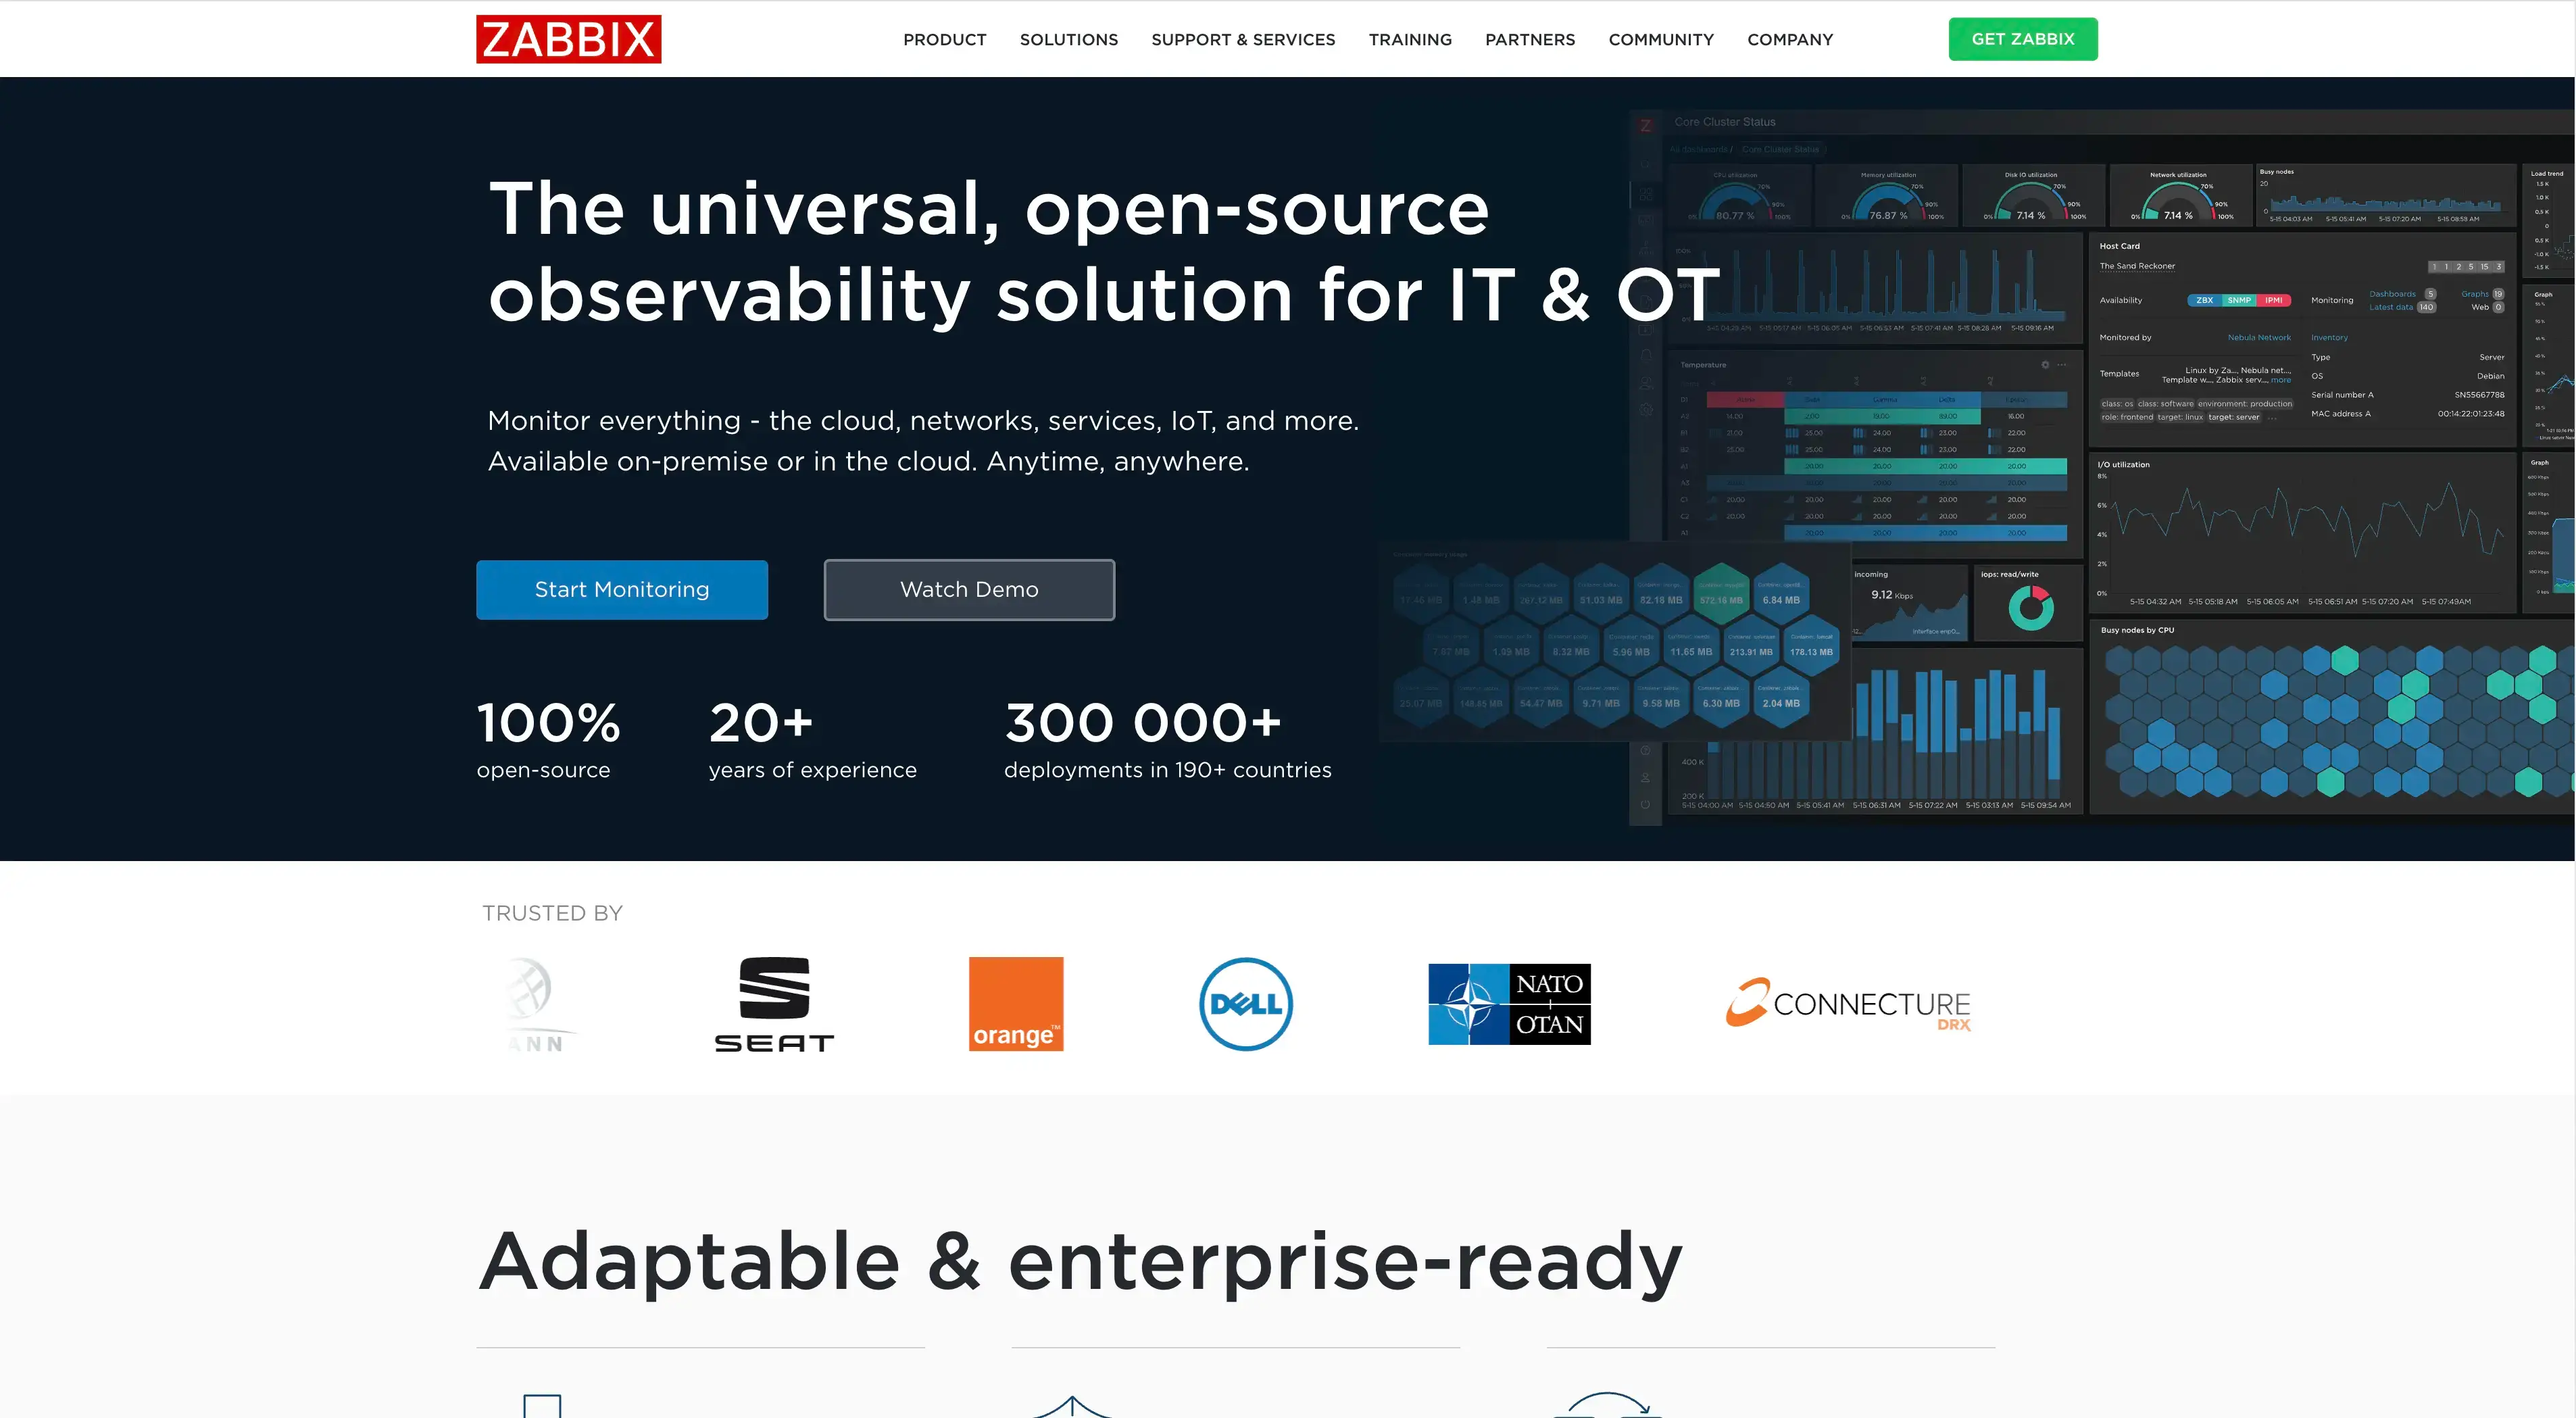
Pricing: Free software, AGPLv3 from Zabbix 7 onwards. Hosting, and commercial support if you want it, are extra.
Pros:
- • Detailed, maintained official template with triggers
- • Alerting, escalation and customisation of a mature platform
- • Same tool for the rest of the estate
Cons:
- • A server and a database to operate
- • Coverage varies with the template version and the permissions you grant
- • PBS tracking not established in the template examined
4. Checkmk
Best for: Proxmox monitoring across a wider IT estate.
Checkmk's official special agent reads the Proxmox API and attributes data to guests through piggyback, with the Linux agent recommended on the nodes themselves. Dedicated checks cover VM and container info, backup status (age and result) and replication. The hosts-and-services model, and the clustering configuration that has to follow guests as they move, is yours to set up.
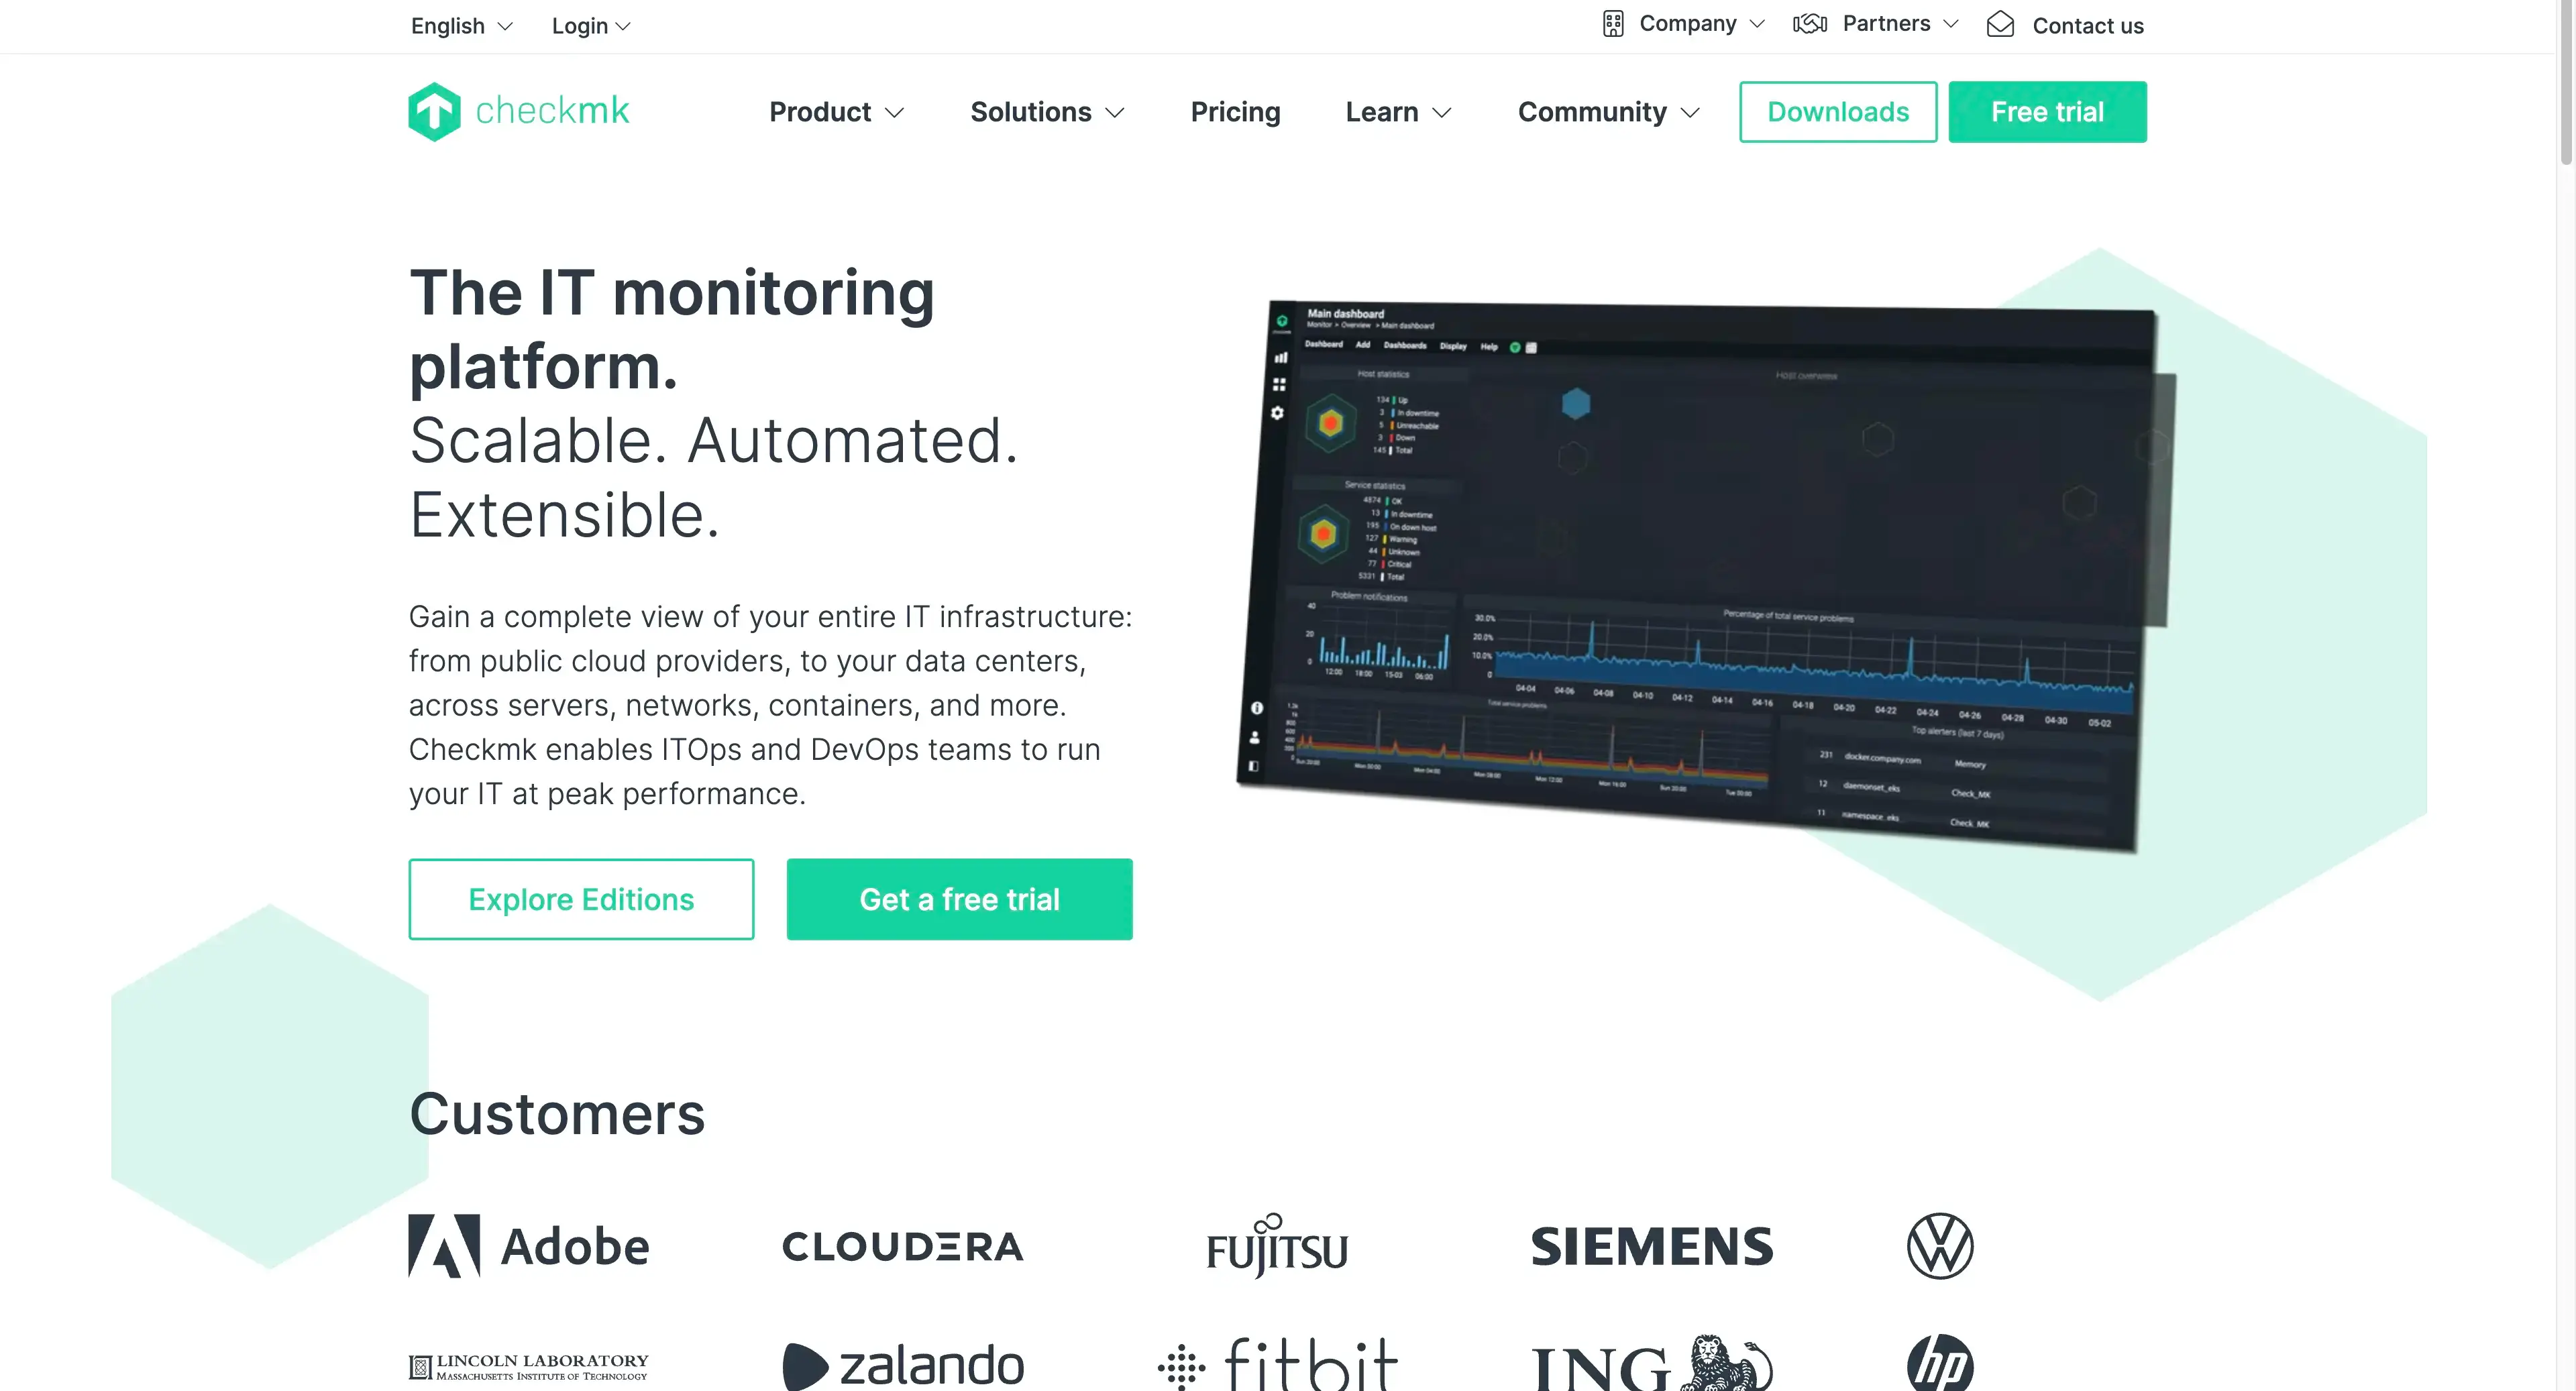
Pricing: Community edition free. Pro from €190/month billed annually. Infrastructure is billed in services; host equivalents are indicative.
Pros:
- • Service discovery and targeted Proxmox checks
- • PVE backup status and replication have their own checks
- • One platform for servers, network and Proxmox
Cons:
- • Hosts, services and piggyback to configure and maintain
- • The PVE backup check is not full PBS monitoring; the PBS extension found is community-maintained
- • Service-based billing needs a quote for a real estate
5. Grafana with Prometheus or InfluxDB
Best for: Custom dashboards and an existing metrics stack.
Grafana is the display layer; what you have to install is the collection chain, and there are two different ones.
Architecture A: Prometheus + prometheus-pve-exporter + Grafana. The community exporter queries the PVE API and exposes resources, quorum, HA and replication. Its backup-info collector spots guests that are outside any backup job; it does not validate that backups are recent or restorable. The config collector can issue one request per guest, which matters at scale.
Architecture B: native PVE export to InfluxDB, then Grafana. Each node pushes its own statistics and those of its guests and storages through the built-in external metric server, so no extra agent is needed for that flow. The same documentation mentions Graphite and OpenTelemetry targets; check your PVE version before relying on them. Confirm that the dashboard you import matches your InfluxDB version and query language. Native export.
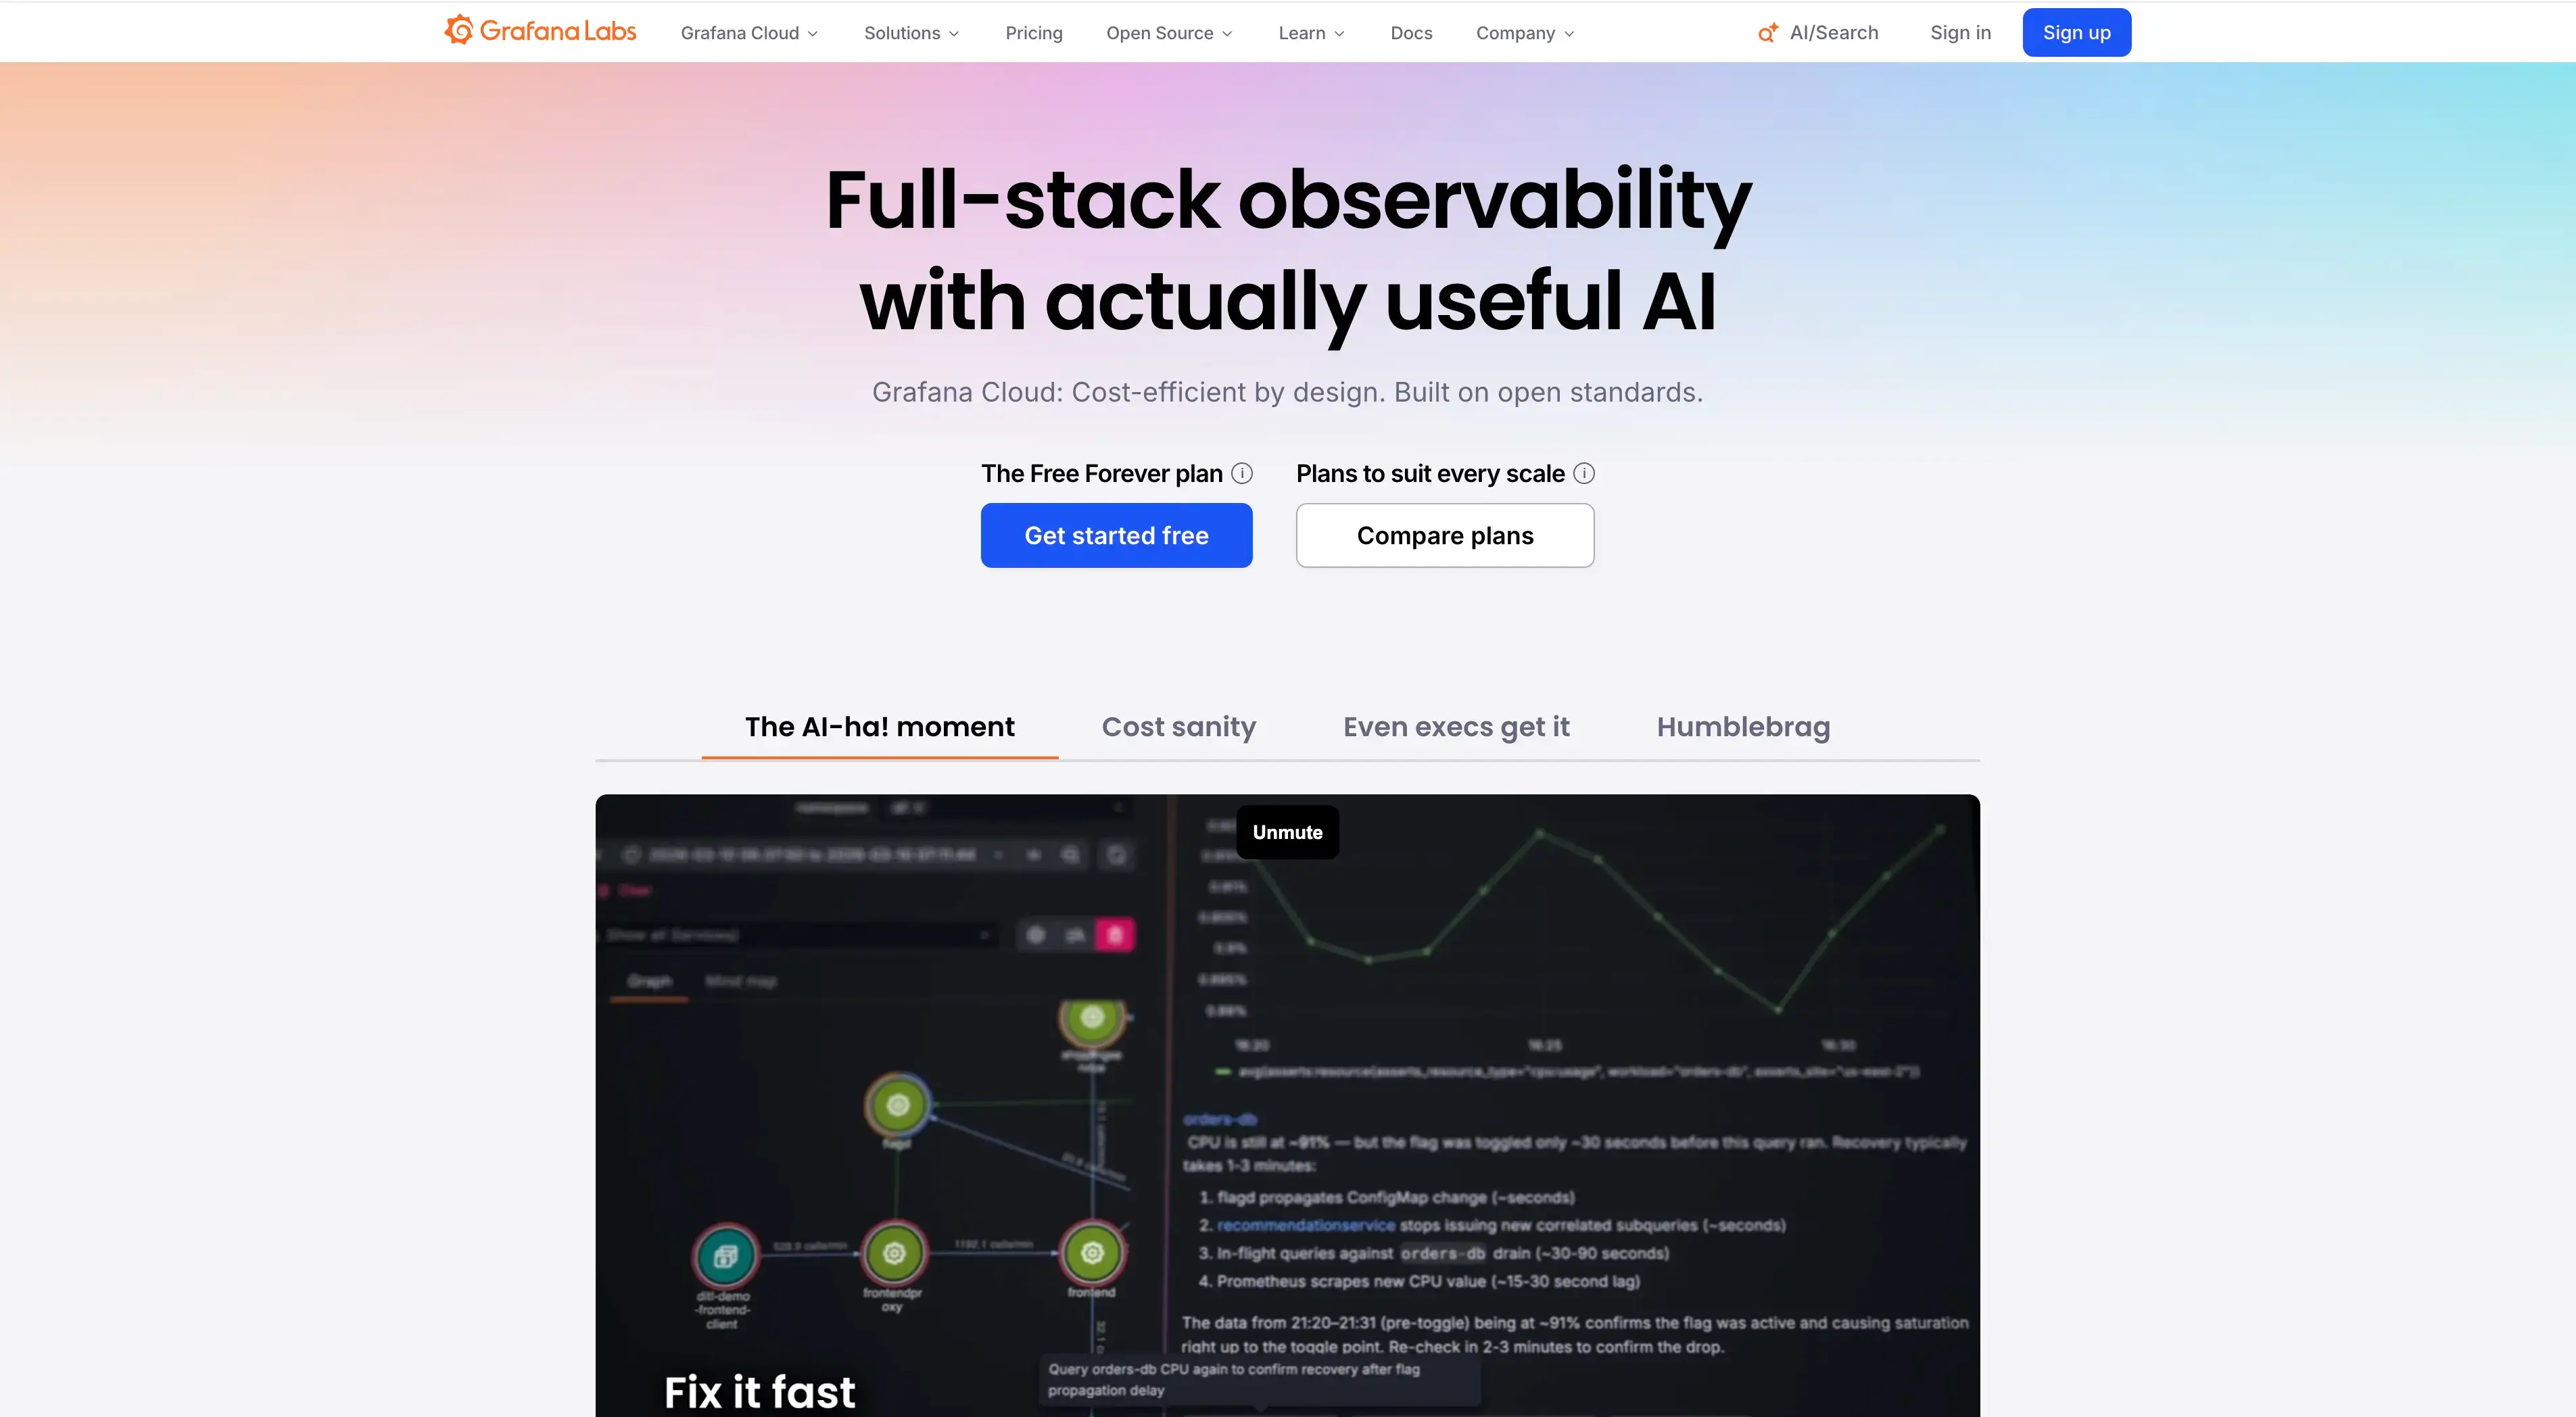
Pricing: The open-source components have no licence fee; count hosting and operations. Managed offers are separate: Grafana Cloud has a free tier and a Pro plan from $19/month plus usage.
Pros:
- • Full control of the data, the queries and the dashboards
- • Reuses a stack many teams already run
- • Architecture B needs no extra agent for the metric flow
Cons:
- • Collection, storage, retention and rules are yours to operate
- • Application data, SMART, Ceph or PBS may need further collectors
- • An imported dashboard installs no alerts: Alertmanager or Grafana Alerting is a separate step
See our Fivenines vs Prometheus comparison → · Fivenines vs Grafana Cloud →
6. Netdata
Best for: High-resolution host and guest performance troubleshooting.
The Netdata agent runs on the PVE host, detects QEMU and LXC guests through cgroups and resolves their Proxmox names, and brings collectors for processes and services, ZFS, SMART and Ceph, each configured for its source. Quorum and HA need the complementary PVE exporter collector, applications inside the guests remain to be instrumented, and PBS needs a specialised complement.
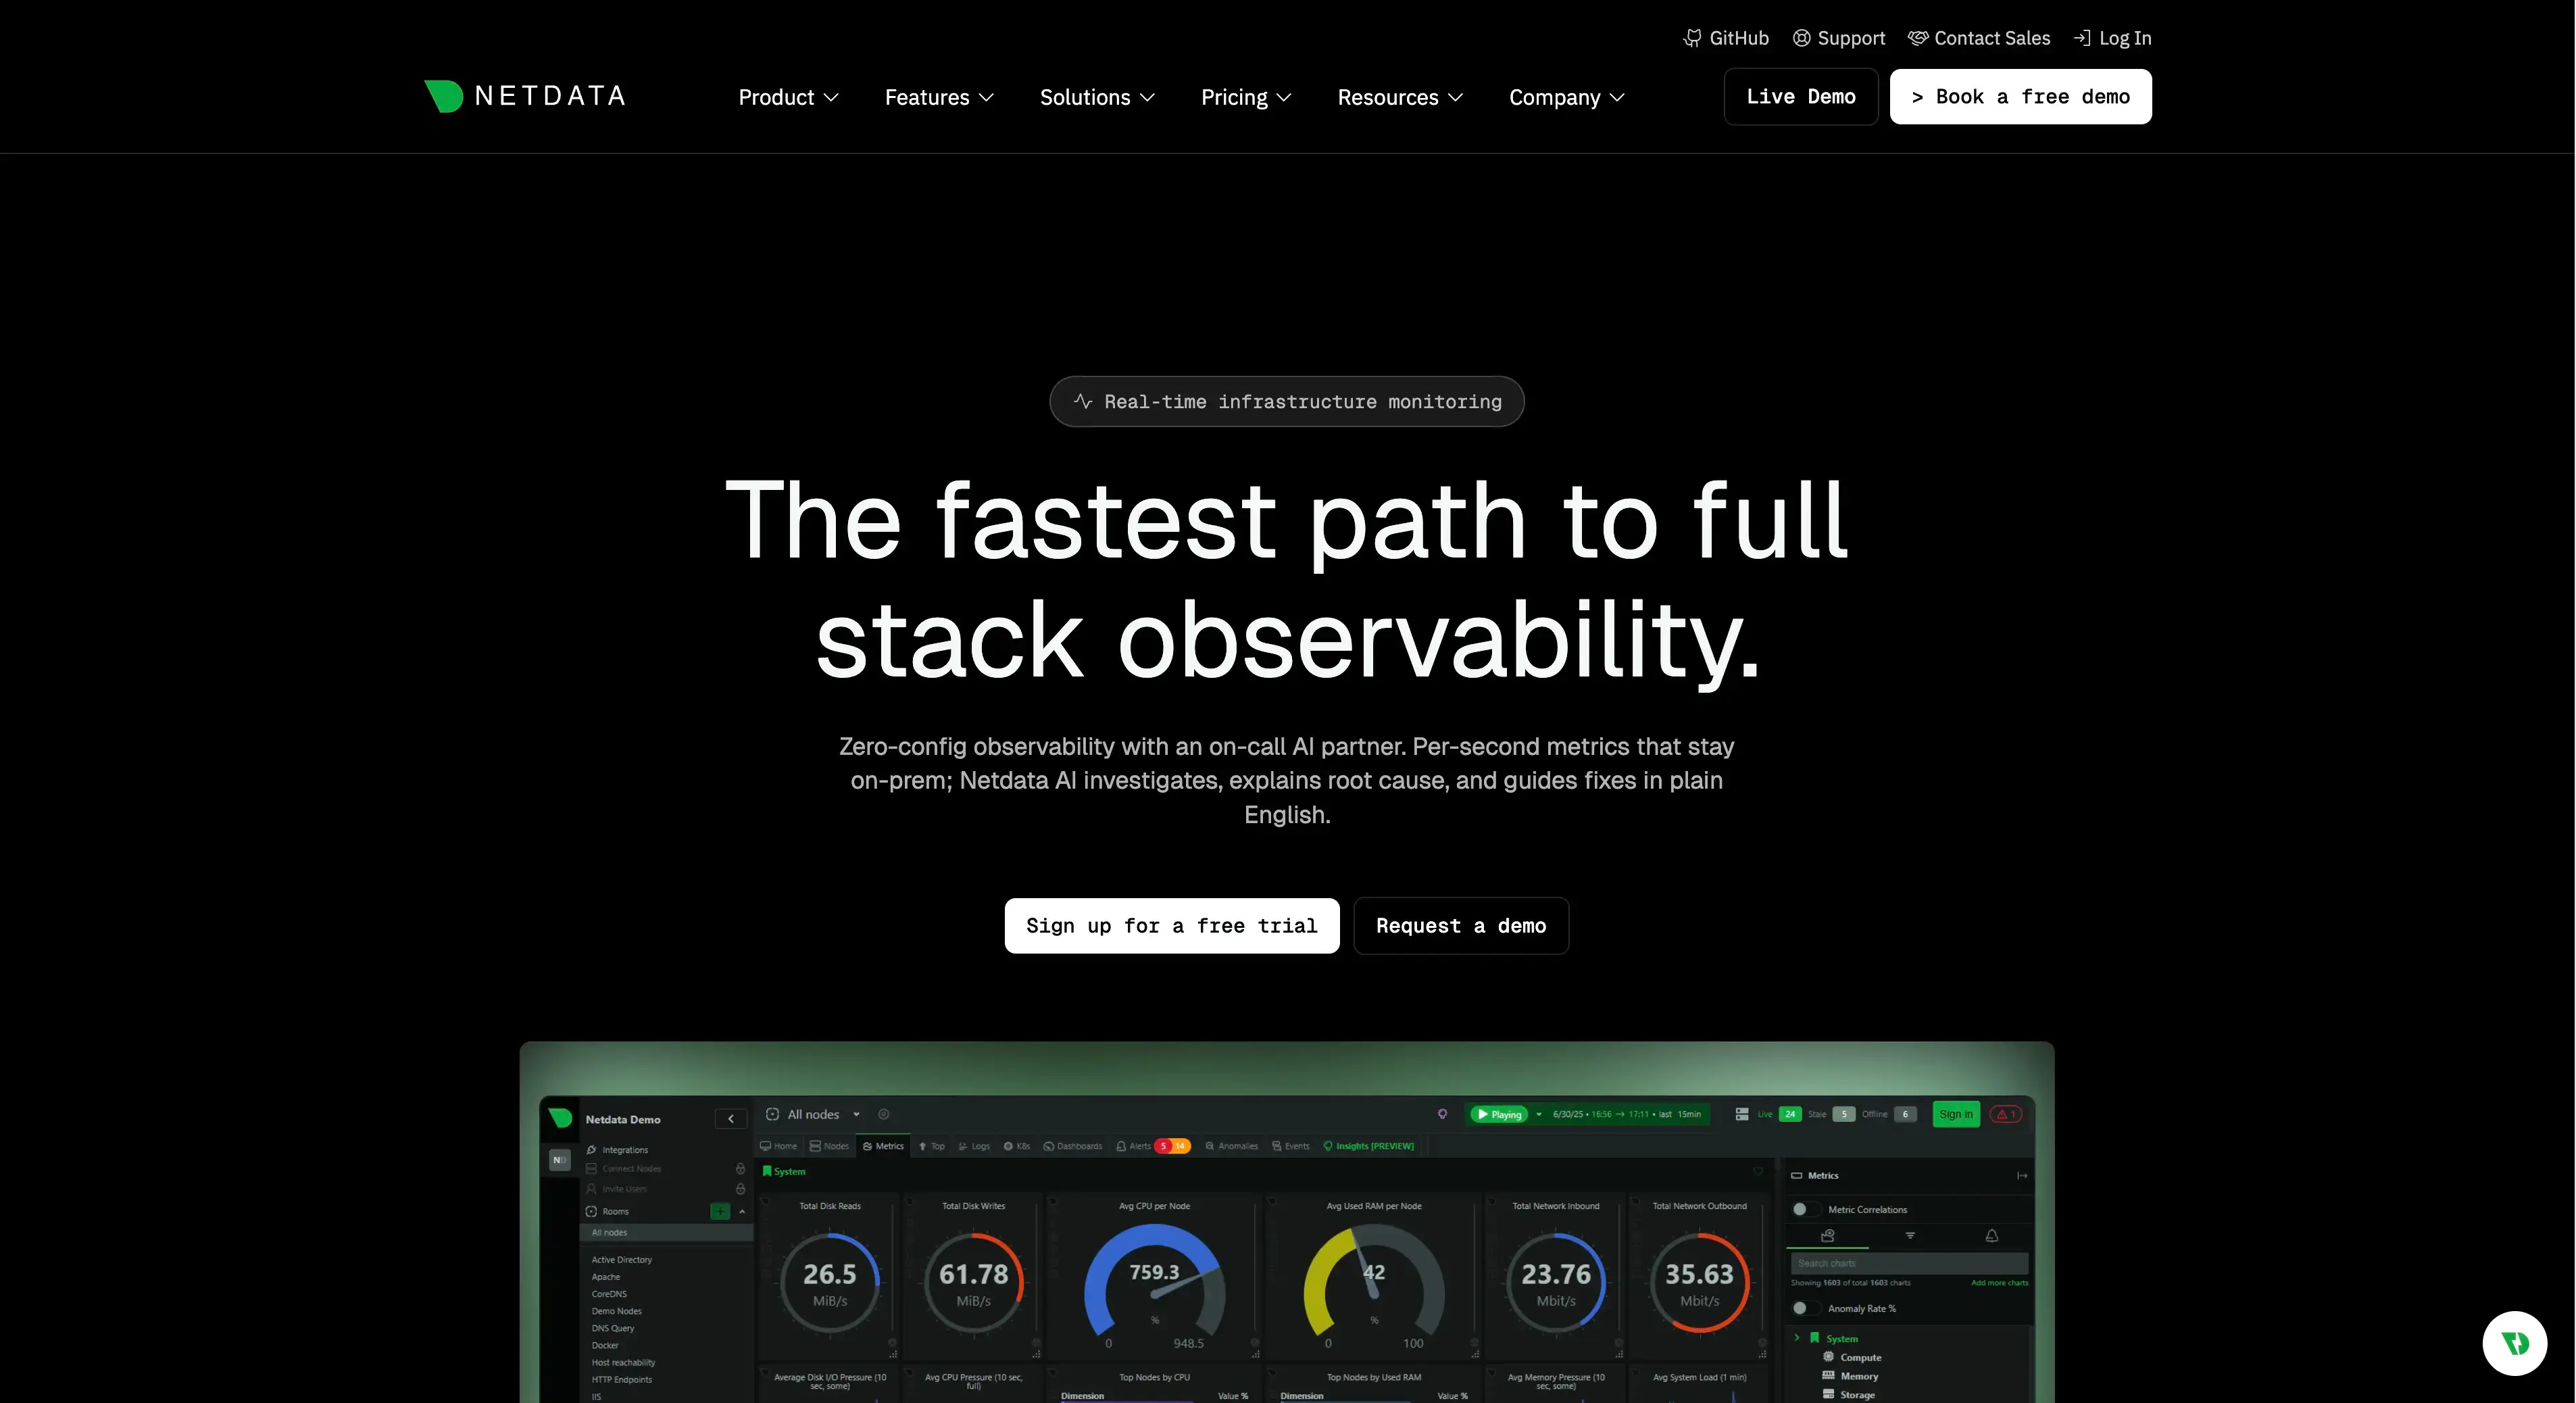
Pricing: Open-source agent free. Netdata Cloud Community covers up to 5 nodes; Business is $4.50 per node/month billed annually; Homelab is $90/year under fair use. Retention depends on the storage you give the agent.
Pros:
- • Per-second granularity and strong system diagnosis
- • Per-guest visibility from the host, no agent in the guest
- • ZFS, SMART and Ceph collectors on the node
Cons:
- • Cluster-level quorum and HA come from the exporter, not the agent
- • Backups and PBS need a complement
- • Per-node cloud pricing, and history bounded by local storage
7. Paessler PRTG
Best for: Proxmox alongside network and datacenter monitoring.
PRTG documents four official Proxmox VE sensors: Virtual Machine Status, Container Status, Node Performance and Cluster Health. The cluster sensor covers quorum, node availability and Ceph state where configured. Older articles that described the node and cluster sensors as "coming" are out of date.
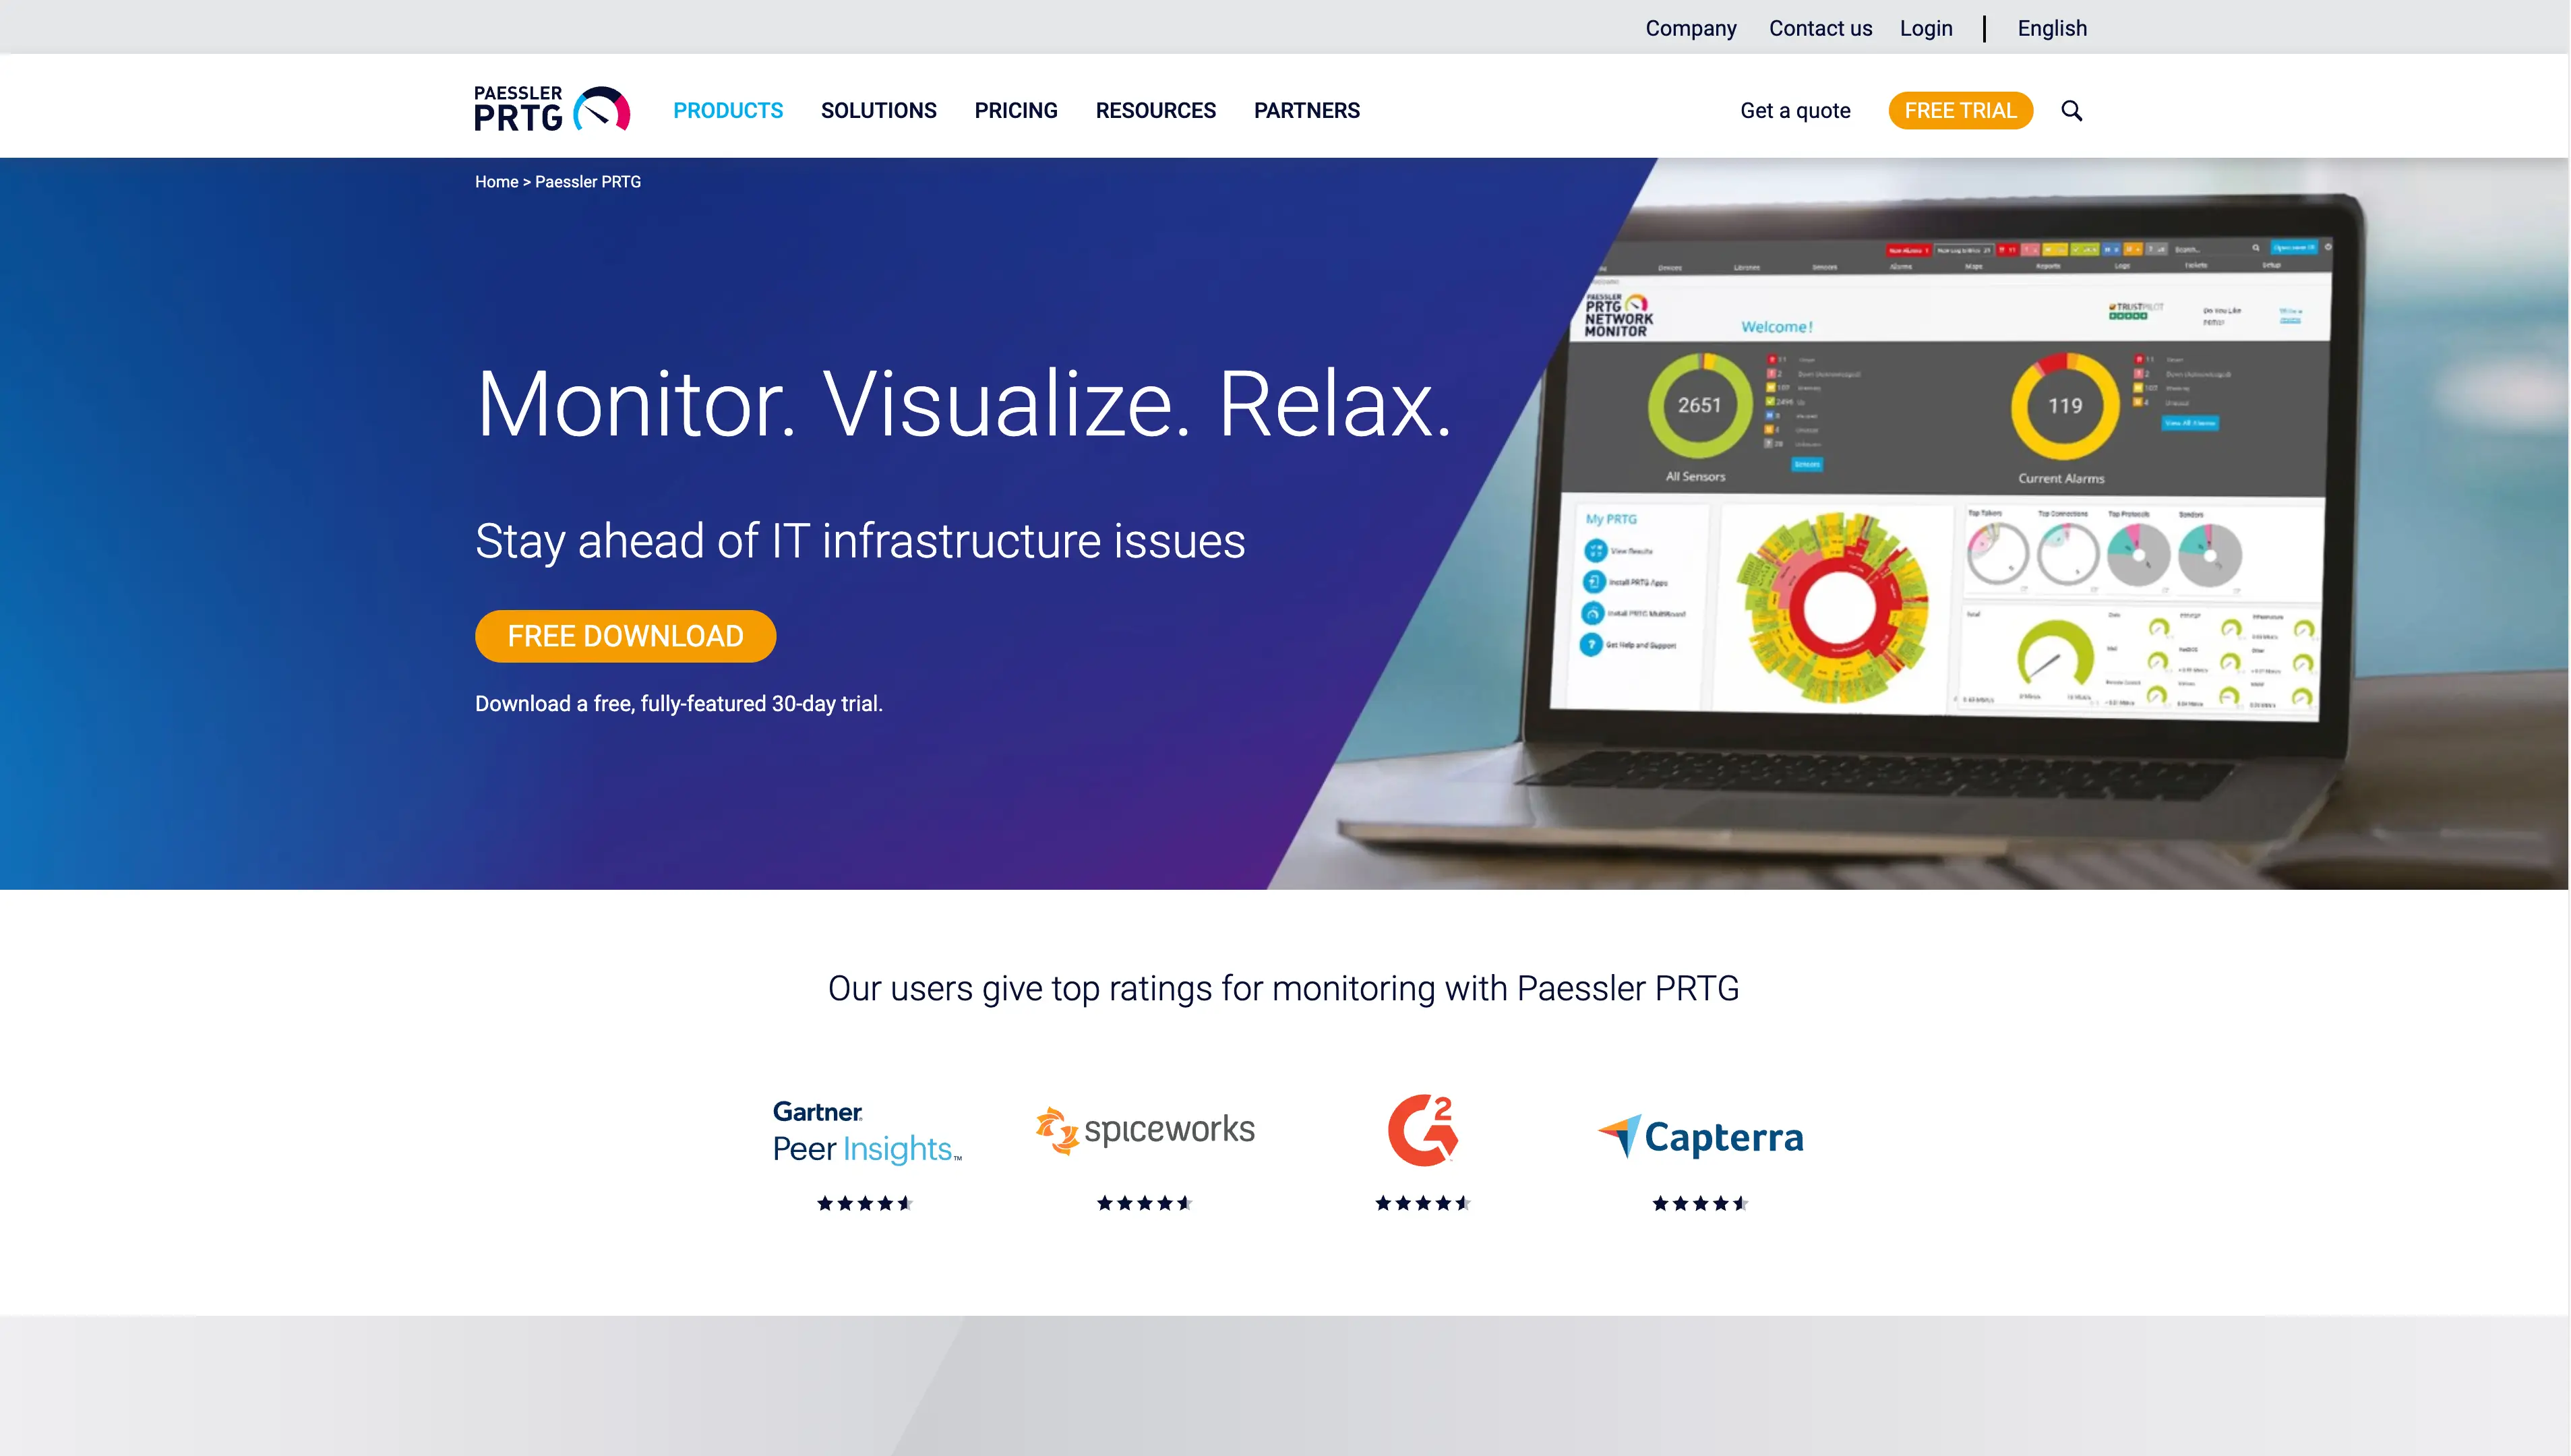
Pricing: Freeware up to 100 sensors. PRTG 500 is $200/month billed annually. A sensor is neither a VM nor necessarily a single metric, so count the sensors your scope needs before comparing.
Pros:
- • Official, documented sensors including cluster health
- • Continuity for a team already running PRTG for the network
- • Free edition for a small lab
Cons:
- • Every extra scope can consume sensors
- • The four sensors do not demonstrate PBS, backup or replication tracking
- • Sensor arithmetic makes a like-for-like quote necessary
8. Datadog
Best for: Teams already using Datadog for infrastructure and applications.
Datadog includes an official Proxmox integration since Agent 7.69.0. It queries the API for nodes, VMs, containers and storage, plus quorum and SDN, and the Agent can be configured on one node to cover the cluster, with journald log collection available. The value is correlating hypervisor data with the application traces and logs already in Datadog.
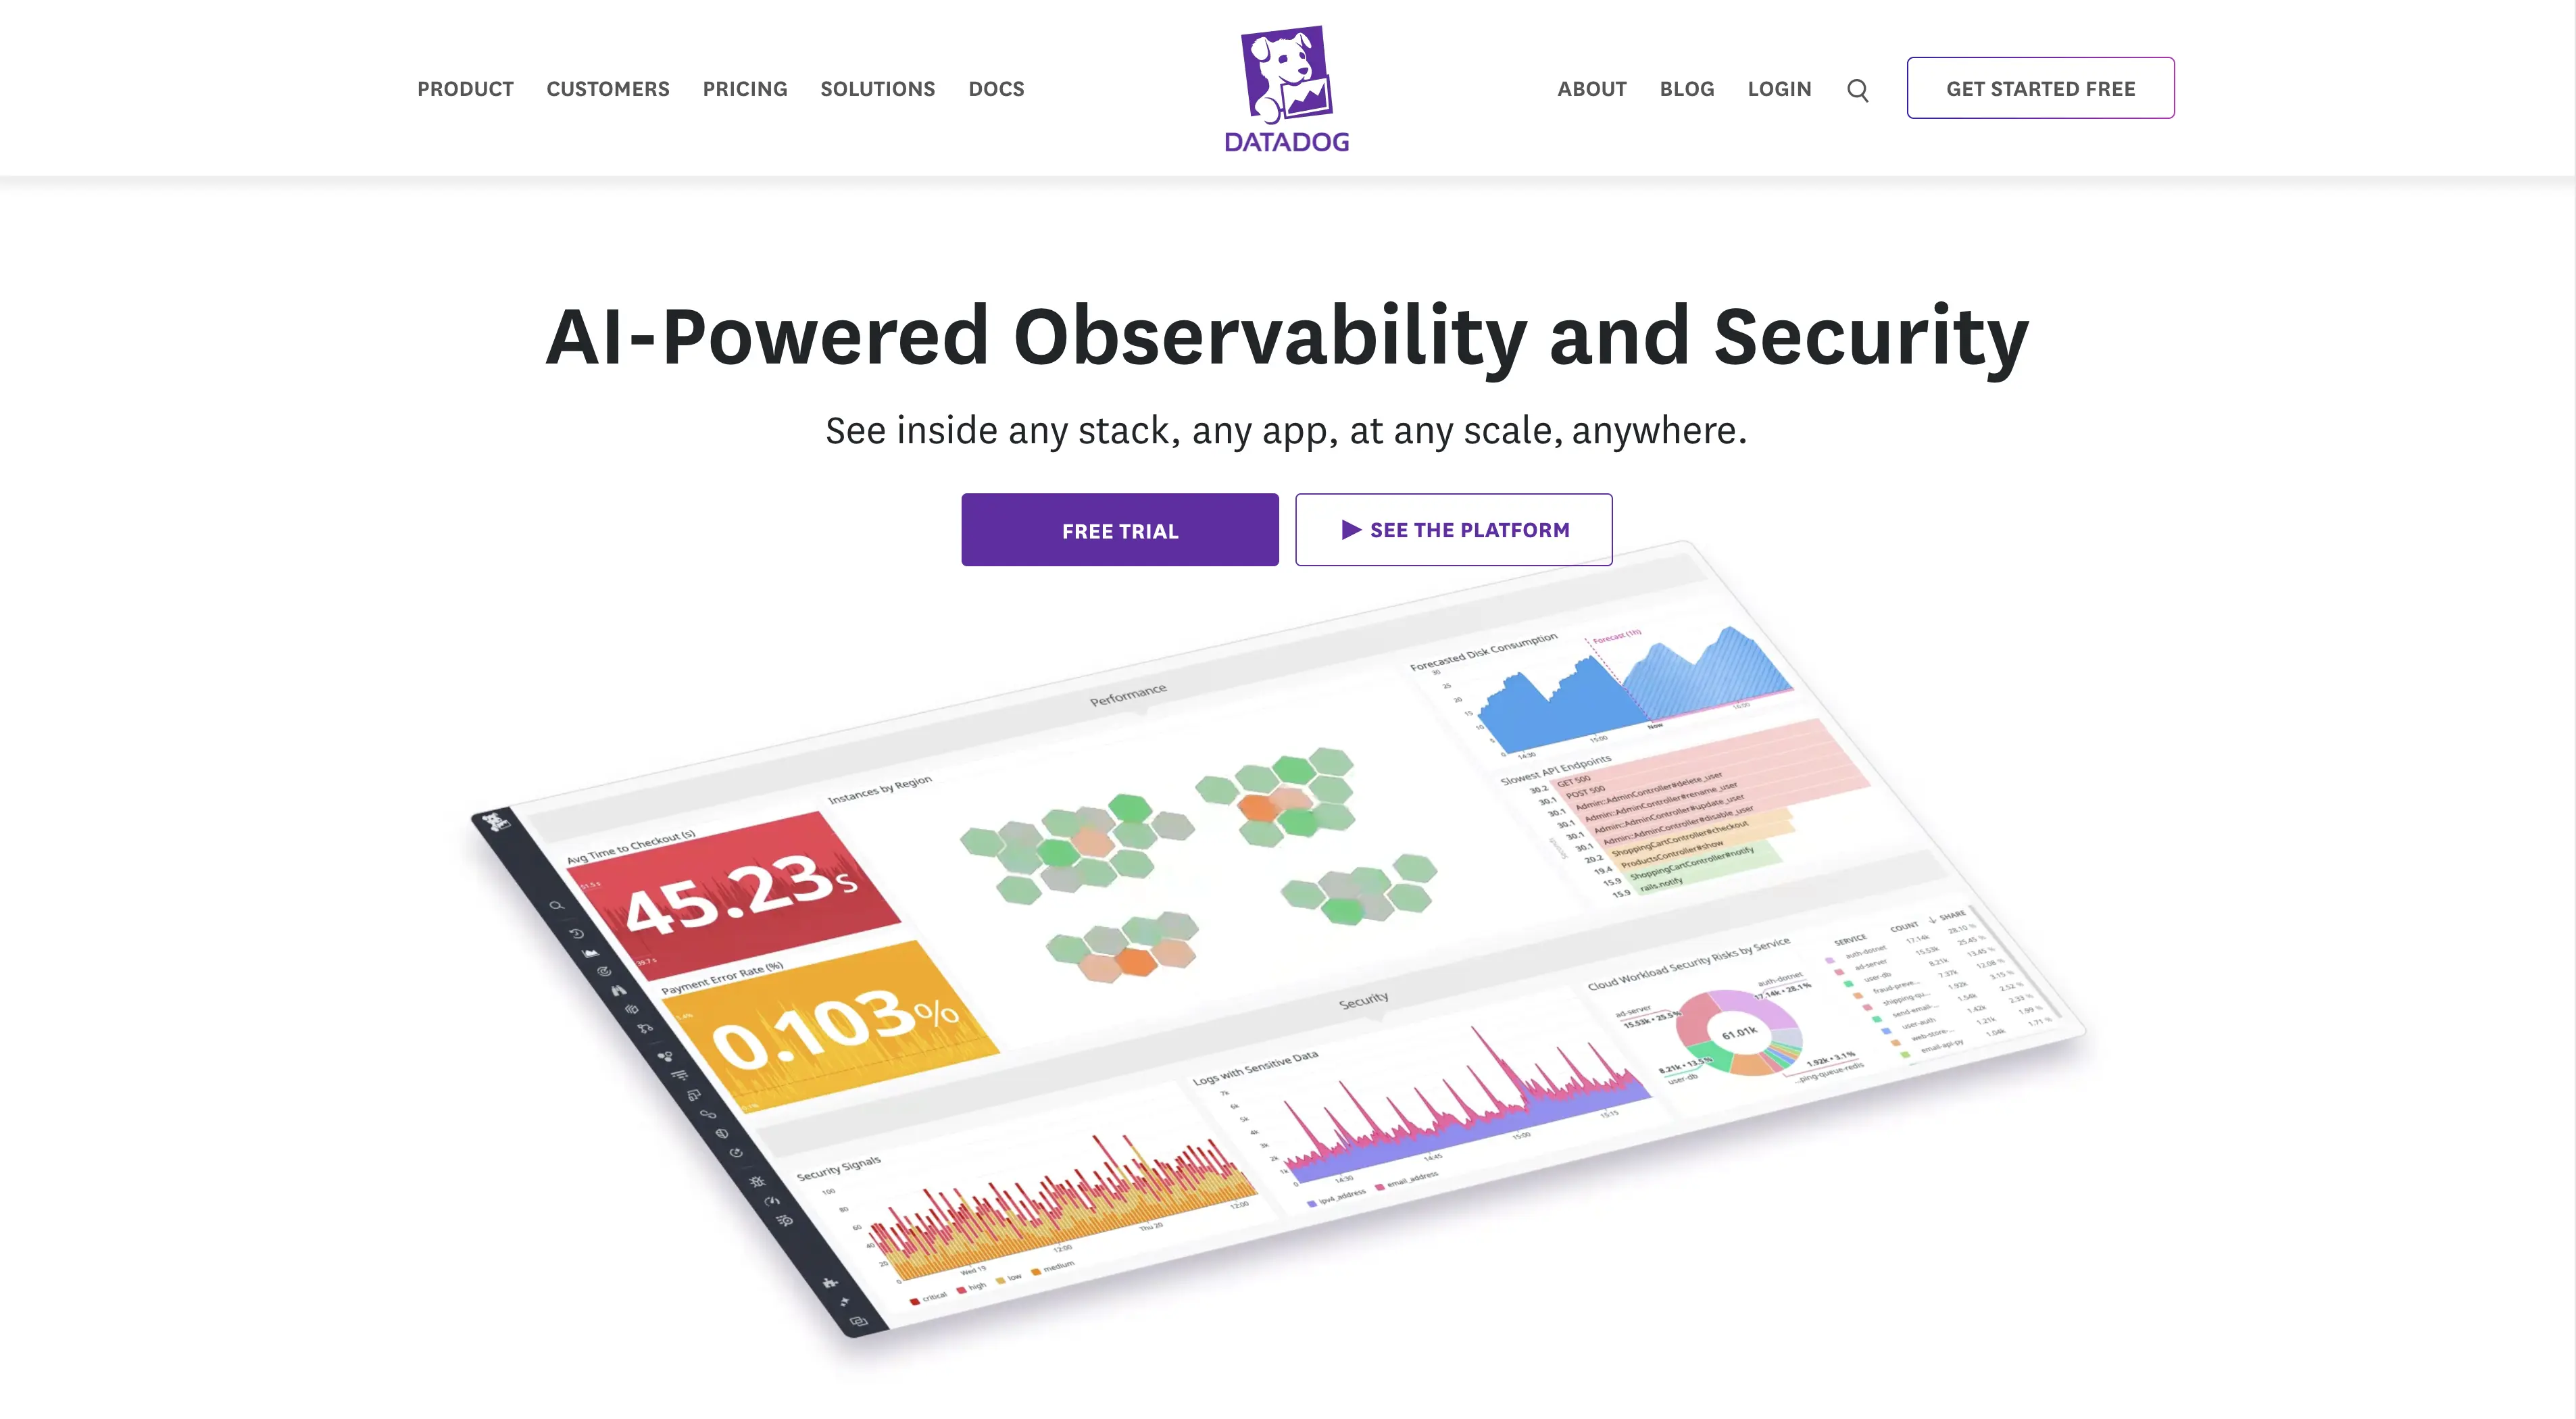
Pricing: Infrastructure Pro $15 per host/month and Enterprise $23 on annual billing; other modules are separate. Do not multiply every guest discovered through the API by $15: how this integration counts billable hosts has to be confirmed with Datadog.
Pros:
- • Hypervisor, OS, application and log data in one place
- • Official integration maintained with the Agent
- • Strong alerting and dashboards
Cons:
- • Guests need instrumenting for their internal detail
- • PBS support not established in the integration examined
- • Modules and consumption add up; get the billing rules in writing
9. ManageEngine OpManager
Best for: Mixed virtualization and network environments.
OpManager's official REST integration discovers the cluster, its nodes, VMs and LXC containers, draws the dependencies between them and tracks state, resources and storage, with thresholds, notifications and workflows from the rest of OpManager. Discovery conditions and guest identification need configuring, and the QEMU Guest Agent helps with IP resolution. Quorum and PBS jobs are not documented in the integration examined and were not added to the table.
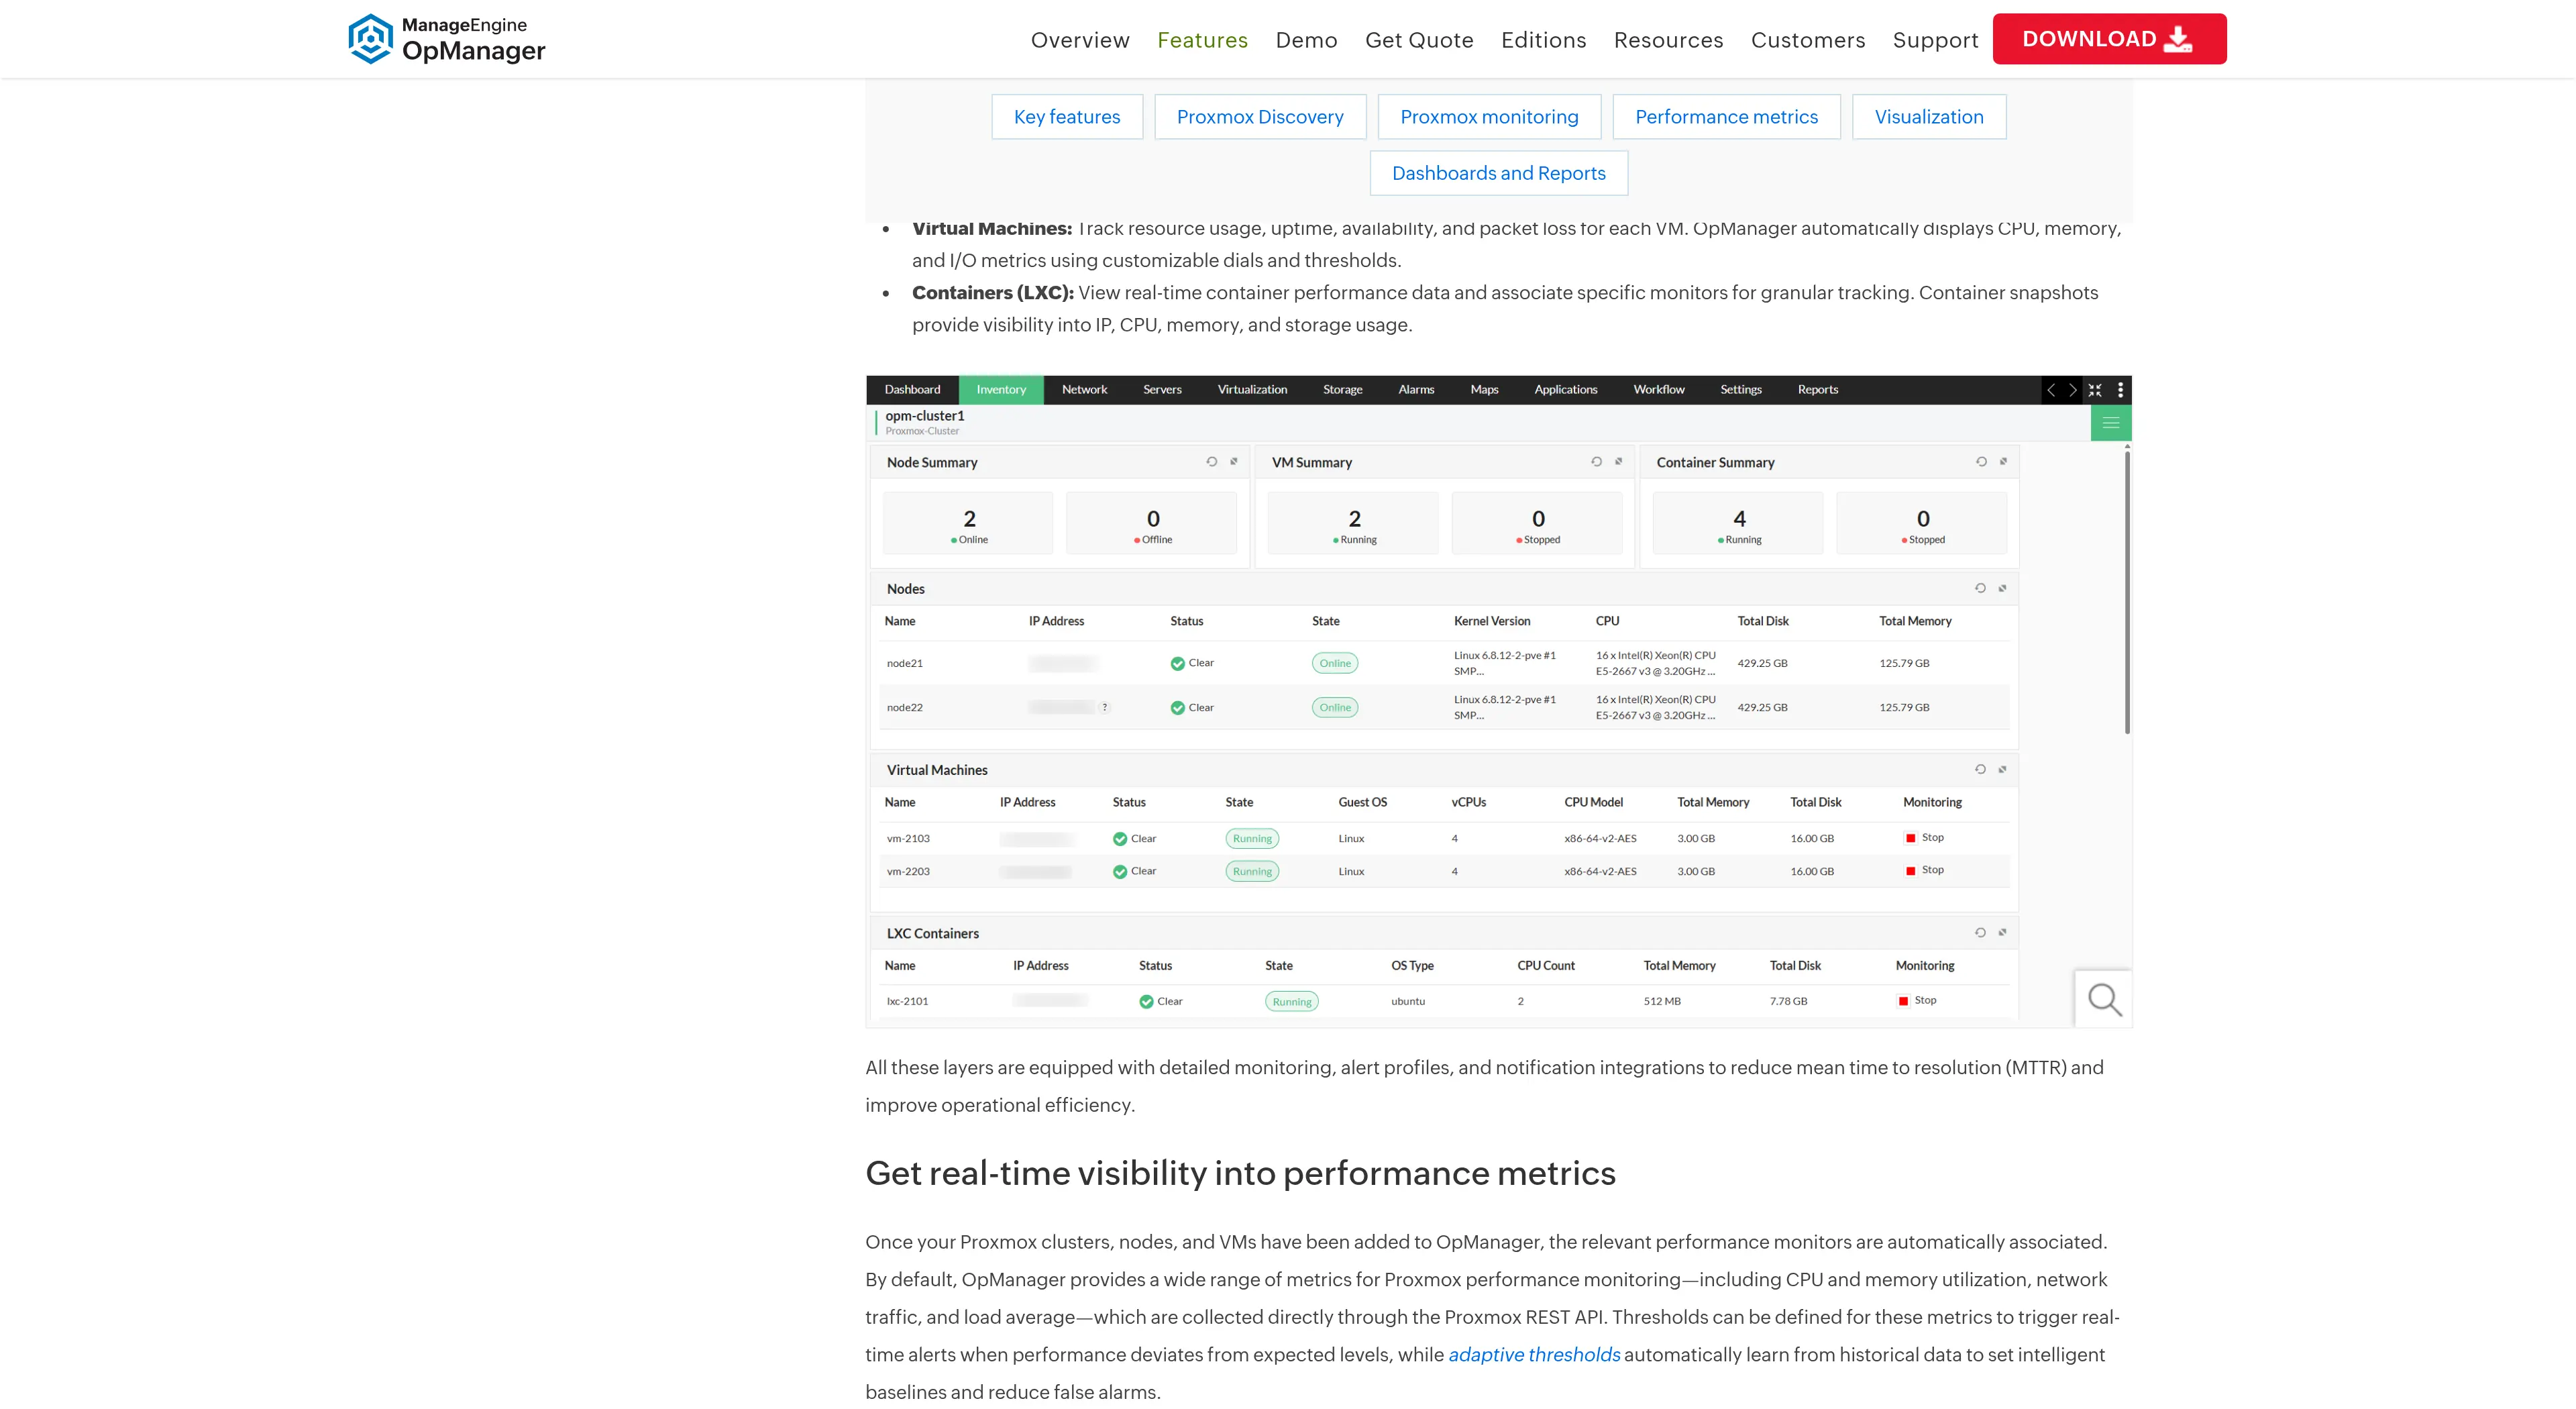
Pricing: Licensed per device, by edition and size. Ask for a quote on the guests you actually monitor rather than quoting an entry price with an unstated scope.
Pros:
- • Several hypervisors and the network in one console
- • Dependency view between cluster, nodes and guests
- • Built-in thresholds, notifications and workflows
Cons:
- • Discovery and guest identification to configure
- • Quorum and PBS coverage not established
- • Per-device licensing has to be sized on real guest counts
10. Nagios XI
Best for: Existing Nagios environments that want an official Proxmox workflow.
Nagios XI ships an official Proxmox VE wizard since XI 2026R1.3, with checks for CPU, memory, storage, cluster and quorum, backups, task errors and logs; the VMs and containers you select are created as host objects. This is XI, not Nagios Core with a community plugin, and "log errors" means checks, not a log search platform. Guest application detail comes through NCPA or extra checks.
Pricing: Standard from $2,595 for 100 nodes, perpetual licence, with the first year of maintenance and support included and renewals after that for the associated benefits. Guests created as hosts count towards sizing.
Pros:
- • Official wizard covering cluster, backups and task errors
- • Plugs into existing Nagios notifications and escalations
- • Perpetual licence for teams that prefer capex
Cons:
- • Guest detail needs NCPA or more checks
- • Full PBS monitoring not established
- • Node-based licence grows with guests created as hosts
11. Centreon
Best for: IT teams already standardizing on Centreon.
Centreon's official Proxmox VE REST API connector brings discovery and three checks, Node-Usage, Storage-Usage and Vm-Usage, with configurable thresholds. Quorum, HA and PBS are not established in the connector examined, and LXC is not explicit enough to promise container coverage. Some of the permissions it needs depend on the PVE version, so do not assume a strictly read-only token everywhere.
Pricing: The IT-100 edition is free up to 100 hosts; paid editions are sized per estate. Open-source software, connector packs and commercial features are three different availabilities.
Pros:
- • Official connector inside an existing enterprise setup
- • Node, storage and VM usage with thresholds
- • Free edition for a small estate
Cons:
- • Quorum, HA and PBS not established
- • LXC coverage to confirm before relying on it
- • Permission needs vary with the PVE version
12. XorMon
Best for: Capacity and performance across mixed datacenter infrastructure.
XorMon collects from the PVE REST API with read access and reports node, VM and storage capacity metrics, with a complementary OS agent for Linux detail. Its angle is capacity and performance across a multi-vendor datacenter. Its cluster statistics are not a quorum check, its global backup catalogue is not PBS monitoring, and LXC and PBS coverage should be confirmed before ticking those boxes.
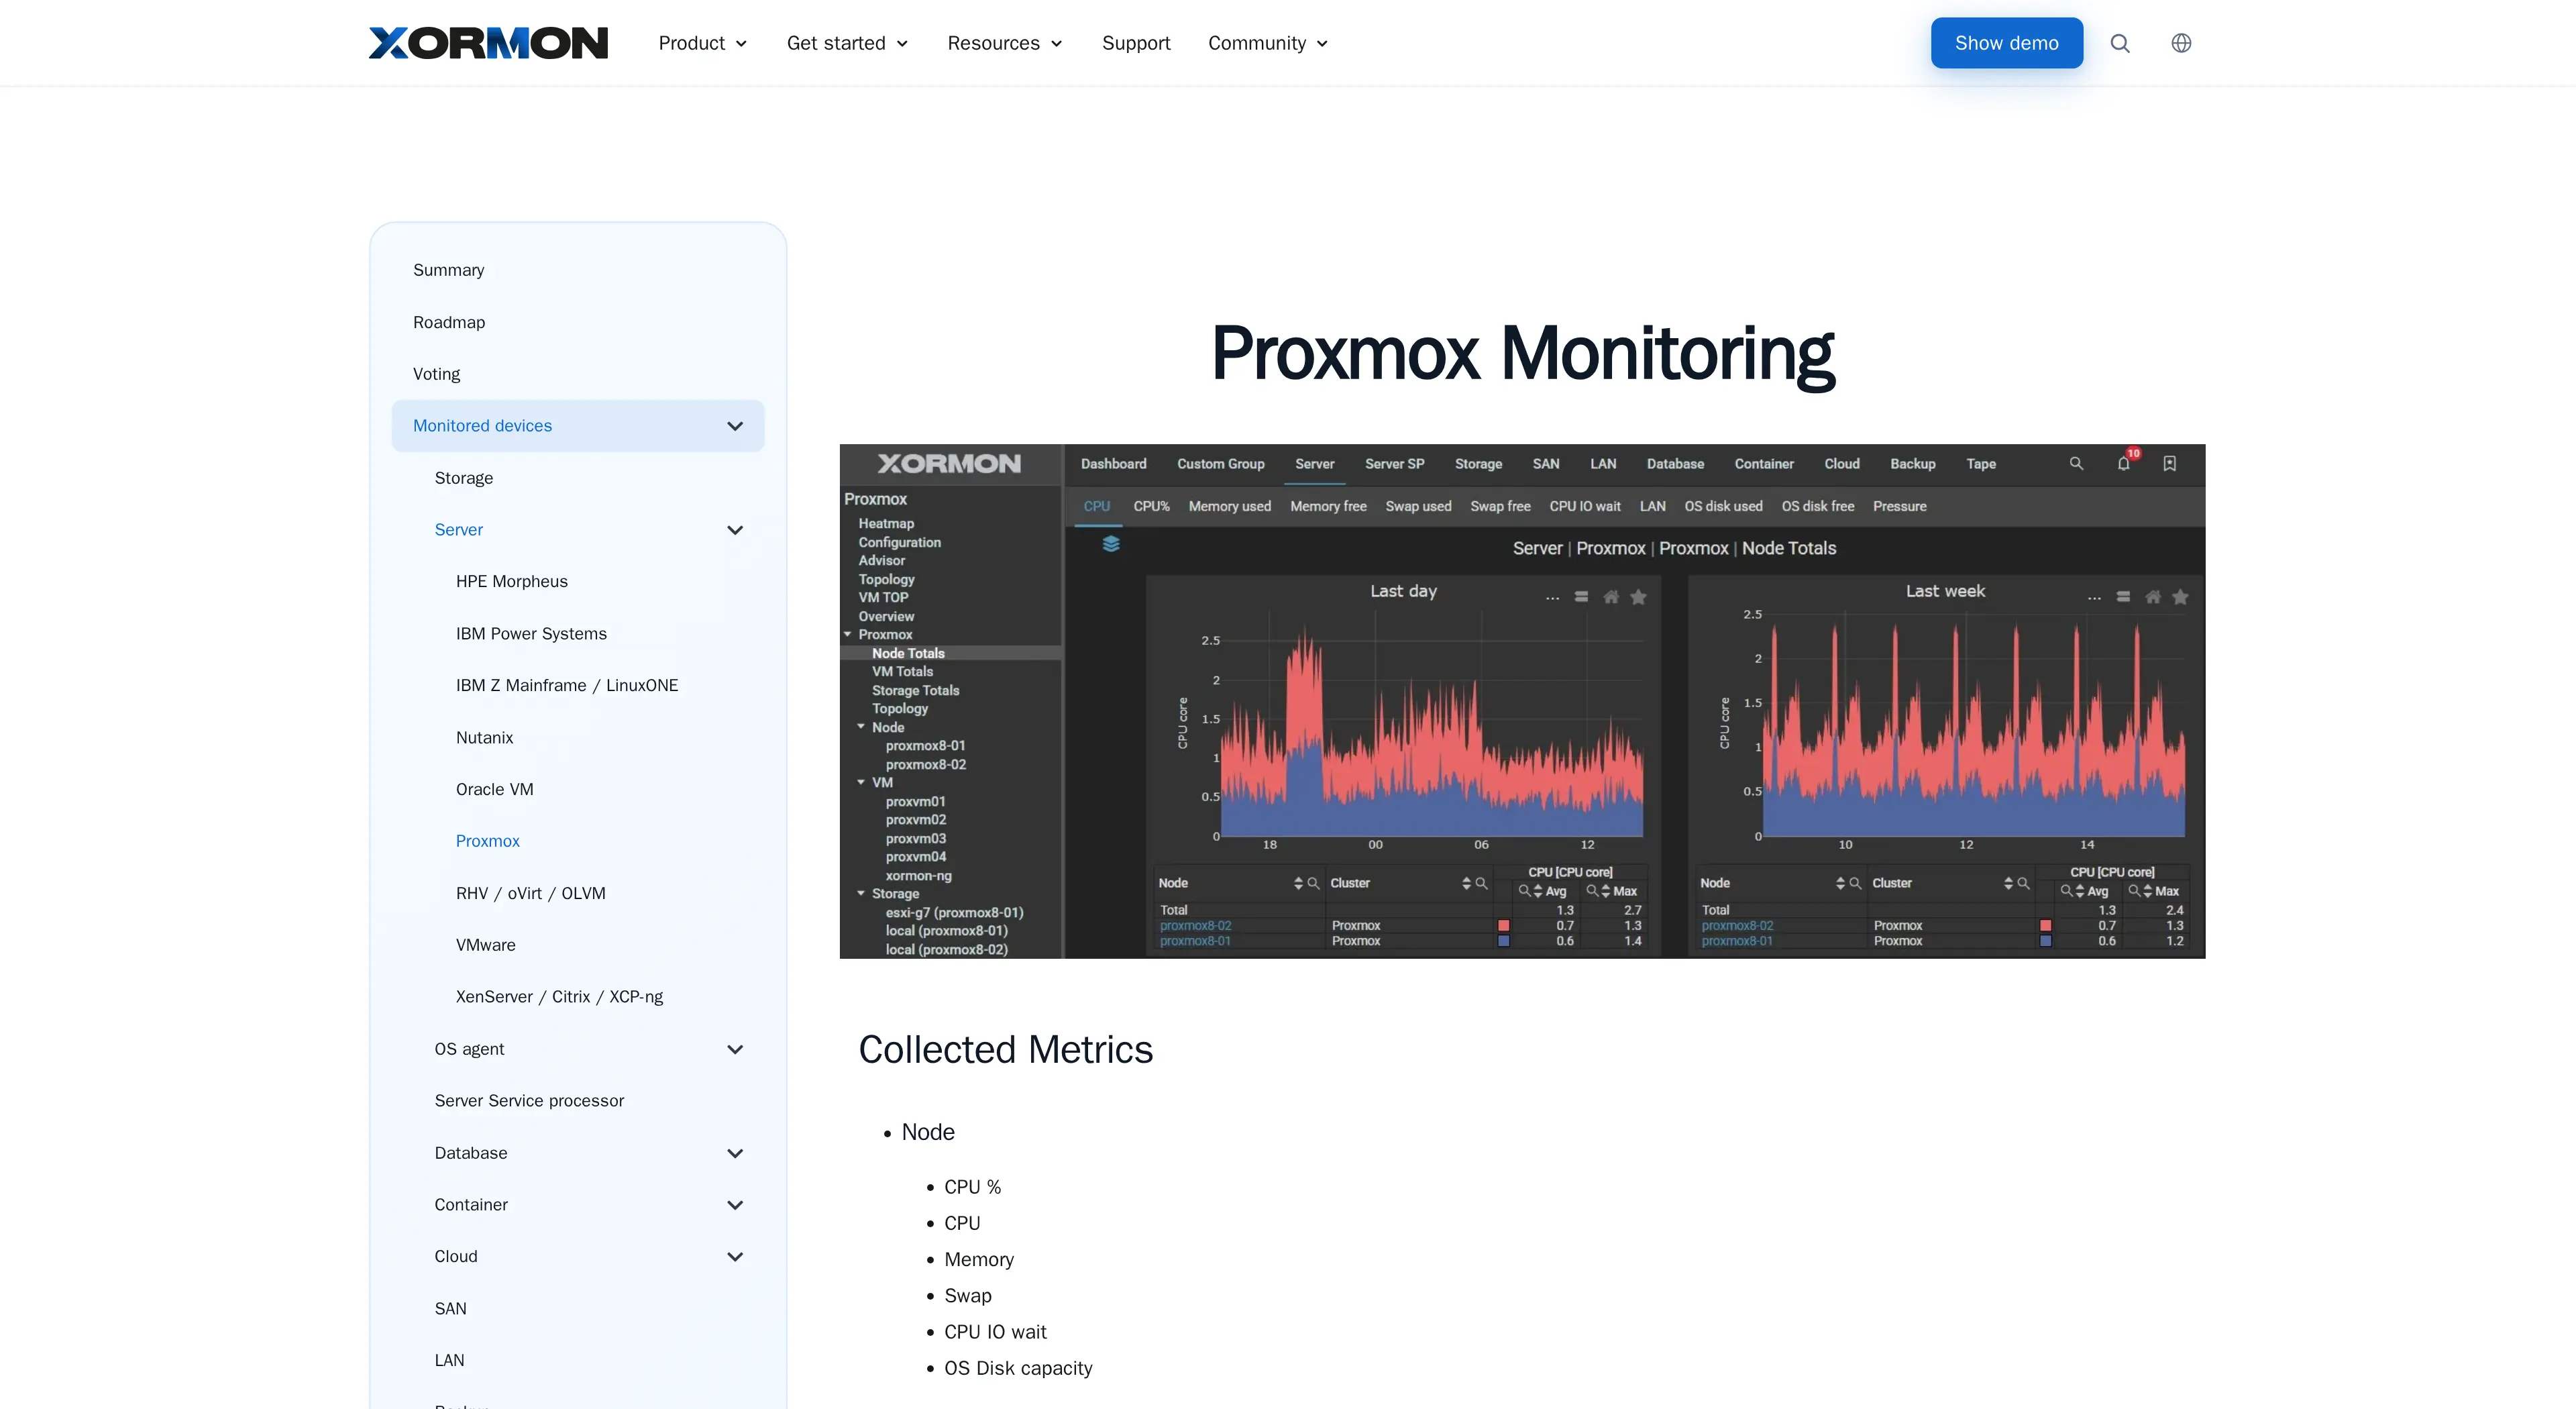
Pricing: GPLv3. The free edition is limited, notably to four Proxmox clusters and a subset of features; Enterprise, including topology and the Grafana integration, is unlocked by a support contract priced on scope.
Pros:
- • Capacity and performance perspective across vendors
- • Free edition for up to four clusters
- • Read-only REST collection
Cons:
- • No quorum check as such
- • LXC and PBS coverage to confirm
- • Key features reserved for Enterprise
Alternatives worth knowing
Five tools that did not need a full section, plus the native Proxmox tooling and the specialists you may pair with any platform above.
ProxMenux Monitor
Local monitoring on the PVE host: hardware, SMART and ZFS, VMs and LXC, logs and alerts, GPLv3, running on the node it watches. A serious specialist; for a homelab audience it could replace one of the enterprise sections above.
Icinga with check_pve
A rich community API plugin: QEMU and LXC, cluster, replication, ZFS and Ceph, VZDump backups and tasks. Configuring and operating the checks is on you. Worth it for a team already running Icinga; it is not the same thing as Nagios XI.
Pandora FMS Discovery
The Proxmox Discovery plugin covers nodes, VMs and LXC. An older Proxmox plugin in the same library is marked unmaintained, so cite the Discovery connector. Credible for Pandora users; version, scope and access conditions to validate before a deeper review.
Beszel
Lightweight system monitoring with Docker and Podman, SMART and ZFS. No PVE API or cluster integration is demonstrated in the documentation reviewed, so it is a homelab mention without a promise of VM or LXC discovery. Fivenines vs Beszel.
LibreNMS
The Proxmox extension documents per-interface traffic graphs for VMs. A network complement, not full Proxmox monitoring. Fivenines vs LibreNMS.
Native and management tooling
Proxmox Datacenter Manager is the official multi-cluster view and administration surface for PVE and PBS remotes, with a multi-cluster Ceph view since PDM 1.1. Its notification features are not a specialised monitoring engine, so keep the two roles apart. Introduction · Roadmap.
PegaProx is multi-cluster administration with metrics, alerts and PBS functions, for readers who also want to manage their infrastructure from the same place.
ProxMate and other mobile clients are useful to look and to administer; that scope does not prove continuous independent collection with an alert engine.
Specialists you may pair with any of the above
Healthchecks.io and Cronitor monitor scheduled jobs by pings and deadlines. Healthchecks adds optional start and failure signals; Cronitor documents start, success and failure plus duration rules. They are the reference points for the job-monitoring comparison below, and the choice they frame is one platform for infrastructure and jobs versus several specialised services. Neither is a native PBS integration.
Uptime Kuma, UptimeRobot and Pingdom cover availability from outside. Useful complements; not rivals for cluster resources.
New Relic, Dynatrace, Better Stack, OpenObserve, LogicMonitor and SolarWinds are not in the ranking by default because their Proxmox integration path was not demonstrated for this review. That is an editorial choice, not a claim that they cannot monitor these machines.
Site24x7 has a Proxmox integration announced as in development in the vendor response consulted. Re-check at publication; it is not presented as available here.
Monitoring Proxmox tasks, backups and scheduled jobs
Healthy machines are not enough; the operations you expect also have to complete. The table lists what to look for in a tool, scope by scope. It is a checklist, not a promise that every tool covers each line.
| Scope | Signals to look for | Alerts to compare |
|---|---|---|
| PVE tasks: backup, restore, migration, snapshot | Task identity, target, running or finished, final result, start and end, error context | Failed migration; a task with no observed end after its expected duration |
| VM and LXC backups | Last successful backup per guest, its age, inclusion in a schedule, destination, coverage of the fleet | A critical VM past its maximum allowed backup age; a new VM nobody added to a job |
| PBS jobs | Results of sync, verify, prune and garbage collection; datastore availability and capacity | Failed remote sync; verification in error; space never reclaimed |
| PVE replication | Last successful sync, errors, lag against the configured frequency | Replication too old for the recovery objective |
| Cron and systemd timers | Deadline, timezone, grace period and success confirmation; start and end where available | Missing database dump; rclone sync not finished on time |
| Result validation | Presence and freshness of the expected artefact; a separate verification or restore exercise | Script exited cleanly but the backup is missing or cannot be restored |
The native foundations are documented in the PVE task history, the PVE backup jobs and PBS maintenance. Prune and garbage collection are two distinct operations: a successful prune does not mean space was reclaimed.
For each tool, ask how the signal arrives: an API read, a plugin, a log, a native notification, or a ping you add to the script. Duration can only be measured precisely with start and end information. A missing final ping detects a missed deadline; on its own it does not say whether the job never started, failed, or is still running.
The asynchronous case. When a command or an API call launches a task in the background, acceptance is not success. The check has to wait for the final result before confirming, and a single global signal for a whole batch hides the one VM that failed inside it.
Scenarios to reproduce with your candidate tool: every critical VM has a backup under 24 hours old; the off-site copy is confirmed before the working day starts; a failed PBS verification pages the team; a daily dump with no success signal alerts once its grace period passes. The durations are examples to adapt, not universal thresholds.
Four distinctions to keep: a scheduled task is not an executed task; a launched task is not a successful task; a successful backup is not a finished remote copy; verified data is not a tested restore.
How the 12 tools compare
A factual base, not a score. "Complement" means an extension, collector or extra check; "not established" means the documentation examined did not confirm it, which is not the same as impossible. Grafana appears twice because its two collection chains do not see the same things.
Scroll sideways to see all columns →
| Tool | PVE collection path | VM / LXC | Cluster / quorum | Backups: scope covered | Billing unit | Pricing |
|---|---|---|---|---|---|---|
| Fivenines | Agent + API | Per-guest freshness (agent); PVE + PBS jobs via notifications; scripts via heartbeats | Monitors; API guests included | €19/mo | ||
| Pulse | API, optional agent | Cluster view; confirm the alerts you need | PVE + PBS | Per instance, by plan | Free / $39/yr | |
| Zabbix | Official HTTP template | PBS not established | OSS; hosting, support | Free | ||
| Checkmk | Special agent + Linux agent | PVE checks; HA / replication | PVE backups; PBS community | Services | Free / €190/mo | |
| Grafana + Prometheus | Community PVE exporter | Quorum / HA via exporter | Job coverage only; PBS to add | OSS; infra or cloud | Free / $19/mo | |
| Grafana + InfluxDB | Native metric export | Guest statistics | Depends on exported series | Complement | OSS; infra or cloud | Free / $19/mo |
| Netdata | Agent + cgroups; exporter | Exporter for quorum / HA | PBS complement | Nodes | Free / $4.50/node | |
| PRTG | Official API sensors | Cluster Health sensor | Backups / PBS complement | Sensors | Free / $200/mo | |
| Datadog | Agent + official API integration | Quorum metrics | PBS not established | Hosts + products | $15-23/host | |
| OpManager | Official REST integration | Cluster view; quorum to confirm | PBS not established | Devices / edition | Quote | |
| Nagios XI | Official API wizard | Cluster / quorum | PVE backups; full PBS not established | Nodes | $2,595+ | |
| Centreon | Official REST connector | VM yes; LXC to confirm | Quorum not established | Not established | Hosts / edition | Free / quote |
| XorMon | REST integration | VM yes; LXC to confirm | Cluster view; quorum to confirm | PBS not established | Free tier / support | Free / quote |
Tasks, backups and jobs, in four separate columns
A PBS integration, a PVE task-error check and a script heartbeat answer different questions, so they get their own columns. Where a cell is a tick, still check whether the alert fires on an explicit failure, a missed deadline or a measured duration.
| Tool | PVE task results | PVE backups, per-guest freshness | PBS jobs | Scheduled jobs / heartbeats |
|---|---|---|---|---|
| Fivenines | PVE notifications | PBS notifications | ||
| Pulse | Not established | Not established | ||
| Zabbix | Not established | Not established | Not established | Not established |
| Checkmk | Not established | Community extension | Not established | |
| Grafana + Prometheus | Not established | Job coverage only | Not established | Not established |
| Grafana + InfluxDB | Not established | Not established | Not established | Not established |
| Netdata | Not established | Not established | Complement | Not established |
| PRTG | Not established | Not established | Not established | Not established |
| Datadog | Not established | Not established | Not established | Not established |
| OpManager | Not established | Not established | Not established | Not established |
| Nagios XI | Task errors | Not established | Not established | |
| Centreon | Not established | Not established | Not established | Not established |
| XorMon | Not established | Not established | Not established | Not established |
For storage, read each tool section for the three levels separately: PVE capacity, ZFS / Ceph / SMART health, and the guest filesystem. Support at one level was never converted into three ticks.
A worked pricing example
Take a small shop: 3 PVE nodes, 30 VMs, 10 LXC containers, 1 Proxmox Backup Server and 5 availability checks on the services the guests serve. Here is what it costs in Fivenines monitors, using the rule that guests discovered through the API are not monitors.
- • Agent on the 3 nodes, for local visibility and reporter redundancy: 3 monitors
- • Agent on the PBS server, for its resources and datastore capacity: 1 monitor
- • 5 uptime checks: 5 monitors
- • The 40 guests discovered through the API: 0 monitors
Total: 9 monitors, which fits the Starter plan (15 monitors) at €19/month, or €15/month billed annually, before applicable taxes. Pick the plan on the notification channels and features you need, not only on the count.
Scope of this example: guest metrics as seen by Proxmox, PBS resources and the availability of the endpoints you add. It does not include an agent inside each VM (only needed for in-guest processes, services and application checks), nor the task monitors that take the PVE and PBS job notifications (the variant below). Adding an agent in 10 guests brings the count to 19 monitors, which is the Pro plan.
Variant with jobs: adding 3 task monitors (one for the PBS verify job, one for the nightly database dump, one for the off-site copy) takes the base scenario to 12 monitors, still on Starter. The PBS one is wired once through the webhook target; the two scripts send their own success ping. How task monitors are counted.
For the other tools, keep exactly this scenario and price their own unit: sensors configured in PRTG, services discovered in Checkmk, host objects in Nagios XI, billable hosts and modules in Datadog, infrastructure, storage, series and operating time for Grafana. Until those quotes or comparable configurations exist, percentage savings would be invented, so none are given here.
Ready to monitor your Proxmox cluster from one agent?
14-day trial. No credit card required.
No credit card · 2-minute setup · Cancel anytime
How to choose the right tool for your situation
Recommendations deduced from documented scope, without any measured performance ranking.
Teams and MSPs wanting a managed platform
Proxmox monitoring plus the other checks in one place, with a cost that does not grow per discovered guest.
Recommended: Fivenines
Proxmox and PBS first, self-hosted
Specialisation and backup coverage matter more than breadth.
Recommended: Pulse
Open source with a general monitoring platform
An official template and unlimited customisation, at the cost of operating the server.
Recommended: Zabbix
Proxmox next to the rest of the estate
Servers, network devices, uptime checks, databases and services in one place, with the cluster as one more surface rather than a separate console.
Recommended: Fivenines. If you are already standardised on Checkmk, PRTG, Centreon, Nagios XI or OpManager, their Proxmox modules let you stay where your alerting and habits are.
Prometheus or InfluxDB already in production
Reuse the collection, the storage and the know-how.
Recommended: Grafana with the matching collector
Datadog already central for the applications
Bring hypervisor, OS, applications and logs together where the team already looks.
Recommended: Datadog
Homelab centred on hardware and ZFS
Pool health, SMART and RAID on the node, and a watcher that is still there the day the node is down.
Recommended: Fivenines; ProxMenux Monitor if everything has to stay on the host
Backup scripts and scheduled jobs next to server monitoring
Missed, late and failed runs, from the PVE and PBS notifications and from your own scripts.
Recommended: Fivenines. A standalone ping service such as Healthchecks.io or Cronitor only makes sense next to a platform that has no task monitoring of its own.
Common mistakes when monitoring Proxmox
Mistake #1: Monitoring only the host
Node CPU and memory say nothing about a stopped guest, a degraded shared storage or a database that stopped answering. Add guest inventory and resources, shared storage, and checks on the applications that matter.
Mistake #2: Confusing "VM running" with "service available"
QEMU state answers one question; an HTTP, TCP or application check answers another. You need the second one for anything users touch.
Mistake #3: Reading every memory metric as the same number
Allocated memory, consumption as seen by the host and the guest OS's own view are three different definitions, and each tool documents which one it collects. Do not compare values that do not measure the same thing, and do not copy a universal threshold from a blog post.
Mistake #4: Putting all the monitoring inside the cluster it watches
Design one independent check and test that an alert actually arrives when the cluster, or its network access, disappears. A redundant stack inside the same failure domain is still inside it.
Mistake #5: Treating missing data as good health
A collection failure, an empty inventory and a value of zero are three different states. Insist on a freshness alert so a silent collector is an incident, not a green dashboard.
Mistake #6: Saying "backups monitored" without naming the check
Freshness per VM, job results, coverage of the fleet, verifications and restore exercises are five different checks. Know which ones you actually have.
Mistake #7: Ignoring maintenance and migrations
A planned shutdown or a guest moving to another node must not open a useless incident or a permanent duplicate. Check how the tool keeps guest identity across a migration and how maintenance windows work.
Mistake #8: Comparing only entry prices
Separate a discovered VM from an agent inside it, and count metric storage, retention, support and the time someone spends operating the tool. Price the same scenario in each vendor's unit, as in the worked example above.
Mistake #9: Confusing a heartbeat with a detailed task result
Send the confirmation after the job really succeeded, and wait for the final result of asynchronous operations before pinging. A heartbeat proves the deadline was met; on its own it explains no failure and proves no restore.
Frequently asked questions
Questions
What is the best Proxmox monitoring tool? +
What is the best free Proxmox monitoring tool? +
Does Proxmox have built-in monitoring and alerts? +
Can I monitor Proxmox without installing an agent in every VM? +
Can I monitor QEMU VMs and LXC containers with the same tool? +
How do I monitor Proxmox Backup Server? +
Can I monitor Proxmox tasks, backup scripts and cron jobs? +
Will monitoring detect a backup job that never starts? +
Can Grafana monitor Proxmox directly? +
Can I run monitoring inside Proxmox? +
Do I need Proxmox Datacenter Manager as well? +
Does every VM increase monitoring cost? +
Competitor pricing last reviewed September 2026. Entry prices are the cheapest paid tier and usually assume annual billing; vendors reprice often, so confirm with the vendor before you buy. Capabilities come from vendor documentation and repositories; no hands-on test or benchmark was run for this comparison.
Ready to get started?
14-day trial. No credit card required.
No credit card · 2-minute setup · Cancel anytime